For personal use, requiring login is fine, but if I wanted to share it publicly then it would need to use the read key. Many (all?) of built-in emoncms apps use read keys.
Given that I’m already sharing via MyHeatPump app, it’s not hugely important to me to be able to share the MMSP app. Probably only useful for comparing two MMSP systems.
Some people may have privacy concerns about sharing live data publicly, so the addition of a “delayed” option could be useful, as @TrystanLea suggested in his opening post on Sharing heat pump data.
I’ve also started sharing my ASHP data in the same was as @Trystan by using Emoncms to sync our local data to emoncms.org, this allows us to share all data without the risk of sharing live data:
@glyn.hudson thanks; it’s fascinating to see someone else’s data who has a very similar heat pump, seems Samsung is a fairly exclusive club at the moment.
I’m interested in the behaviour seen on say Friday 7th October (and others) but especially between 18.00-19.30 where it runs for 5 minutes and then (I think) just runs the pump(s) for 3, then repeats the cycle. My 16kW has this behaviour too and it seems strange but more efficient to do this than to run constantly at the energy levels either side of the episode.
Do you know what’s going on?
Is it okay or something I should try to tune out?
Cheers!
Edit: p.s. your link to your emoncms page is incorrect but I knew what to do
I’ve also published mine, and HeatGeek has just published theirs, possibly one or two others have done the same. Is the next step to put these into a directory of heatpumps, with basic information?
I think it needs to be a dedicated page that can scale with larger numbers of heat pumps.
Probably with a table that can be sorted/filtered, with columns for make, size, location, property type, etc plus SCOP, last week’s COP, consumption and more.
Thanks Tim , that would be great! Happy to contribute, should get more time once the new hardware is out…
We could host is on the heatpumpmonitor.org domain replacing what’s there at the moment. Maybe just automatically updating from a repository on GitHub that we can all contribute too…
I’d also like to create a graph for HTC.
So using average daily outside temperature and daily heat output (for space heating). You’d have to add some sort of hardcoded daily subtraction for average hot water use.
I’ve been thinking, and I’ve come up with a cunning plan for building a prototype:
First, a Google form where people can submit details of their HP monitoring site, and other information like what Trystan had proposed. This makes it easy to collect and maintain the information without having to build a database with accessible forms, logins, and all that. We can do that bit later as and when it’s needed.
Second, we build a lightweight web page that displays the data from the Google sheet and links out to the stats for each system.
But then, instead of linking out to other websites we can host a single instance of the MyHeatPump app, and pull in the relevant data directly from emoncms. All we need to know is the address and read apikey. The app can also be not-fresh, i.e. not show data from this week, or something.
We can then have a background process that collects overall SCOP, last week’s COP, and other stats from each system to display in the main table. A simple database will be just fine here.
Thoughts? Does this seem like a good way to start?
@Timbones that sounds like a good way to start. Is it straight forward to pull in the data saved via a google form? Can you go back and edit what you’ve entered?
To keep the data side simple to start with it could just be a link to heat pump dashboards hosted elsewhere first e,g emoncms.org or self-hosted, then step 2 might be pulling in overall SCOP etc and 3 integrating the heat pump app directly if that’s what makes sense?
Yes, we can publish the data as a .csv that another system can download and render. Either PHP running on a server that outputs HTML, or pure client-side Javascript that builds a table dynamically. The later would be easier for collaborative development without needing a web server.
Not easily, no. We probably wouldn’t let anyone edit the sheet directly, but we could have a handful of moderators who can edit data on request. That’s something we’ll have to figure out as we go, and if it becomes to burdensome that that’s the point we need to do it properly.
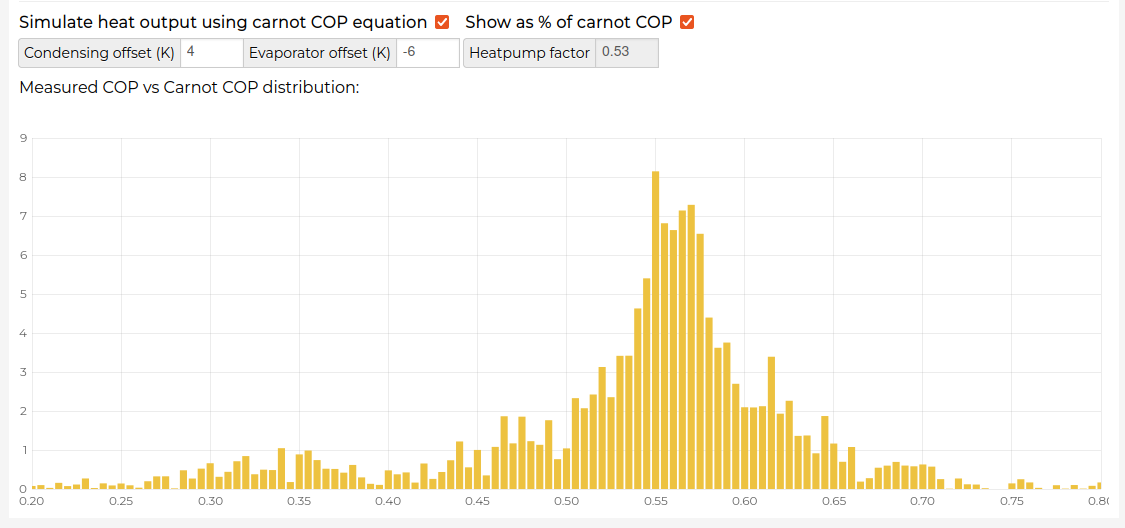
Glyn’s is showing a much wider distribution. but that’s likely an artefact of a relatively high rate of cycling. In Glyn’s case fairly rapid cycling does not seem to be detrimental to COP performance…
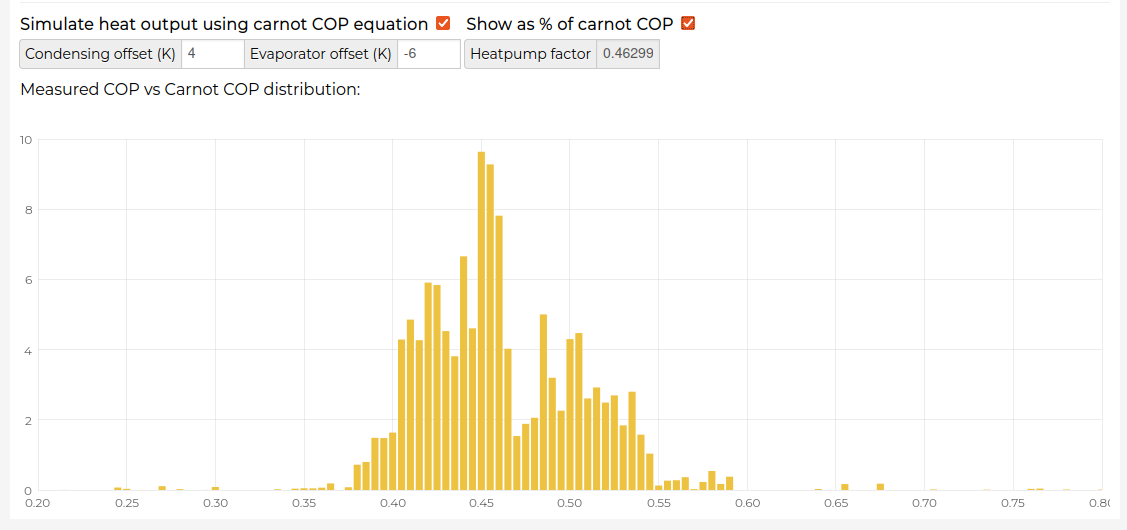
Zooming in a bit on a period where Glyn’s heat pump is cycling less does give a slightly more centrally focused distribution, though the mean value in that example seems to be quite a bit lower…
this is probably a graph to be used with a lot of caveats but assuming accurate sensors, quick response from the the heat meter, low central heating pump and controller consumption it should get at a comparison of the performance of the heat pump unit itself rather than the overall COP which is a combination of the heat pump performance and how the heat pump is controlled, average flow temperatures etc…
I’ve created a public dashboard of heat pumps! It’s a very crude prototype, but will allow us to collect together the emoncms apps that have been published so far, and learn what might work.
Submissions are handled by Google Forms, and will appear in the table once moderated. Names and emails will be kept hidden. If there are some other questions that you think would be good to add, please let me know.
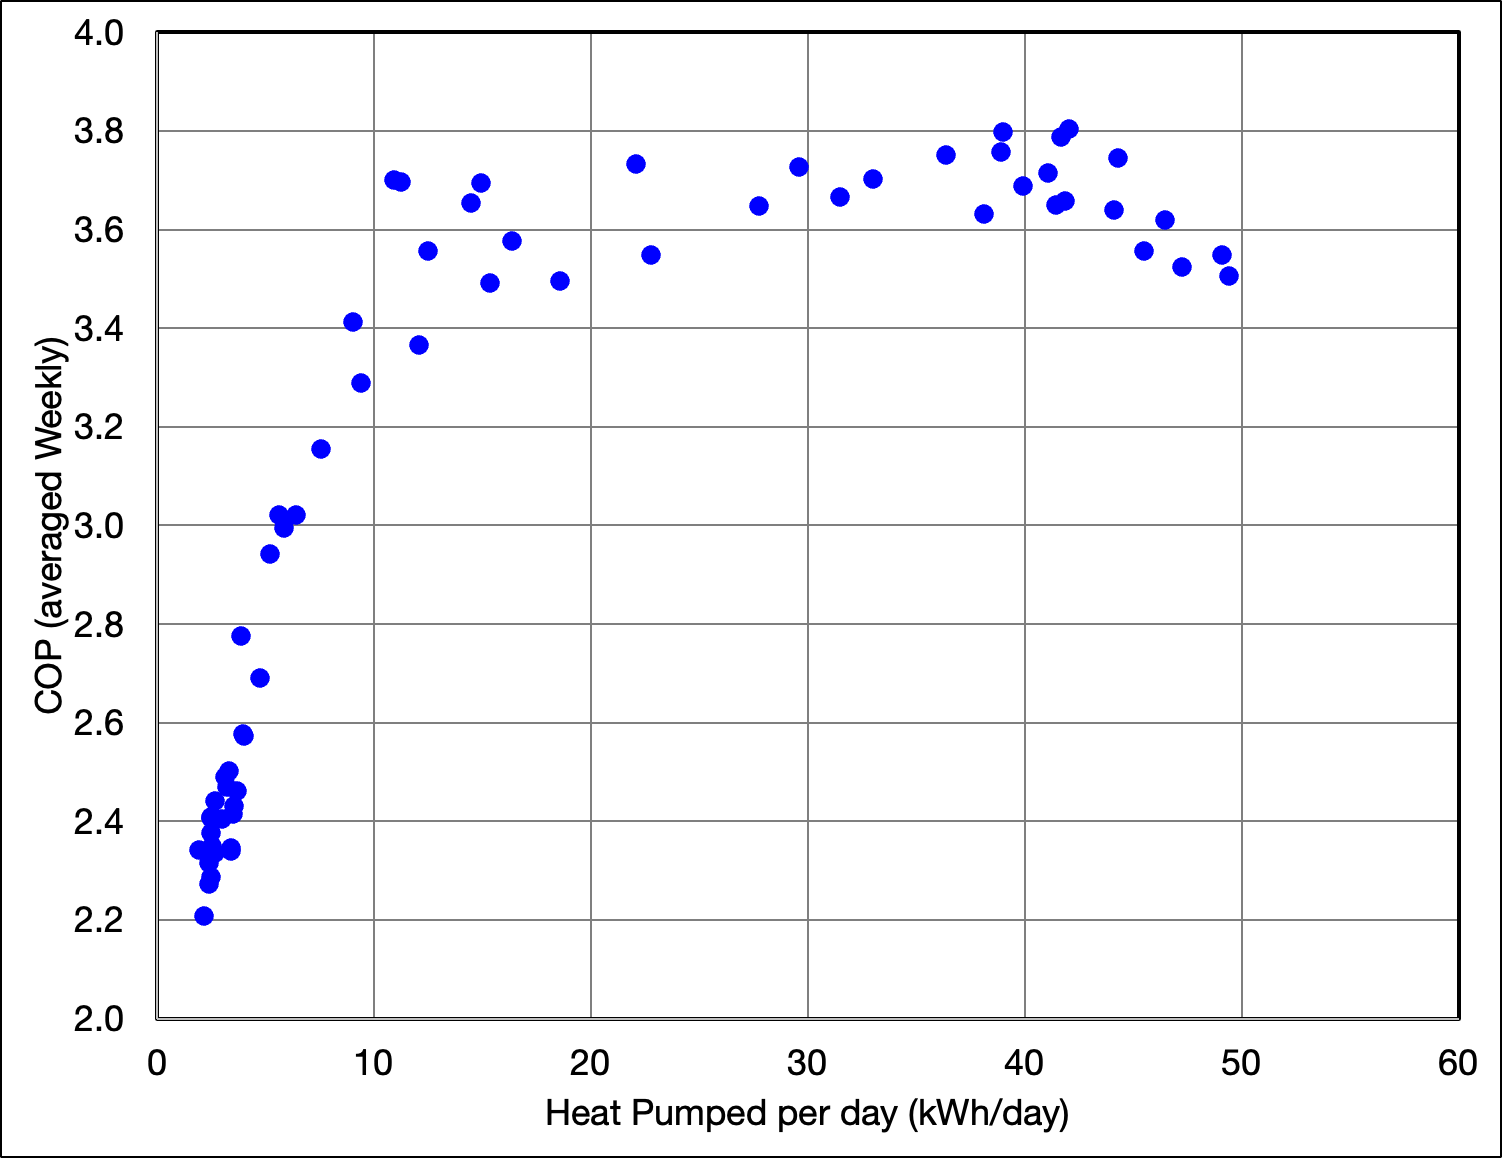
Yeah I consider this graphic and an “envelope” within which your heat pump (Michael’s in this case) is able to deliver heat. There are a variety of ways of measuring heat pump performance and this one is useful to see effectively how well the system performs delivering maximum kWh heat versus COP.