Sharing heat pump data, An open heat pump dataset?

Just getting to this, apologies - thank you @TrystanLea for initiating and for the work on public dashboards. Timely for me as a few villagers will be showcasing heatpump installs at a local energy fair in Buckinghamshire at the end of the month, so this will serve as a nice real-time demonstration.

I would support @Timbones latest comments - and I would be very happy to contribute to a detailed public dataset assuming location/identity is sufficiently fuzzed (had wanted to contribute to the MMSP, but our installer declined to participate sadly). That said, would be keen to explore how/what/why this could be contributed effectively and what aspects we would want to build in to maintain a reasonable level of data quality. Weather Underground springs to mind.

I’m very happy with the OEM data coming off our Midea system and Sontex meter installed in January - which has proven essential in optimising and diagnosing some early teething issues. I’m not particularly confident in my COP calculations but will continue to work on this!

1 Like

They threw out alot of data, but its not surprising considering some of the installs included in the larger dataset.

Heat pumps with compensation forced OFF and a static flow temp set so installers don’t get callbacks… @BetaTeach will be spinning in his chair.

Heat pump performance monitoring becomes alot more valuable when we have measured heat loss data from the place where its installed, either before or after!

That’s exactly what my installer did! I’d turned on weather compensation before they’d commissioned it.

Yes, in a way, more useful perhaps than a lot of detailed data might be a series of written case study type documents in a searchable format. Each document or case study web page might have the following details:

  • Heat loss rate of the building in W/K
  • Space heating demand in kWh/m2.year
  • Approximate location
  • Heat requirement of each room at design temp and heat output of heat emitters at design flow temp.
  • Type of emitters, under floor heating, radiators, fan assisted radiators .
  • Number of zones
  • How zones are used in the control strategy
  • Type of controls, thermostats, locations etc.
  • With or without buffer or low loss header
  • Central heating pump models
  • Hot water control strategy
  • Legionella protection settings
  • Heat pump model

Then in terms of data it could be in increasing levels of detail.

Level 1: Annual electric consumption and heat output if available
Level 2: Monthly electric consumption and heat output, (outside temperature available via weather underground perhaps).
Level 3: Monthly disaggregated into Space heating, Water heating and standby
Level 4: As level 3 but with internal temperatures (that would match my analysis here Trystan Lea)
Level 5: Average daily profiles
Level 6: Detailed data with or without data restrictions

Perhaps the way to prototype this would be to build this as a series of forum posts to start with rather than spend time trying to make a nice website? I should try to make a single contextual page for my heat pump…

Great to hear @thedawnbefore and thanks for chipping in here!

Here’s a quick go at a one page format that could perhaps be built into some kind of searchable and sortable database?

An EcoDan ASHP case study

  • Building heat loss rate: 205 W/K (SAP assessment), 173 - 192 W/K based on monitoring.
  • Space heating demand: 111 kWh/m2 (SAP assessment)
  • Space heating demand: 8558 kWh (SAP assessment)
  • Floor area: 77m2
  • Approximate location: North Wales, UK
  • Heat loss at design temp: 4.5kW (8866 kWh) (revised down since first assessment)
  • Design temp: -3C
  • Heat output of radiators: 4.5kW (@40C Mean Water Temperature)
  • Type of emitters: Standard K2 radiators
  • Number of zones: 1
  • Type of controls: Single thermostat and manual flow temperature control, typically flow temp set to 32C but increased to 34C or 36C if house is not warming up fast enough. Thermostat turns heat pump off at target temperature.
  • Buffer or low loss header: No
  • Central heating pump model: Wilo Pico
  • Hot water control strategy: Two daily heat up cycles one at 4am, the other at 2pm, heating typically to 42C tank temperature.
  • Legionella protection frequency: 2 weeks (>50C, sometimes 60C).
  • Heat pump model: Mitsubushi EcoDan 5kW (heat) r410a

Room by room heat loss detail:

Room Heat loss Heat output Configuration
Livingroom & Diningroom 1179W 1956W 3x 1200x600 K2’s
Hall 370W 652W 1x 1200x600 K2’s
Kitchen 771W 0W heat from livingroom
Bed 1 473W 557W 1x 1200x500 K2
Bed 2 515W 557W 1x 1200x500 K2
Bed 3 274W 387W 1x 1000x400 K2
Landing 158W 0W heat from hall drifts upstairs
Bathroom 773W 435W heat from hall and other rooms drifts upstairs
Total 4513W 4544W

Full calculation example: https://openenergymonitor.org/heatlossjs/

Monitoring: Class 1 electricity metering of outside unit, inside controller, central heating pump and 3 way valve with an SDM120, Class 2 heat metering with Sontex 440. CT sensor on the immersion heater.

Level 1:

Year Electric consumption Heat output COP
2020 1946 kWh 7615 kWh 3.91
2021 2378 kWh 9643 kWh 4.04

Level 2,3 4:

Profiles shared above & detailed data Emoncms - app view dashboard
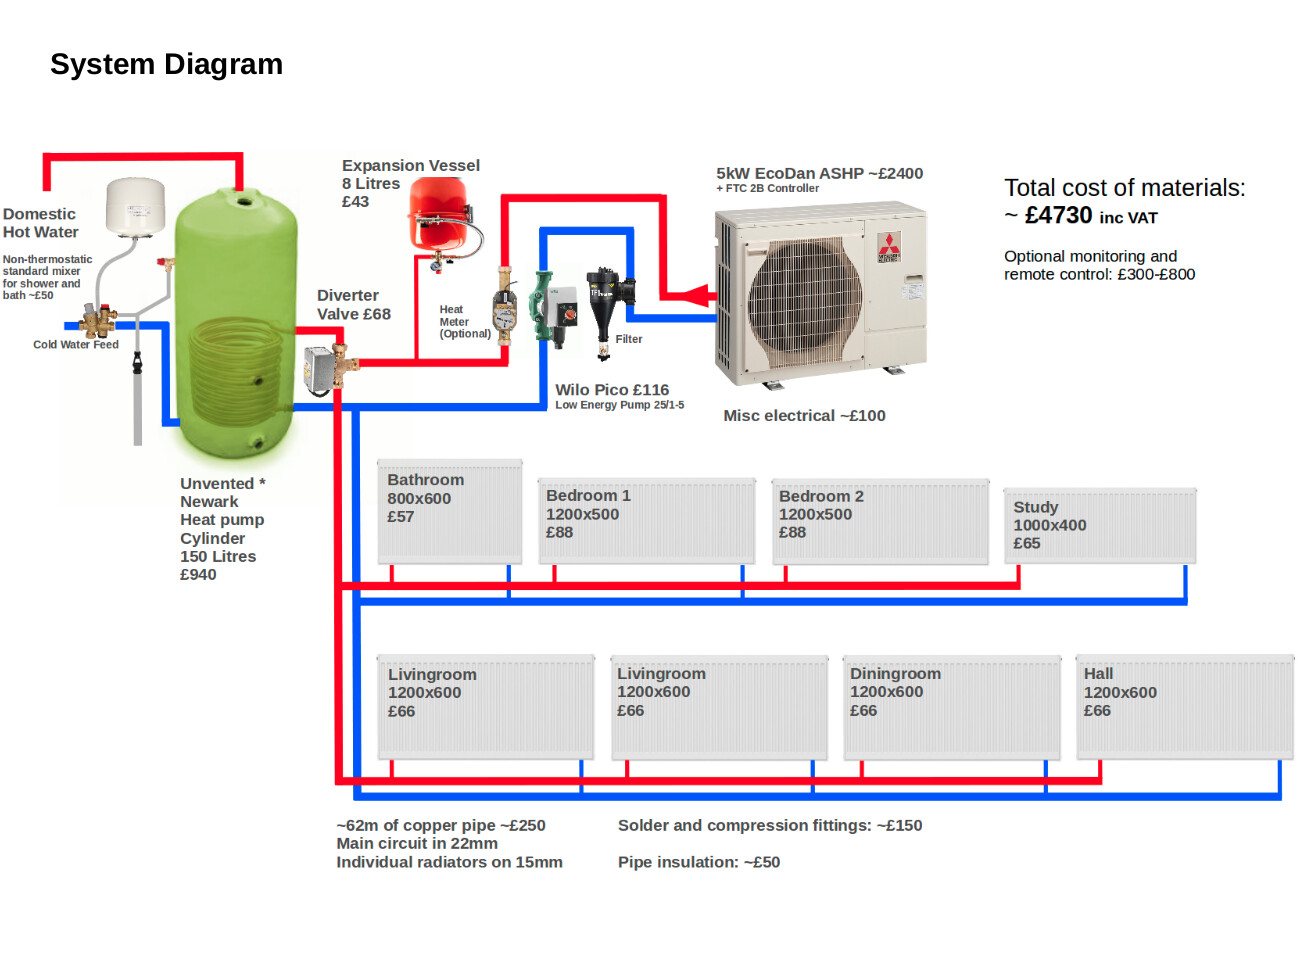
System diagram:

Is there anything else that would be good to add?

1 Like

That seems to be pretty comprehensive. I think you need both the
overview and have the possibility of drilling down into the details.

Personally i am pretty relaxed about usage as I am here all the time but
it could be an issue for some.

perhaps we need a way to completely anonymise inputs in a way that
protects the user supplying the data. after all from a data viewpoint
what is needed is a way to weed out spurious inputs from bad actors
trying to game the system.

Regards

Nigel

1 Like

Thanks, @TrystanLea, the draft outline looks very solid - we could easily contribute in line with this format.

Few questions/thoughts:

  1. Number of Zones: Under Type of Emitter, assume this could be per Zone, in cases with two or more Zones with multiple emitter types i.e. UFH and Radiators

  2. Buffer/Low Loss Header: Could we indicate whether there is hydraulic separation and if so type, e.g. None, Buffer, Low Loss Header, Plate Heat Exchanger, Other etc? (With more installers putting plate heat exchangers in (in our case, upside down!), it might be helpful to understand these characteristics given the heat loss between the types of devices used.

  3. Age Installation/Commissioning month? Although the consumption data by year also gives an approximation. Not sure if participants would want this fuzzed. It would be interesting to track performance against system age.

  4. DHW & Plumbing characteristics: Not sure to what extent the details in the diagram would also be represented in this taxonomy (nice diagram btw) - the Cylinder and Plumbing characteristics would be interesting (we inherited a system that was plumbed with 50% combination of unlagged Polypipe :scream: and new lagged copper - or would this be superfluous due to overall heat loss values already stated?

I’ll throw my data into the ring too then - here’s my EcoDan 11kW ASHP heating a 1960s house somewhere in Yorkshire. Mediocre insulation with radiators.

That sounds like a useful option to have, yeah.

2 Likes

Great thanks @Timbones! good to see! Can you remind me what your using for electric and heat monitoring?

Glyn has uploaded his yesterday too: https://emoncms.org/samsung5kw

I have the official MMSP package from Mitsubishi (includes Sontex 440) which is reporting directly to the EcoDan FTC. I then scrape the energy values from MELCloud every minute into emoncms. Didn’t buy an emonPi, sorry.

1 Like

Great, that’s fine :slight_smile: I noticed the standby electric consumption jumped around a fair bit, are they reading from an SDM120 Modbus meter or perhaps the pulse output? the average of ~18W standby looks about right though for an EcoDan.

Do you have it on auto adapt, room temperature control?

COP looks great for the last few weeks! heat meter data early on seems to have gone a wry maybe affecting the running total?

Consumption is measured by reading 1 Wh pulses from the emlite electricity meter, so the idle power isn’t as smooth as it really is.

The built-in room stat isn’t much use when the whole thing is in the airing cupboard, so I’m using manual flow control. I set the flow temperature externally (via MELCloud) using my own weather compensation code. Actual room temperature is the average of 5 Bluetooth sensors around the house, and is used to determine when to turn the heat pump on and off.

Yes, they had initially supplied the incorrect meters to begin with, so it was a bit of a mess then. I’ve not tried to correct the running totals, hoping the that errors will become insignificant with time. I mostly look at weekly/monthly deltas anyway.

2 Likes

It’s great to see the sharing.

It has made it more obvious to me that we would benefit from deep-linking so we can point people to an area to investigate and they can slice-n-dice around it.

I know my app is hopelessly naive and doesn’t even have a way to say “open it showing 1 week”, let alone with a specific time window or with a specific set of feeds showing / highlighted.

IMHO the best way to achieve deep-linking is to update the query string in the address bar as you make changes in the app state. I’m open to other ideas though.

MyForest

3 Likes

That’s a good idea! I’ve had a quick go at adding this into the my heatpump app here Comparing master...myheatpump_url_search · emoncms/app · GitHub.

I think Im used to refreshing the page to get back to the starting view… it feels a bit strange that it loads the last state… I wonder if placing the view parameters in the URL needs to be an option that you enable or happens on clicking a share button? or perhaps it’s just something that you get used to…

1 Like

Hi @TrystanLea

Looks like you’ve got the right sort of idea.

What I often see is that if the user just comes it “as normal” you use a “time window” parameter, so in the case of my app I’d say something like ?last=3600.

If the user chooses a new time window, say a day then you update to be ?last=86400.

Then, if they select specific start / end time you use your start and end params like in the PR.

So, I think that’s somewhat easy to do because the apps have specific events when the user presses a “time window”:

and also there is a specific event when the user selects fixed points using the UI like this:

I haven’t been in the code recently enough to know if I’ve missed other mechanisms that might cause the time window to vary.

Our ASHP stats Nov-2022
Elec consump = 242Wh
Overall COP = 3.78
COP space heat = 4.11
COP hot water = 2.12
total heat delivered = 916 kWh
Average target flow temp = 30.6°C
Average flow temp = 32.1°C
Typical Power draw SH = 450W
Typical Power draw DHW = 1.4kW

2 Likes

Our ASHP stats Jan-2023
Elec consump = 459 kWh
Overall COP = 3.02
COP space heat = 3.15
COP hot water = 1.78
total heat delivered = 1386 kWh
Average target flow temp = 34.9°C
Average flow temp (for SH) = 34.6°C
Outside temp = 5.4°C
Power draw SH = 700W
Power draw DHW = 1.35kW

1 Like

@TrystanLea Dear TrystanLea, I’m very interested in your shared info about the heat pump. Recently I am doing a Home Energy Management System but lack of relevant dataset, could you please share the raw data with me, I really appreciate it!