Reboot Required Every 20 Days Or So To Restore Logging

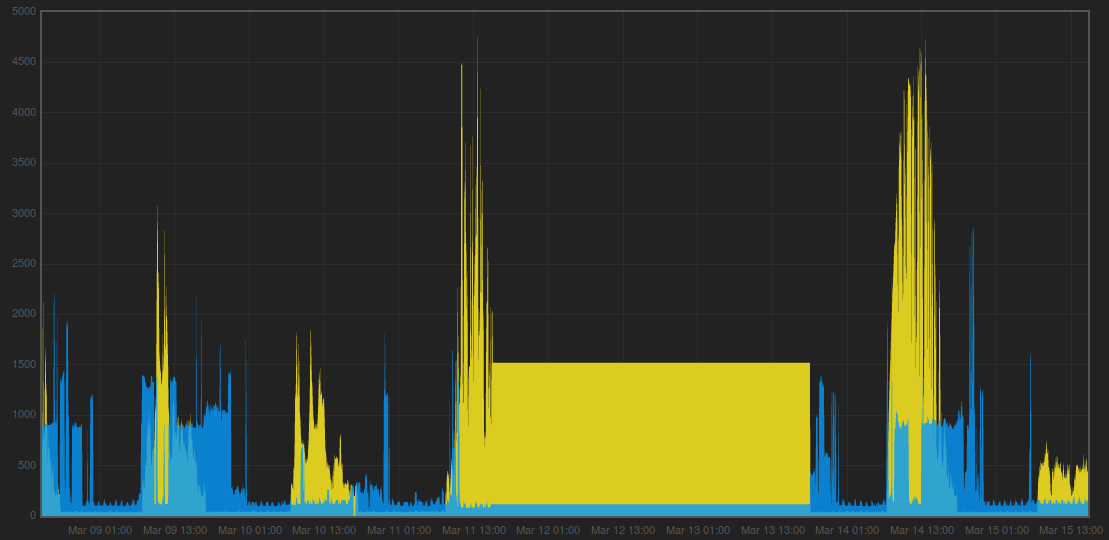
My factory built system goes pretty well but after 20 days or more it stops updating and just a reboot for the web interface restores normal operation.

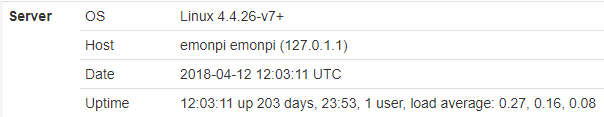
All the modules are up to date and I even ran the very long process to update to support wifi chn 13

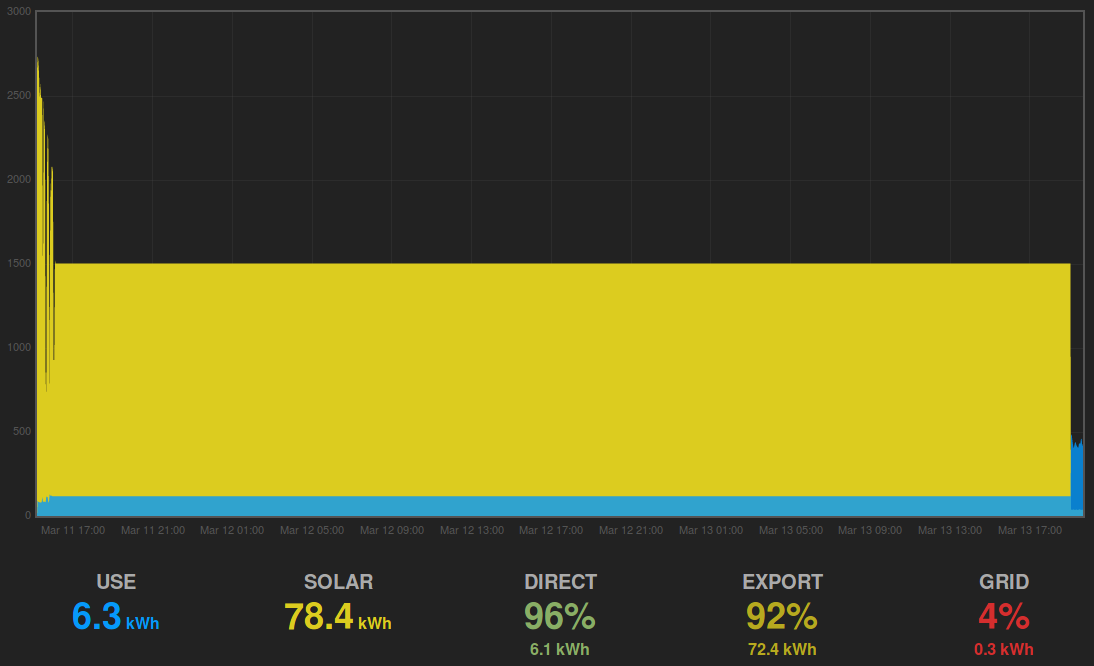
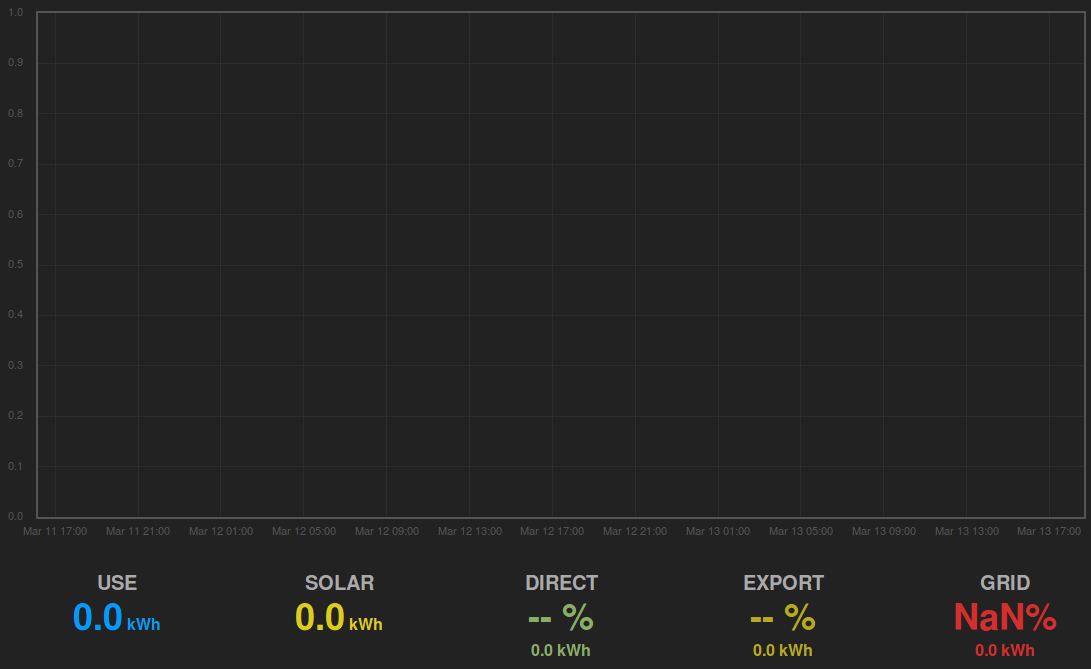
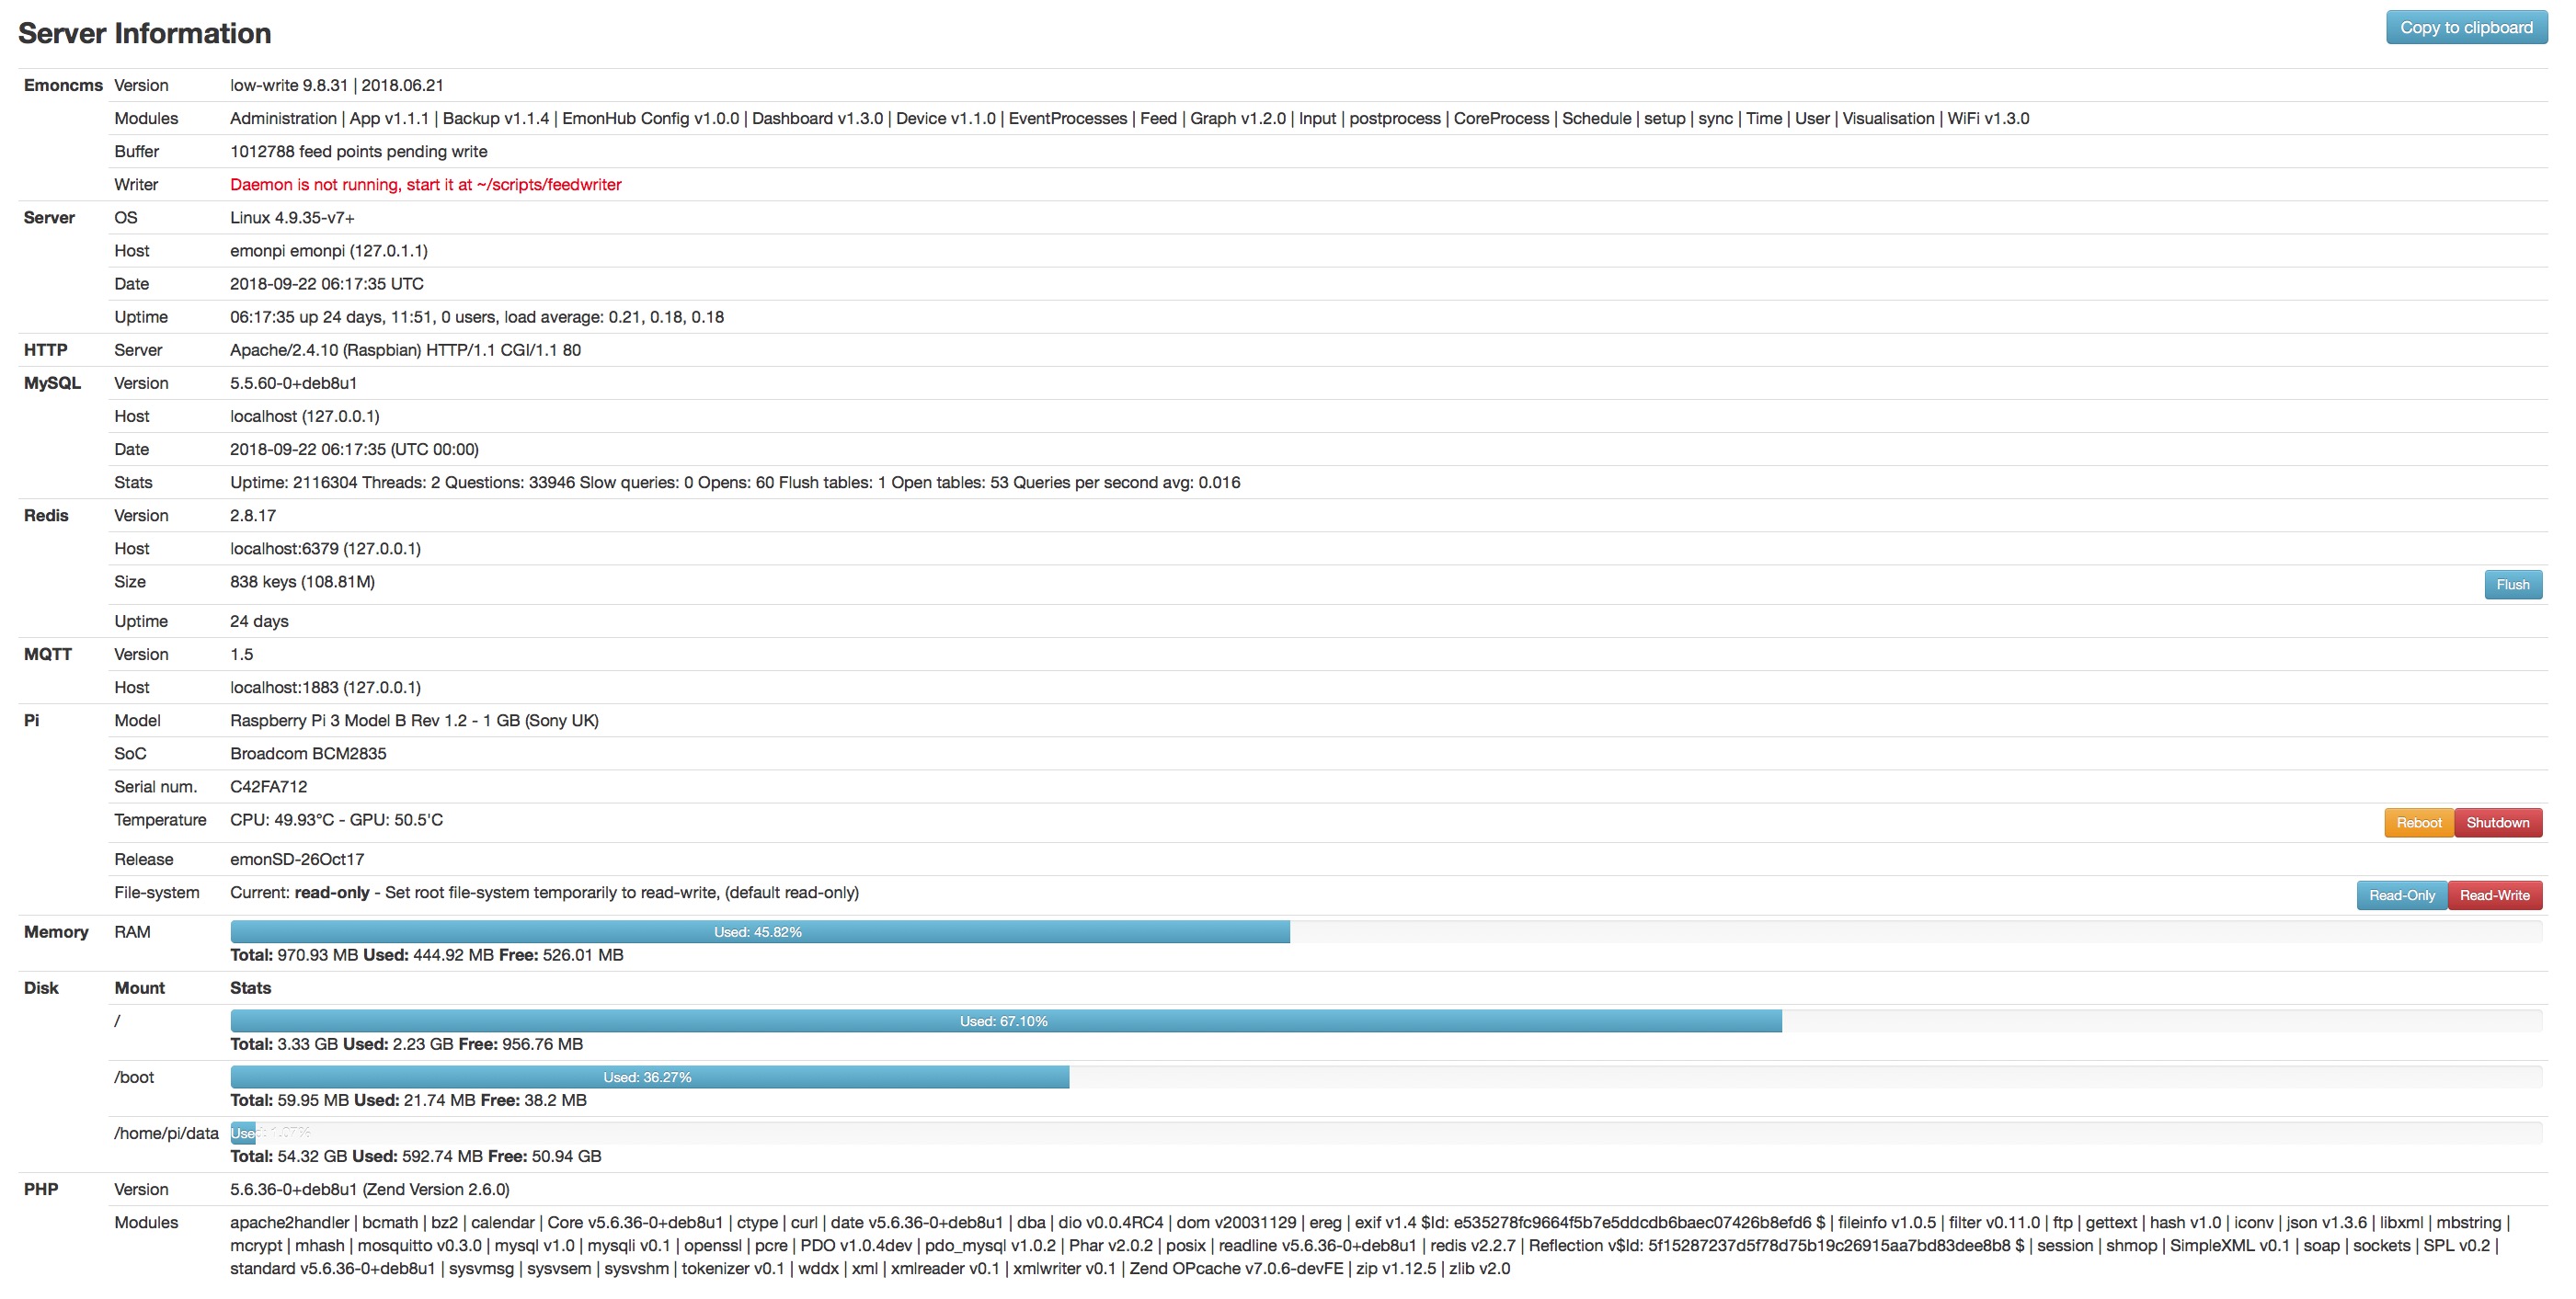
I have saved the logs but to start with this is the clipboard contents when it died and after a reboot.

No rush with a solution as it will be fine for another 20 days plus :slight_smile:

LAST ENTRIES ON THE LOG FILE
#0 /var/www/emoncms/scripts/phpmqtt_input.php(116): Mosquitto\Client->loop()
#1 {main}
2018-04-10 15:17:02.068|ERROR|phpmqtt_input.php|exception 'Mosquitto\Exception' in /var/www/emoncms/scripts/phpmqtt_input.php:116
Stack trace:
#0 /var/www/emoncms/scripts/phpmqtt_input.php(116): Mosquitto\Client->loop()
#1 {main}
2018-04-10 15:17:02.069|ERROR|phpmqtt_input.php|exception 'Mosquitto\Exception' in /var/www/emoncms/scripts/phpmqtt_input.php:116
Stack trace:
#0 /var/www/emoncms/scripts/phpmqtt_input.php(116): Mosquitto\Client->loop()
#1 {main}
2018-04-10 15:17:02.071|ERROR|phpmqtt_input.php|exception 'Mosquitto\Exception' in /var/www/emoncms/scripts/phpmqtt_input.php:116
Stack trace:
#0 /var/www/emoncms/scripts/phpmqtt_input.php(116): Mosquitto\Client->loop()
#1 {main}
2018-04-10 15:17:02.073|ERROR|phpmqtt_input.php|exception 'Mosquitto\Exception' in /var/www/emoncms/scripts/phpmqtt_input.php:116
Stack trace:
#0 /var/www/emoncms/scripts/phpmqtt_input.php(116): Mosquitto\Client->loop()
#1 {main}
2018-04-10 15:17:02.075|ERROR|phpmqtt_input.php|exception 'Mosquitto\Exception' in /var/www/emoncms/scripts/phpmqtt_input.php:116
Stack trace:
#0 /var/www/emoncms/scripts/phpmqtt_input.php(116): Mosquitto\Client->loop()
#1 {main}
2018-04-10 15:17:02.077|ERROR|phpmqtt_input.php|exception 'Mosquitto\Exception' in /var/www/emoncms/scripts/phpmqtt_input.php:116
Stack trace:
#0 /var/www/emoncms/scripts/phpmqtt_input.p

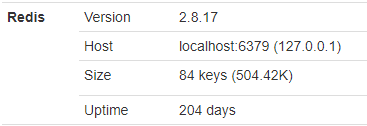
It also indicated “Daemon is not running, start it at ~/scripts/feedwriter” in red

After a reboot it says this but seems to always work

LAST ENTRIES ON THE LOG FILE
2018-04-10 20:20:03.666|ERROR|phpmqtt_input.php|exception 'Mosquitto\Exception' in /var/www/emoncms/scripts/phpmqtt_input.php:125
Stack trace:
#0 /var/www/emoncms/scripts/phpmqtt_input.php(125): Mosquitto\Client->connect('localhost', 1883, 5)
#1 {main}
2018-04-10 20:20:03.720|WARN|phpmqtt_input.php|Not connected, retrying connection
2018-04-10 20:20:11.283|ERROR|phpmqtt_input.php|exception 'Mosquitto\Exception' in /var/www/emoncms/scripts/phpmqtt_input.php:125
Stack trace:
#0 /var/www/emoncms/scripts/phpmqtt_input.php(125): Mosquitto\Client->connect('localhost', 1883, 5)
#1 {main}
2018-04-10 20:20:11.284|WARN|phpmqtt_input.php|Not connected, retrying connection
2018-04-10 20:20:17.001|WARN|phpmqtt_input.php|Not connected, retrying connection
2018-04-10 20:20:17.002|WARN|phpmqtt_input.php|Connecting to MQTT server: Connection Accepted.: code: 0
2018-04-10 20:20:24.288|WARN|phpmqtt_input.php|Not connected, retrying connection
2018-04-10 20:20:24.307|WARN|phpmqtt_input.php|Connecting to MQTT server: Connection Accepted.: code: 0

Thanks in advance for any ideas.

Hi Mike,

I have been having similar issues with the EmonCMS. I’ve been using it since end of 2017. I didn’t keep a detailed record of all “crashes”, but I’ve had them on:
2018-01-03
2018-01-18
2018-02-06
2018-02-14
2018-02-19
2018-03-11
2018-03-29
2018-04-11
Indeed, as you point out every 20 days or so.

If it crashes, the numbers on the app are completely wrong. Let me demonstrate with an example:


Unless you’re in some part of the universe where the sun shines constantly over a 48 hour period, the graph is clearly wrong.
The “funny” part is, when you zoom in, it actually gives different values depending on your zoom level.

Notice that the time scale in the image below is almost identical to the one in the image above. With a small difference: the image above includes the beginning and end of the crash. The one below doesn’t.

I would rather have it display zero or NaN if something goes wrong. Rather than interpolating and displaying faulty values. Apparently the way the app behaves. But that’s another topic.

Back on topic, I haven’t looked at the issue in depth. In stead of tracing the root cause, I took the rather blunt approach of rebooting the whole device. This is the script in its present form:

#!/bin/bash
LOGDIR=/home/pi/watchdog
TMPDIR=/tmp/watchdog/
timestamp=$(date +%Y%m%d-%H%M%S)
file=$TMPDIR/$timestamp

mkdir -p $TMPDIR

### write measurement into $file
wget -qO- http://127.0.0.1:8080/openhab.app > $file
value=$(cat $file | grep "Power 2" | sed -e 's/.*<span[^>]*>\([^<]*\)<.*$/\1/')
### test if it's Not A Number
echo $value | grep -E '[0-9]+ W'; bNan=$?

### check if last three measurements are exactly the same
bChange=0
recent=`ls -t $TMPDIR | head -n3`
count=$(echo "$recent" | wc -l)
if [ $count -lt 3 ]; then
	### not enough data, wait for at least 3 samples
	exit 0
fi
recent1=${TMPDIR}/`echo "$recent" | sed -n 1p` # most recent output
recent2=${TMPDIR}/`echo "$recent" | sed -n 2p`
recent3=${TMPDIR}/`echo "$recent" | sed -n 3p` # least recent output
diff $recent1 $recent2 >/dev/null; bChange=$(($bChange+$?))
diff $recent2 $recent3 >/dev/null; bChange=$(($bChange+$?))
echo $bChange #if no change at all, this value will be zero

### if needed take action
if [ $bChange -eq 0 ] || [ $bNan -eq 1 ] || [ "$value" == "0 W" ]; then
	echo "Detected anomaly, measured $value. Rebooting emonpi." | logger -it watchdog
	rpi-rw
	# make sure the LOGDIR exists
	mkdir -p $LOGDIR
	# make a backup of the system log because it gets deleted during reboot
	cp -prv /var/log/syslog $LOGDIR
	# save the process list
	ps -AHf > $LOGDIR/ps-$timestamp.txt
	rpi-ro
	sudo reboot
	exit 0
fi

# clean up oldest output file
if [ ! -z $recent3 ]; then
	rm $recent3
fi

I saved it as /home/pi/watchdog.sh, gave it +x rights and made a crontab for it.

pi@emonpi(ro):~$ rpi-rw 
Filesystem is unlocked - Write access
type ' rpi-ro ' to lock
pi@emonpi(rw):~$ chmod a+x ~/watchdog.sh 
pi@emonpi(rw):~$ ls -l watchdog.sh
-rwxr-xr-x 1 pi pi 1471 Apr 11 04:32 watchdog.sh
pi@emonpi(rw):~$ crontab -e
pi@emonpi(rw):~$ crontab -l | tail -n2
* * * * * /home/pi/emonpi/service-runner >> /var/log/service-runner.log 2>&1
*/1 * * * * /home/pi/watchdog.sh
pi@emonpi(rw):~$ rpi-ro
Filesystem is locked - Read Only access
type ' rpi-rw ' to unlock

The script basically checks the last three snapshots of measurements to see if a value (power, temperature, …) has changed. If nothing has changed, there’s something out of the ordinary and the script reboots the EmonPi board.

Hello @IM35461, are you using an emonpi or emonbase?

Did you update via the Setup > Administration > EmonPi/EmonBase update feature?

We did fix an issue a number of months ago that resulted in this behaviour, the two key items to update are emoncms core and also emonhub - but the full emonpi/emonbase update process would action these updates.

@TrystanLea - this isn’t the first instance of the phpmqtt_input.php script apparently causing issues over the last few months.

Part of the problem I have highlighted on a PR - it is because a subscribe is attempted when there is no server connection. There is also an issue that if the server reports an issus with the connection request, this is ignored.

This may not solve the issue, but may well help with diagnosing it.

Many thanks for the ideas.

The watchdog timer sounds interesting.

Re Did you update via the Setup > Administration > EmonPi/EmonBase update feature? I had but I can’t recall if I had done it since I applied the WiFi patch.

It mainly said up to date but did replace five files.

I have rebooted it again for a clean start.

Are these message normal for startup?

LAST ENTRIES ON THE LOG FILE
2018-04-11 19:53:11.026|ERROR|phpmqtt_input.php|exception 'Mosquitto\Exception' in /var/www/emoncms/scripts/phpmqtt_input.php:125
Stack trace:
#0 /var/www/emoncms/scripts/phpmqtt_input.php(125): Mosquitto\Client->connect('localhost', 1883, 5)
#1 {main}
2018-04-11 19:53:11.117|WARN|phpmqtt_input.php|Not connected, retrying connection
2018-04-11 19:53:17.009|WARN|phpmqtt_input.php|Not connected, retrying connection
2018-04-11 19:53:17.010|WARN|phpmqtt_input.php|Connecting to MQTT server: Connection Accepted.: code: 0
2018-04-11 19:53:25.565|WARN|phpmqtt_input.php|Not connected, retrying connection
2018-04-11 19:53:25.584|WARN|phpmqtt_input.php|Connecting to MQTT server: Connection Accepted.: code: 0

Time will tell if it behaves, if not I will try one of the fixes suggested.

Hi Bjorn, I have checked your previous posts and not found any previous report of these crashes or any requests for assistance to resolve them, if you choose to implement such a “blunt” workaround without any attempts to help resolve the issue, you must understand why you and now Mike have these problems.

We can only resolve issues when there is good information to locate and correct the cause.

Your list of dates shows 8 crashes over 98 days, that’s 8 missed opportunities to fix the issue, the “20 days” might be a useful piece of info if that’s the max time a system will run, but it might also be a red herring as your crashes average 12.25 days and have happened at 5 and 8 days, but sharing this info helps identify patterns and helps diagnose the issues. It is in fact far more useful than sharing a method of “sweeping it under the mat” so that many more users fall foul of the issue down the line.

I’m guessing you are not based in Barrow, Alaska, where the sun comes up in May and doesn’t set until August :slight_smile:

Jesting aside, “the graph is clearly wrong” is the key bit of info there, it is not believable therefore it is clearly a fault. If it was showing zero production for a couple of days, that is believable, Is the data correct? Has something tripped? Has the inverter packed up? Has a shadow been cast over a small part of each string? Or is it just very overcast?

The way the data is presented isn’t prefect, perhaps it could be improved, but showing zero as a fault indication when zero is a valid value doesn’t work, I’m all in favor of a positive fault indication, but as you say that’s another topic.

There’s nothing “funny” about that, the lines are simply drawn between datapoints, if the last datapoint for a 48hr period is 2000 and the first datapoint after that 48hr period is 1000, there will be a line that stretches from 2000 to 1000 over that 48hr period, had it gone offline at night (no pv) and come back on at night, it would indeed show zero for that period. The reason it changes when you zoom is because the data set has excluded the datapoints that the line previously started and ended at, you have a dataset full of “null” datapoints, there is nothing to draw a line from or to.

Its definitely NOT normal to have to constantly reboot the Pi.
My local install (an emonbase on an RPi 2B) is currently showing:
image
… and
image

204 days ago was probably when we lost power last…

1 Like

Absolutely, the perceived “need” to reboot should be sought out and remedied.

1 Like

Rebooting is quick and dirty. I know! :smiley:
The right thing to do is to tackle the root cause and fix it. It’s all a question of priority (c.q. time).

  1. update to the latest version (there is little point in filing bug reports on three versions ago)
  2. re-evaluate if the problem persist
    if it doesn’t => post it in the community
    if it does => proceed with the next steps
  3. sift through logs, gathering as many symptoms and pointers to the root cause
  4. either file a bug report or fix it yourself (and posting the bugfix in this forum)

As Trystan pointed out, the fix could be in the update. So, let’s first see what an update brings. I’m still on low-write 9.8.24 | 2017.11.27.

Hi Mike,

the logs you quote look like Apache logs. Though I’m not sure which specific log file you got them from.
I don’t have them in syslog>

pi@emonpi(rw):~$ grep WARN /var/log/syslog 
Apr 12 03:58:12 emonpi kernel: [    0.752229] WARN::dwc_otg_hcd_init:1032: FIQ DMA bounce buffers: virt = 0xbd904000 dma = 0xfd904000 len=9024
Apr 12 03:58:12 emonpi kernel: [    0.761497] WARN::hcd_init_fiq:459: FIQ on core 1 at 0x8058ef90
Apr 12 03:58:12 emonpi kernel: [    0.762842] WARN::hcd_init_fiq:460: FIQ ASM at 0x8058f300 length 36
Apr 12 03:58:12 emonpi kernel: [    0.764199] WARN::hcd_init_fiq:486: MPHI regs_base at 0xbe87a000

Nor in the Apache log

pi@emonpi(ro):~$ head -n10 /var/log/apache2/error.log
[Thu Apr 12 03:58:29.297445 2018] [mpm_prefork:notice] [pid 1638] AH00163: Apache/2.4.10 (Raspbian) configured – resuming normal operations
[Thu Apr 12 03:58:29.297665 2018] [core:notice] [pid 1638] AH00094: Command line: ‘/usr/sbin/apache2’
[Thu Apr 12 03:58:43.176439 2018] [mpm_prefork:notice] [pid 1638] AH00169: caught SIGTERM, shutting down
[Thu Apr 12 03:58:45.018413 2018] [mpm_prefork:notice] [pid 1947] AH00163: Apache/2.4.10 (Raspbian) configured – resuming normal operations
[Thu Apr 12 03:58:45.018649 2018] [core:notice] [pid 1947] AH00094: Command line: ‘/usr/sbin/apache2’
cat: /home/pi/data/emoncms-import.log: No such file or directory
cat: /home/pi/data/emoncms-export.log: No such file or directory
cat: /home/pi/data/emoncms-import.log: No such file or directory
cat: /home/pi/data/emoncms-export.log: No such file or directory
cat: /home/pi/data/emoncms-import.log: No such file or directory

@IM35461 Found the log file. You’re using the web interface, which shows /var/log/emoncms.log
I have these log entries too:

pi@emonpi(ro):~$ head -n10 /var/log/emoncms.log
2018-04-12 03:58:43.660|ERROR|phpmqtt_input.php|exception ‘Mosquitto\Exception’ with message ‘The client is not currently connected.’ in /var/www/emoncms/scripts/phpmqtt_input.php:112
Stack trace:
#0 /var/www/emoncms/scripts/phpmqtt_input.php(112): Mosquitto\Client->loop()
#1 {main}
2018-04-12 03:58:43.751|ERROR|phpmqtt_input.php|exception ‘Mosquitto\Exception’ in /var/www/emoncms/scripts/phpmqtt_input.php:121
Stack trace:
#0 /var/www/emoncms/scripts/phpmqtt_input.php(121): Mosquitto\Client->connect(‘localhost’, 1883, 5)
#1 {main}
2018-04-12 03:58:43.752|WARN|phpmqtt_input.php|Not connected, retrying connection
2018-04-12 03:58:44.755|ERROR|phpmqtt_input.php|exception ‘Mosquitto\Exception’ with message ‘The client is not currently connected.’ in /var/www/emoncms/scripts/phpmqtt_input.php:112

At night, with near constant electricity use, constant temperature, the watchdog is a bit nervous. So it interprets that as an anomaly and executes a reboot. That means that a number of restarts by the watchdog were false positives.

I’ve now adjusted the watchdog to do more logging and to not reboot. I’ve included

  • process list (output of ps -AHf)
  • a copy of the three most recent openhab outputs
  • a copy of /var/log/syslog
  • a copy of /var/log/emoncms.log

Any other logfiles that could contain useful pointers to the root cause?

The most useful log is emonhub.log.

You also need to log the status of the following services, emonhub, feedwriter and mqtt_input.

A “top” printout to show RAM usage by process and cpu usage might be useful too.

[edit - also if you must use a watchdog, you really should check emoncms directly rather than openhab. you are not checking to see it the data is updating, you are checking to see if the data is being shared with openhab. emoncms and emonhub might not be failing if you are checking openhab. Also using an emoncms feed api would allow you to check the time the feeds were last updated NOT the last time the value changed. very different things, a static value may never change even when it is successfully updated every 5secs.]

I’ve added

  • status of all services
  • top printout

You’re right about OpenHAB. Retrieving the data from EmonCMS will be much more reliable. @pb66 Good idea! Will make the watchdog less nervous at night :slight_smile:

The script pulling data from EmonCMS API is ready. It checks when the temperature, power1 and power2 feeds have been last updated. If any of these feeds have been update more than 5 minutes ago, it logs a bunch of data.

The waiting game has begun. I hope it crashes soon :wink:

1 Like

@IM35461 I’ve updated to low-write 9.8.28 | 2018.01.27 about a week ago and so far so good. Looks like the update fixed whatever the root cause was. Based on that experience, I’d recommend you install this update to fix the issue you’re having.

Just to let you know it has been working well till yesterday and failed at 70+ days.

Did a reboot and installed an update and now have a new problem. The feeds web page just gives the loading cogwheel but the other webpages and the Android app still work.
Tried cold boot but no better:(

Any ideas?

I’ve updated as you have suggested and after 21 days the feeds stop logging.
In the server information next to writter (in red) “Daemon is not running, start it at ~/scripts/feedwriter” (see attached)
How do I resolve this issue?

Have you restarted the feedwiriter?

sudo systemctl restart feedwriter

It won’t fix the root issue but it will either return a fault/error that might give you insight to why it stopped running or it will start and write all that buffered data to disk before it is lost through a reboot or power outage as you apparently have “1012788 feed points pending write” held in RAM.

No, I had not tried that, I’m afraid I’ve already rebooted the system so I’ll try that next time it happens (I assume it will do this again in approximately 21 days).
Any ideas what the root problem could be, which is causing these feed data to remain in the buffer and not write to disk?