Solar App graph and EmonCMS not updating in combination with high load

I noticed something strange this evening just after 22h00. After the sun went down.


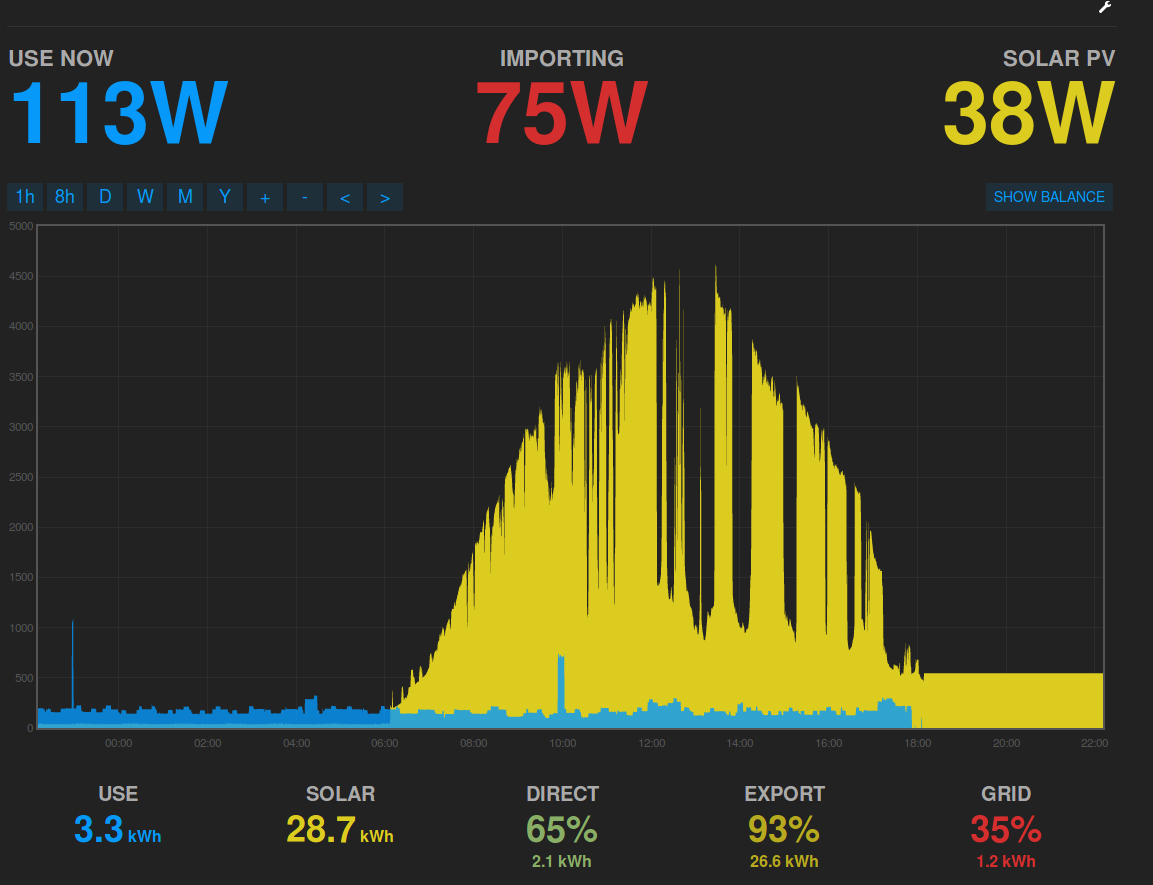
Solar output is 38W, which I believe is reasonably accurate. Ok, it should show 0W but hey, I can correct that number later on. Besides this thread is not about the (in)accuracy of that CT sensor.

As you can see, the graph Solar app graph shows 500W solar output!
The same goes for the usage in blue. 113W while the graph shows 0W.

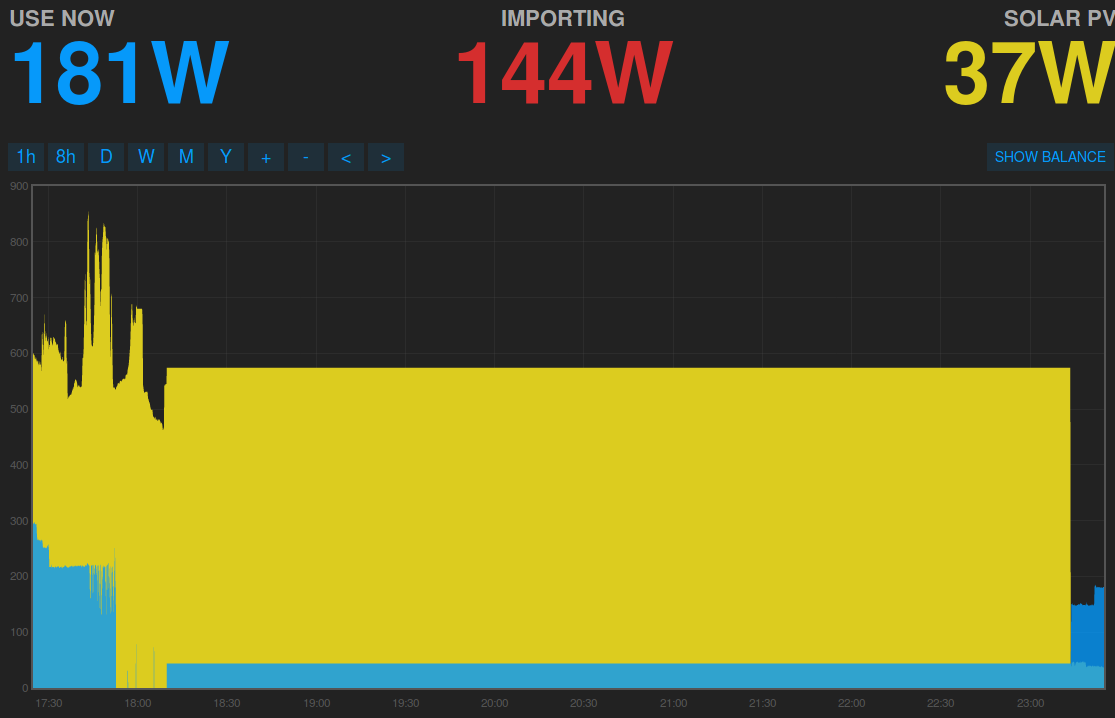
When I looked into the problem a bit further around 23h00. I took another screenshot.


Well, look at that 141W use, which is different from the 113W use and 38W solar.
I switched to the feed list and it showed that all the feeds are updating perfectly fine. :roll_eyes:

I did a quick and dirty fix since I wanted the measurements to be correct as soon as possible.

pi@emonpi(ro):~$ uptime
 21:11:22 up 51 days, 15:52,  1 user,  load average: 0.30, 0.14, 0.11
pi@emonpi(ro):~$ sudo reboot
Broadcast message from pi@emonpi on pts/0 (Sun 2018-06-03 21:13:00 UTC):

Yes I know, quite blunt. But I only did it after I checked that the watchdog I wrote some time ago (see Reboot Required Every 20 Days Or So To Restore Logging - #13 by pb66 and Collecting Local EmonCMS debug information) detected the anomaly and logged it’s stuff.

After the reboot around 23:13, the graph looks normal again. Well, since around 23:15 that is.

Troubleshoot information available

pi@emonpi(ro):~$ ls -l watchlog/20180603-162201+0000/
total 596
-rw-r--r-- 1 pi pi   18021 Jun  3 16:22 cmd-ps.txt
-rw-r--r-- 1 pi pi       0 Jun  3 16:22 cmd-service.txt
-rw-r--r-- 1 pi pi   14380 Jun  3 16:22 cmd-top.txt
-rw-r--r-- 1 pi pi     109 Jun  3 16:22 data.txt
-rw-rw-rw- 1 pi pi    7915 Jun  3 16:20 emoncms.log
-rw-r----- 1 pi adm 559827 Jun  3 16:22 syslog

Apparently the service --status-all did not log.

Top at that time shows a load of 66!!!

pi@emonpi(ro):~$ head -n10 watchlog/20180603-162201+0000/cmd-top.txt 
top - 16:22:02 up 51 days, 11:02,  0 users,  load average: 66.42, 49.84, 27.56
Tasks: 181 total,   3 running, 178 sleeping,   0 stopped,   0 zombie
%Cpu(s):  2.5 us,  0.9 sy,  0.0 ni, 96.4 id,  0.2 wa,  0.0 hi,  0.1 si,  0.0 st
KiB Mem:    994232 total,   416828 used,   577404 free,     9624 buffers
KiB Swap:        0 total,        0 used,        0 free.   142272 cached Mem

  PID USER      PR  NI    VIRT    RES    SHR S  %CPU %MEM     TIME+ COMMAND
  143 root      20   0   10232   3052   2788 S  13.9  0.3  27:26.86 systemd-jo+
 1961 www-data  20   0  115500  13444   8240 S  13.9  1.4  32:11.86 apache2
 7305 pi        20   0    6804   2384   2084 R  13.9  0.2   0:00.07 top

Will look into this further at a later time. Pointers welcome.

Looks like trouble started approx. 20 minutes before 16:22 (UTC+2).
Not sure yet what happened exactly.

Jun  3 16:03:24 emonpi kernel: [4445074.730571] EXT4-fs (mmcblk0p2): re-mounted. Opts: (null)
Jun  3 16:03:32 emonpi kernel: [4445082.811151] INFO: task kworker/3:0:12479 blocked for more than 120 seconds.
Jun  3 16:03:33 emonpi kernel: [4445082.811162]       Not tainted 4.9.35-v7+ #1014
Jun  3 16:03:33 emonpi kernel: [4445082.811167] "echo 0 > /proc/sys/kernel/hung_task_timeout_secs" disables this message.
Jun  3 16:03:33 emonpi kernel: [4445082.811173] kworker/3:0     D    0 12479      2 0x00000000
Jun  3 16:03:33 emonpi kernel: [4445082.811201] Workqueue: events_freezable mmc_rescan
Jun  3 16:03:33 emonpi kernel: [4445082.811233] [<807146b0>] (__schedule) from [<80714bd4>] (schedule+0x50/0xa8)
Jun  3 16:03:33 emonpi kernel: [4445082.811250] [<80714bd4>] (schedule) from [<805b6c5c>] (__mmc_claim_host+0xb8/0x1cc)
Jun  3 16:03:33 emonpi kernel: [4445082.811264] [<805b6c5c>] (__mmc_claim_host) from [<805b6da0>] (mmc_get_card+0x30/0x34)
Jun  3 16:03:33 emonpi kernel: [4445082.811280] [<805b6da0>] (mmc_get_card) from [<805bf830>] (mmc_sd_detect+0x2c/0x80)
Jun  3 16:03:33 emonpi kernel: [4445082.811295] [<805bf830>] (mmc_sd_detect) from [<805b9a64>] (mmc_rescan+0x1c8/0x38c)
Jun  3 16:03:33 emonpi kernel: [4445082.811314] [<805b9a64>] (mmc_rescan) from [<80136660>] (process_one_work+0x158/0x454)
Jun  3 16:03:33 emonpi kernel: [4445082.811333] [<80136660>] (process_one_work) from [<801369c0>] (worker_thread+0x64/0x568)
Jun  3 16:03:33 emonpi kernel: [4445082.811349] [<801369c0>] (worker_thread) from [<8013c8c8>] (kthread+0x10c/0x124)
Jun  3 16:03:33 emonpi kernel: [4445082.811365] [<8013c8c8>] (kthread) from [<80108148>] (ret_from_fork+0x14/0x2c)
Jun  3 16:03:49 emonpi systemd[1]: Reloading OpenBSD Secure Shell server.
Jun  3 16:03:49 emonpi systemd[1]: Reloaded OpenBSD Secure Shell server.

Similar messages follow after that.

pi@emonpi(rw):20180603-162201+0000$ grep 'blocked for more than' syslog 
Jun  3 16:03:32 emonpi kernel: [4445082.811151] INFO: task kworker/3:0:12479 blocked for more than 120 seconds.
Jun  3 16:11:44 emonpi kernel: [4445574.333714] INFO: task kworker/3:1:2656 blocked for more than 120 seconds.
Jun  3 16:13:47 emonpi kernel: [4445697.214387] INFO: task kworker/3:1:2656 blocked for more than 120 seconds.
Jun  3 16:15:50 emonpi kernel: [4445820.095014] INFO: task kworker/3:1:2656 blocked for more than 120 seconds.
Jun  3 16:17:53 emonpi kernel: [4445942.975704] INFO: task kworker/3:1:2656 blocked for more than 120 seconds.
Jun  3 16:20:06 emonpi kernel: [4446065.856272] INFO: task kworker/3:1:2656 blocked for more than 120 seconds.
Jun  3 16:21:58 emonpi kernel: [4446188.736928] INFO: task kworker/3:1:2656 blocked for more than 120 seconds.

Turns out the PIDs are kernel worker processes/threads.
The device that is being remounted is actually the root file system

pi@emonpi(ro):20180603-162201+0000$ mount | grep mmcblk0
/dev/mmcblk0p2 on / type ext4 (ro,noatime,nodiratime,errors=remount-ro,data=ordered)
/dev/mmcblk0p1 on /boot type vfat (rw,noatime,nodiratime,fmask=0022,dmask=0022,codepage=437,iocharset=ascii,shortname=mixed,errors=remount-ro)
/dev/mmcblk0p3 on /home/pi/data type ext2 (rw,noatime,nodiratime,block_validity,barrier,user_xattr,acl,errors=remount-ro)

So I suspect what happened has nothing do with EmonCMS itself, but with a glitch in the hardware. Most likely the SD card.

I’m not able to comment on what might be the issue here based on the info available. But if you check the logs the filesystem will be mounted (at least) every hour to persist the fake-hwclock (current time), plus any time you use rpi-rw or rpi-ro the file system will be re mounted, so that “EXT4-fs (mmcblk0p2): re-mounted. Opts: (null)” line is not necessarily a concern.

Looking at your watchdog file list, I do not see emonhub.log, as I said in your other thread, the 2 most useful pieces of info you can collect are emonhub.log and the status of the mqtt_input, emonhub and feedwriter services.

To me, that graph just looks like it the data stopped sending, but you show that the feeds page was still updating, although not as conclusive as if you had checked the inputs page, but that would perhaps suggest there was a delay or gap in the data sent.