Here’s some more detail of the recent improvements to My Heatpump app, which is what provides the charts for heatpumpmonitor.org (as well as self monitoring):
There’s a share button in the top-right corner which is a link to the current view, either a section of the daily barchart or the real-time power charts
links with just &mode=power param will open app directly to last 24 hours on power chart
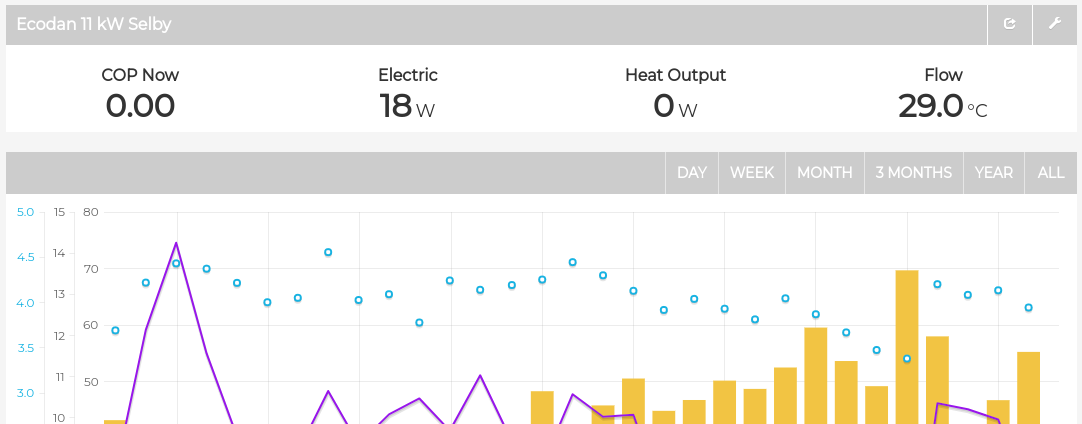
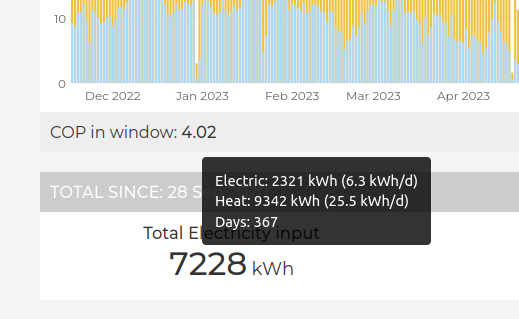
Calculation of “COP 30mins” on current stats has been fixed
click on COP to toggle to “COP Now”, and vice versa.
Daily barchart navigation has addition of “Day”, “3 Months” and “Year”
“Day” shows the last 24 hours on power chart; easier than clicking on the last bar.
Daily COP is now shown on the barchart, as blue points
Hi @Timbones
Loving the updates.
Just a couple of minor suggestions
Could the second y-axis be coloured purple to match the outside air temp? Thinking about this I guess not because it also matches indoor air for those that have it. So,
Could there be a legend and/or labels? When I have shared snapshots outside this forum one of the first questions is “what’s going on?”, it also took me a few mins to work out when I first stumbled here. It takes up screen space but I think it would be worth it.
automatic update and scrolling of power graph, to show live data extended shared URLs to include flow, cop and carnot settings added heatpump_targetT feed for showing target room or flow temperature
Bug Fixes
Ignore data from the future when calculating DHW and heating kWh Use average when fetching DHW and CH feeds to avoid aliasing Match axis colour for outside temp on daily barchart
Hot Tip
bookmark your own app and append &mode=power&hours=6 for a live dashboard of your system that always shows the last 6 hours. Adjust as desired. Can also add &cop=1 and &flow=1.
Available now at emoncms.org or pull the latest App module for self-hosted instances.
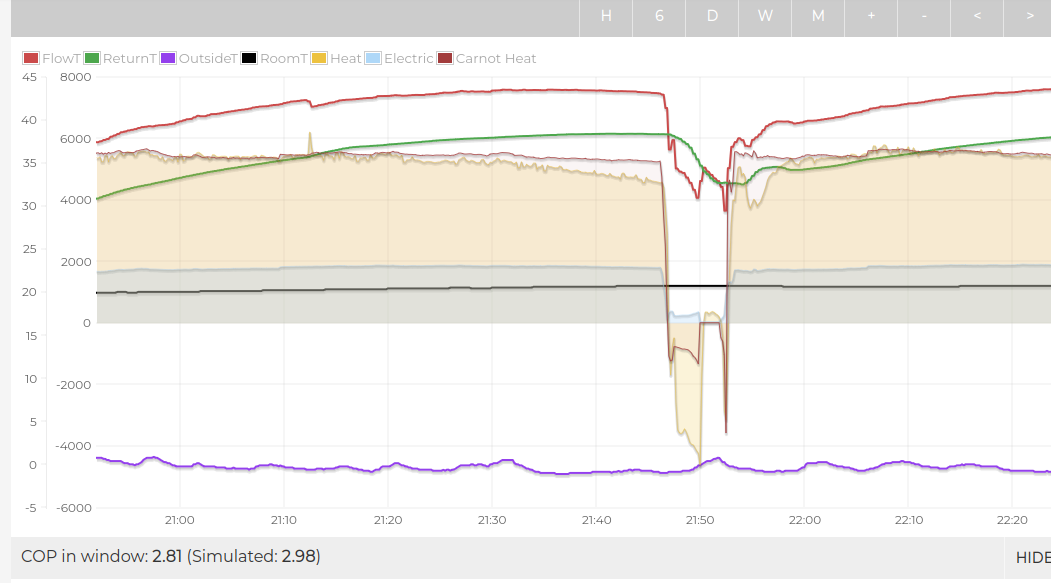
With all the chat about defosts, I wanted to have an easier way to get at the quantity of heat lost to defrosts and also have the option to show the defrost heat below the zero line. Now available in the app
Interestingly, my integration (heat meter via Melcloud) doesn’t record any negative heat, but if I plot Carnot heat I can maybe see what it would have been?
The carnot heat doesn’t really work for defrosts unfortunately, it really needs to infer flow rate from previous period and then carry that through the defrost to calculate negative heat at that point rather than use carnot:
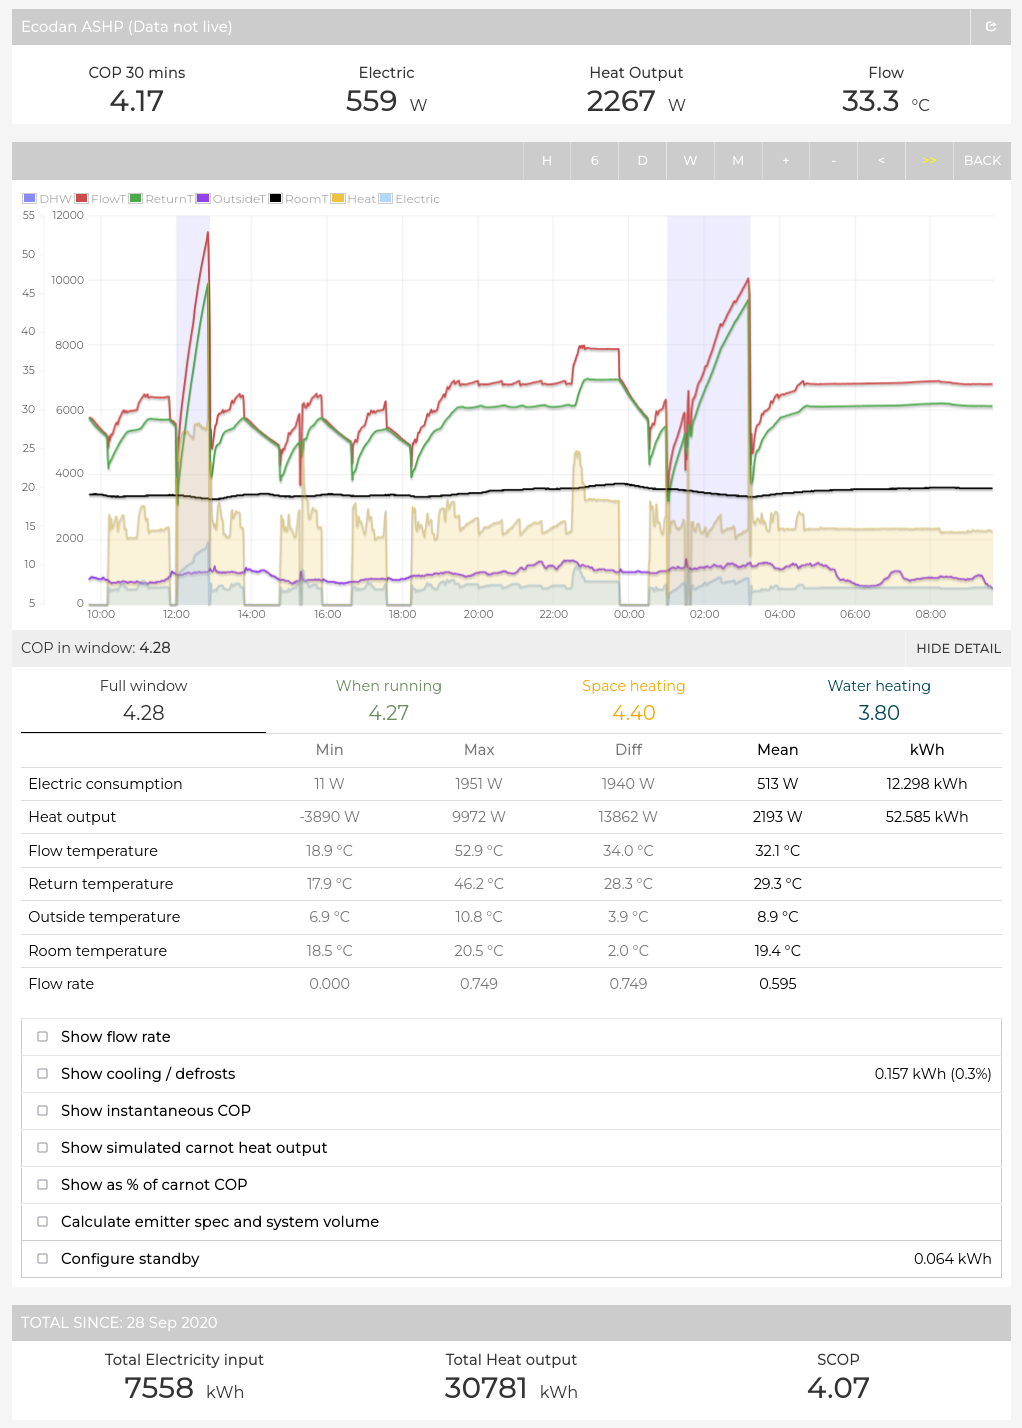
Happy to announce another set of updates to the MyHeatpump app New features:
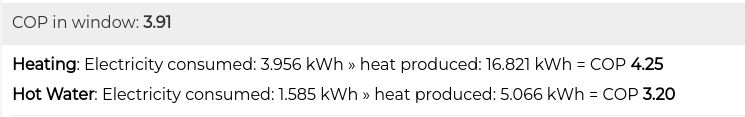
COP for different modes displayed as a horizontal set of columns in the Detail section.
Clicking on each COP heading shows detailed stats for each mode (heatpump_dhw flag required to enable the space heating and water heating columns). The full detailed stats is now available for each mode, these were only available for full window and when running before. Units and sensible rounding of figures also included.
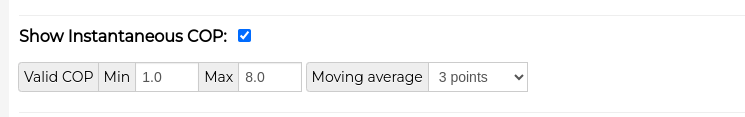
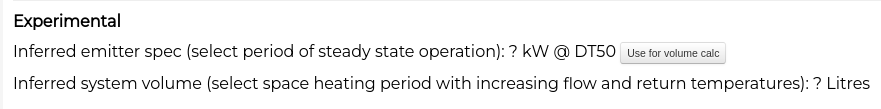
Additional features such an options to show things like flow rate are now accessible from a tidier list of options. These expand to show settings when applicable.
This update includes a significant refactor to the underlying code to improve responsiveness, including requesting data from the server in less api calls and in a more efficient way. Changing settings, toggling on/off options such as flow rate does not reload all of the data from the server each time.
Missing data is also treated differently, if there is more than a 15 minute gap the data for the feed is treated as missing from the calculation perspective and more visible in the graph as missing data. This has flagged up a couple of other issues I still need to work through, so I will be pushing up a couple more updates soon.
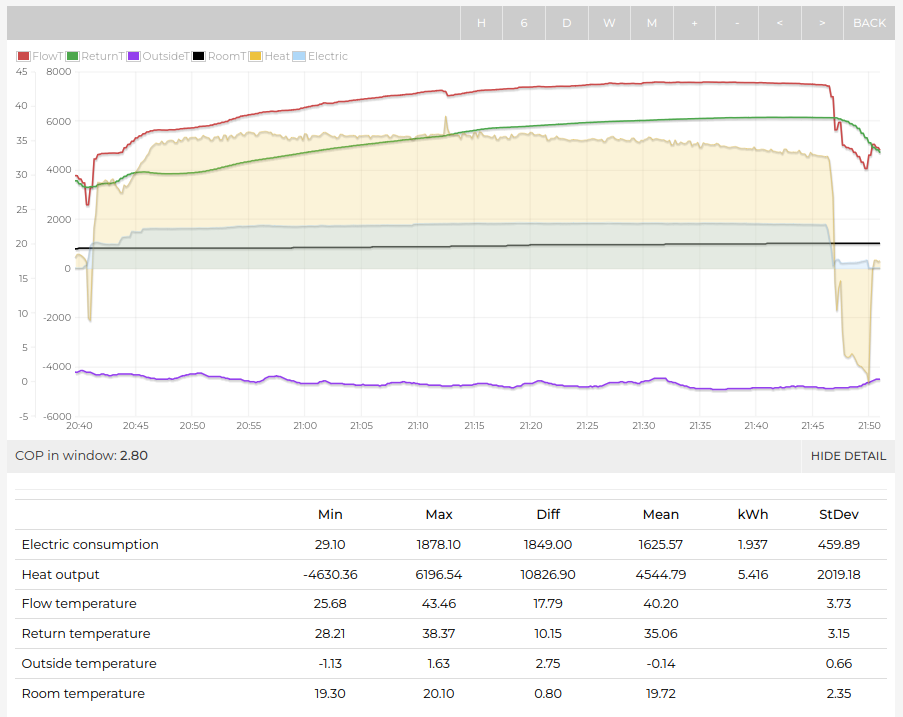
Here’s a screenshot of the new power graph detail section:
This update required both Emoncms Core and the App module to be updated as there are some dependency changes in the main emoncms repository. Emoncms.org has been updated.
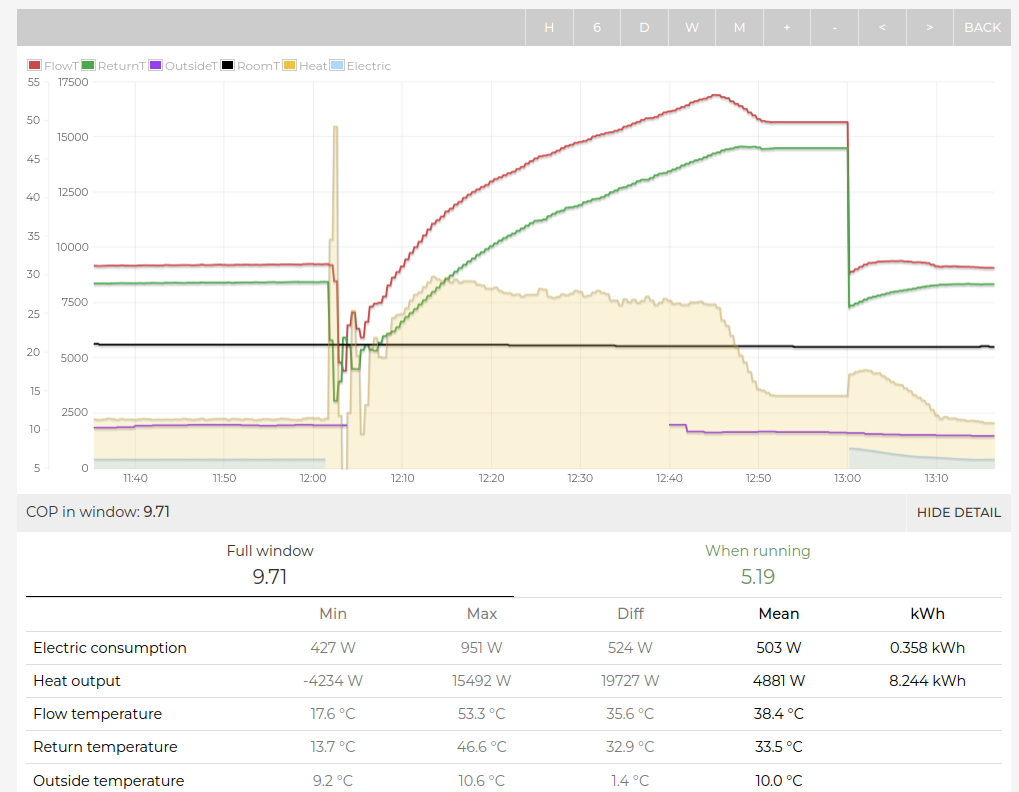
What’s the best way to deal with this missing data issue, we’ve got heat data but for some reason the electric data is missing for quite an extended period. COP value is therefore incorrect. Should it check for both heat and electric data for each interval, and not list total heat kWh here as 8.244 kWh? or should it just base the COP calculation on the heat data where electric data was available but leave the heat total in the stats view the same? Or should we hide the heat data completely… though that might suggest to a user that both feeds have a data issue which is less helpful?
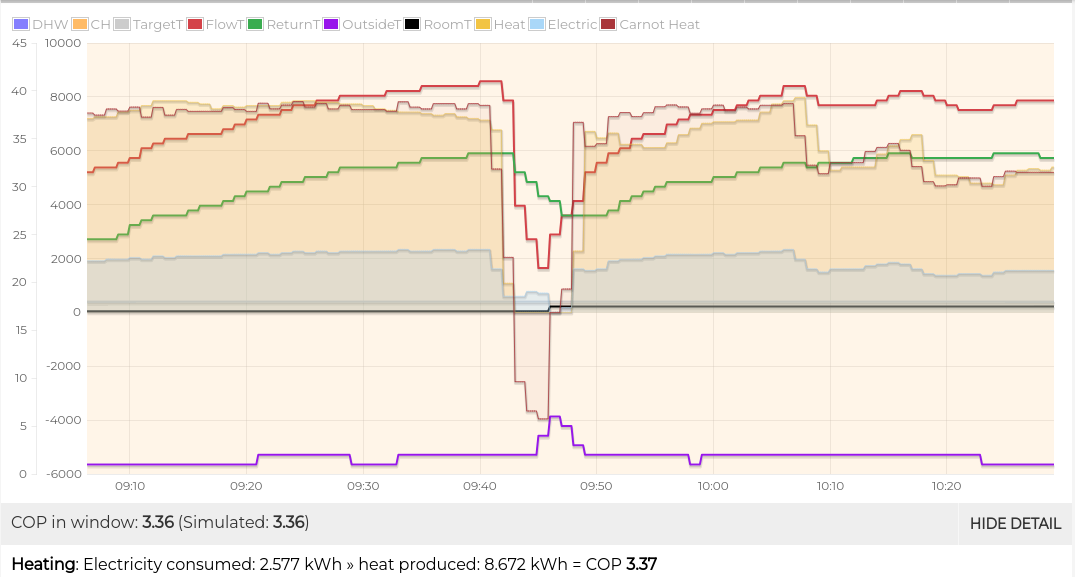
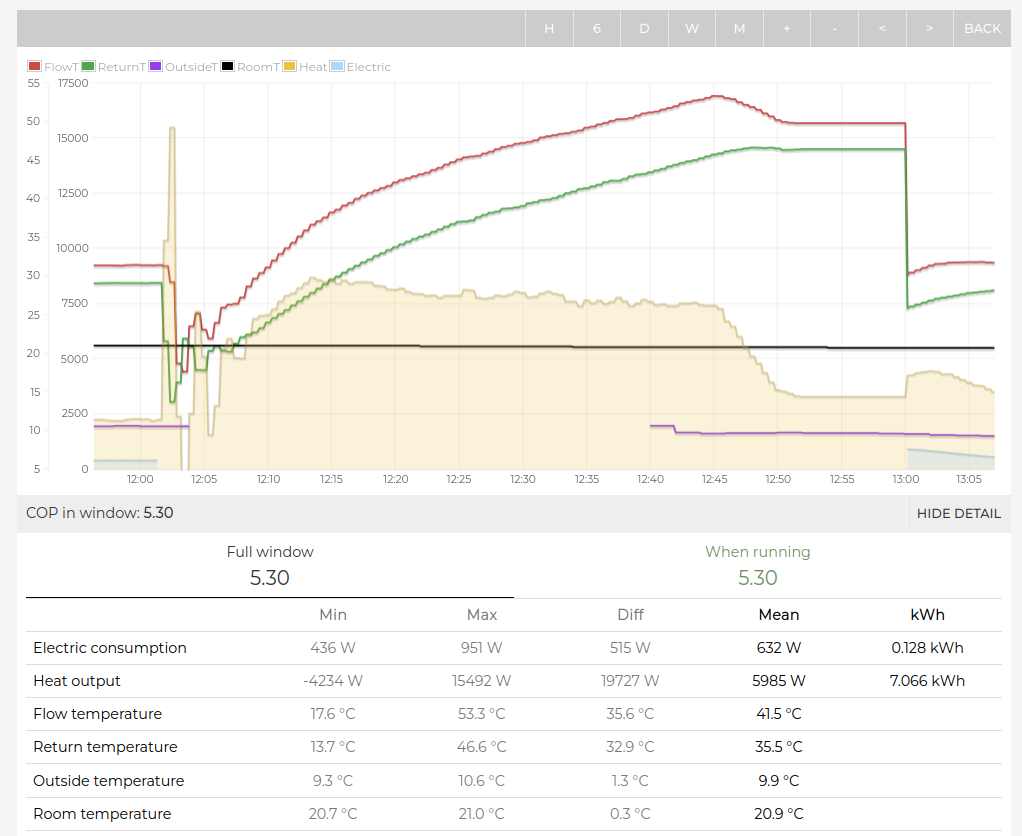
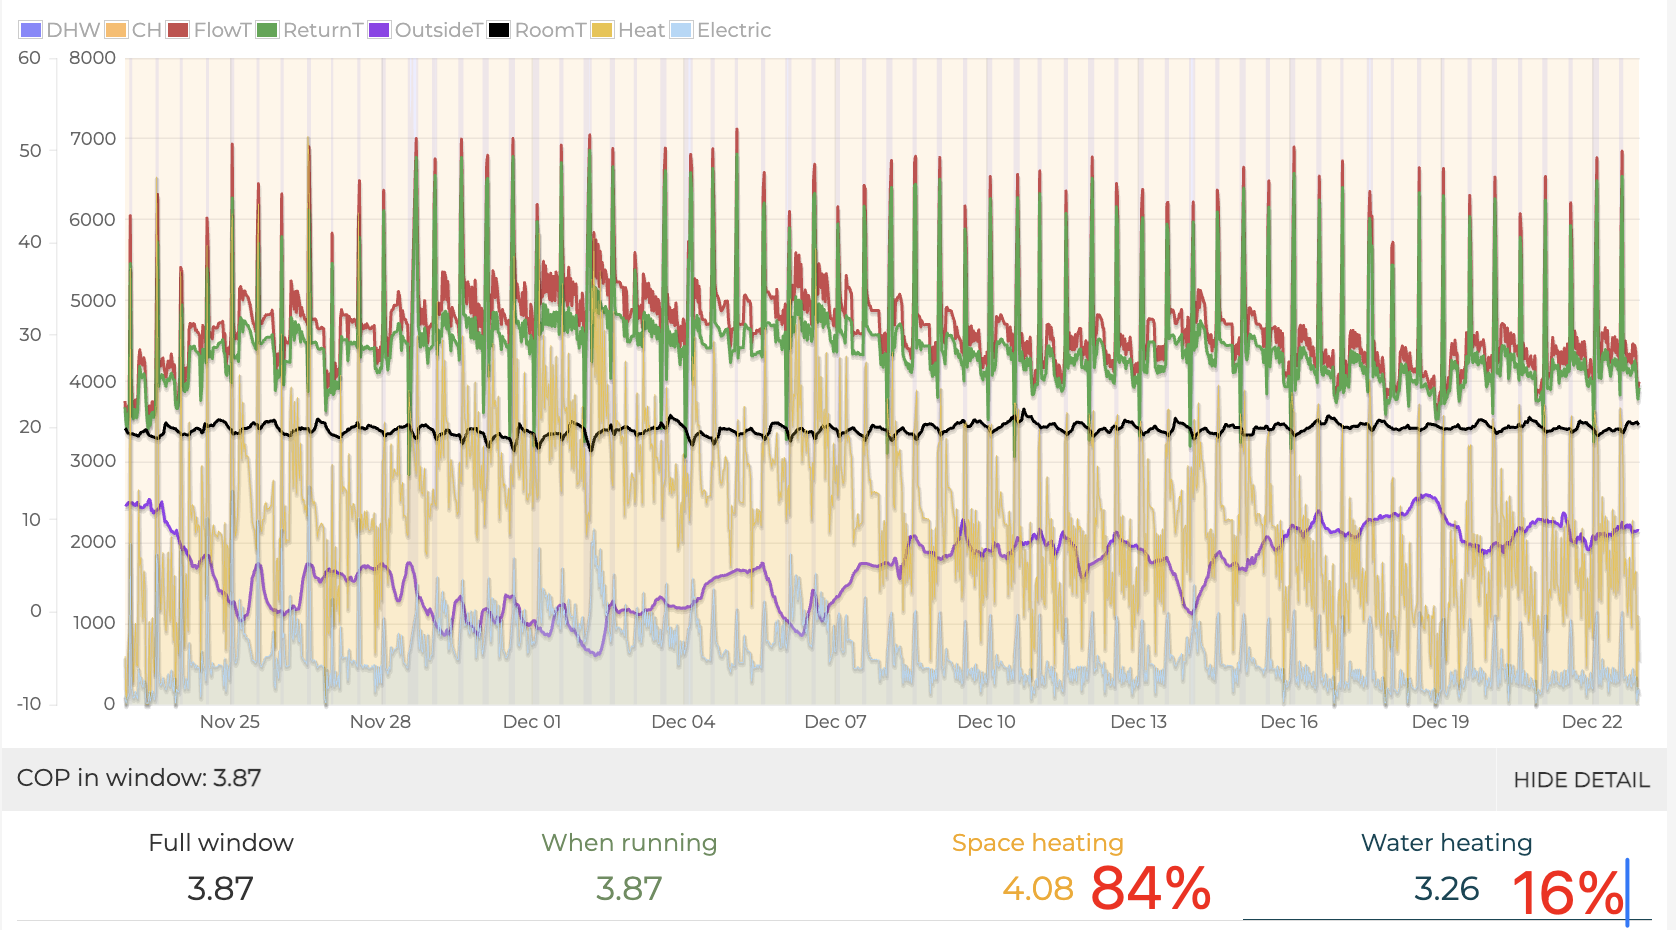
I’ve fixed the issue above where missing electric or heat data can provide incorrect COP values. COP values are now calculated independently of the general feed stats when looking at the detailed power view. They are only based on periods where both electric and heat data is present.
E.g this COP in window is correct for the brief period either side with electric data present. The heat data in the middle with no electric data is not taken into account in the COP calculation