Separate DHW and Space heat monitoring

So the big challenge is how do we create a solution for folks with standard heat meter setups?

For example those with a standard Vaillant Arotherm setup and a cylinder based coil? :man_shrugging:

4 Likes

@lukso was able to implement separate energy feeds with hardware:

I suggest that we separate it into two problems: {h/t @dMb}

  1. how to detect dwh vs. space heating - this is the bit that will vary a lot between installations, and depends what pumps and valves are in place. Maybe the lads at OEM had provide an easy to install kit?

  2. how to report energy usage separately for dwh vs. space - ideal solution is for My Heatpump app to take a single additional feed that indicates DHW or not, and works out the three sets of stats based on that, without needing to create more input processes or feeds.
    (Maybe this’ll only work for the zoomed in view (W), and not the (kWh) bar charts)

IMHO, this’ll make it much easier to provide a standard solution that will work for most heat pump owners.

7 Likes

I wonder if it’d be possible to write code to do the detection piece purely in software, and therefore run it within the MyHeatpump app, needing no new hardware. A hot water reheat has certain characteristics : FlowT rises steadily and constantly, reaching a value significantly higher than the “typical” value for that system in space heating mode.

this would be my idea , in psuedo maths:

  • compute the mean flowT when the system is running (ignore non-running temps) and stdev
  • scan the data set for flow temps greater than N stdev higher than the mean (N TBD)
  • starting from those outlier temps fwd’s and backwards in time look for a block of monotomically increasing flow temps of a reasonable (TBD) duration . Where the flowT increase starts and stops, define those times as the begin and end of the HW reheat run.

It ought be possible for a competent coder (I am not!) to write code to look for data matching that, and therefore classify a block of the data from TimeX to TimeY as being “DHW mode”.
as a debug, the matched times to be logged so the user can confirm or deny.

reporting - I agree. I’d like to see a filter on the app , and also on the heatpumpmonitor.org dashboard , to allow the datasets to be viewed as DHW/ CH/ Both. May not work for all datasets as you say.

I run monitor the DHW and CH as seperate apps. Only a combined (DHW and CH) one is published publically.

All my data is sent to a local emon installation (on ubuntu) via MQTT from loxone. The loxone controls the heating valves and gathers the meter data/kamstrup values and publishes it.

So, it is quite easy to split the data by CH and DHW.

I must say, I have never quite got my head around the emon feeds. And I never did get the heatpump hardware working. Sorry.

Announcement: My Heatpump app will now accept two extra feeds:

  • heatpump_dhw is used to separate out the power data when heating the hot water cylinder, and highlight those cycles on the power graph. Additional UI elements will appear, as detailed below.
  • heatpump_ch is used to highlight heating cycles (optional: is not required to compute stats)

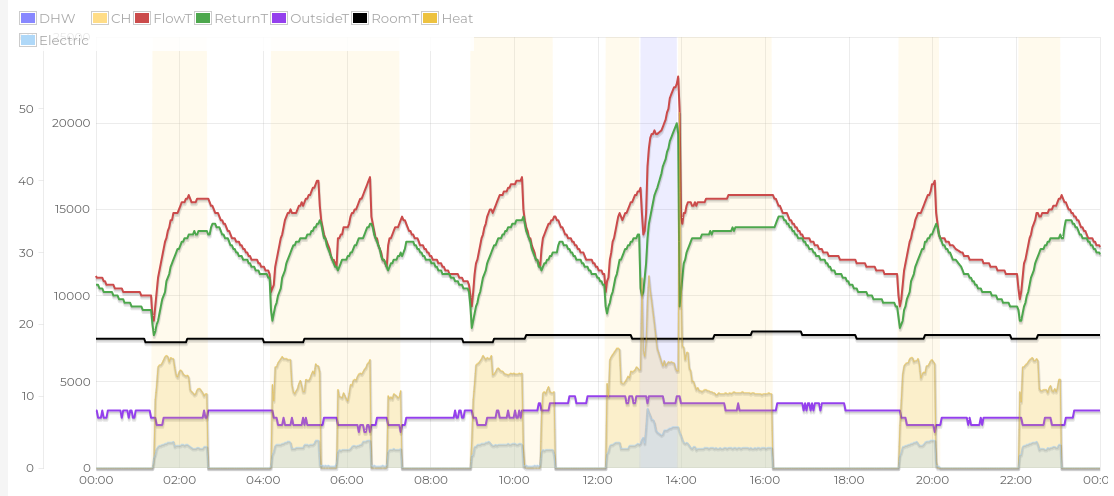
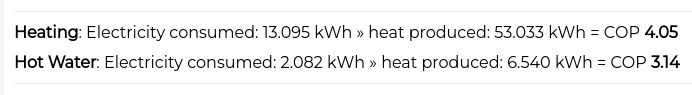
Stats for heating and hot water will be shown beneath the chart (excluding standby consumption):

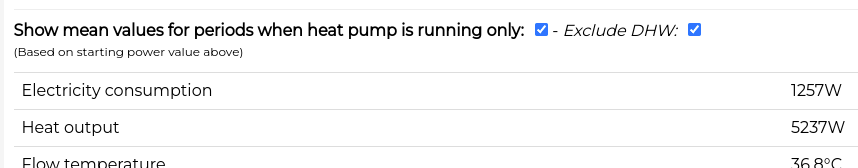
There is also the option the exclude DHW data from the “when running” stats:

Please give it a try and feedback your thoughts on it.

(self-hosted installs will need update the Modules/app component)

5 Likes

This is really nice @Timbones, thanks for contributing this!

1 Like

Amazing.

I just need to work out how to get this onto my energystats remote emoncms version.

Local emonHP > energystats emoncms account (and heatpump app)

Local emonHP / emontTX / emonPi > personal emoncms personal (and heatpump app)

I do all the separating of inputs/feeds etc on my personal emoncms as that is where I have all the CT clamp data.

But I don’t have that data on my emonHP as it’s standalone.

Could the breakdown be moved directly under COP in Window?

When I copy/paste the graph into twitter etc, it would be awesome to have that directly underneath.

So I could include it in the copy/paste without needing to include all the details from the other fields, if that makes sense?

1 Like

Little bug here:

Looks like the legend wraps around and you lose the top left of the graph?

Yeah, I had considered that but wasn’t sure. Screenshots is a good justification. :+1:

1 Like

Hi Tim,

Can I do this?

Do I need anything more than I have?

Excellent thanks @Timbones
Are heatpump_dhw and _ch the watts separated out or a flag to indicate when in heating or ch mode?
I have a melcloud feed that includes the mode (think 1 is DHW and 2 is CH) is there a way of can use this?

They’re zero vs. non-zero to indicate when they are on.

You can set up a virtual feed like this to provide the appropriate signal when DHW is on:

image

Personally I find it easier to use WaterPump2Status (heating) and WaterPump4Status (dhw), although cylinders with coils don’t have that 4th pump.

2 Likes

Thanks, no I only have one pump so can’t use that.
Maybe there could be a feed as well for defrost cycles?

Like this? Appears when you click “Show detail”.

“Show flow rate” moved below the stats table.

That would be lovely!!

Ok I think I must be just being a bit slow… where do I get a ‘If =, skip next’. I don’t see any logical operators in the list of available processes.

Ah - the public instance of emoncms might not have that those operators for virtual feeds.
Does the input process steps have logical operators?

It is possible to do the same thing with arithmetic operators too: (untested)

Heating:

  1. Add -2
  2. Allow negative
  3. Add 1
  4. Allow positive

Hot Water;

  1. Add -1
  2. Allow negative
  3. Add 1

How are you getting the data out of melcloud? Can you do any preprocessing before posting it to emoncms, creating some extra inputs?

Looks like I have the same options of inputs.
Maybe it would be easier to add to my pymelcloud script as another Emoncms input.

2 Likes