I’m still the odd funny Tim.
I’ve force refresh and incognito window, so hopefully i’m not caching anything.
I’m still the odd funny Tim.
I’ve force refresh and incognito window, so hopefully i’m not caching anything.
Yeah, I had spotted that and was working on a fix. Try again now…
Yep. Looks good now, thanks Tim.
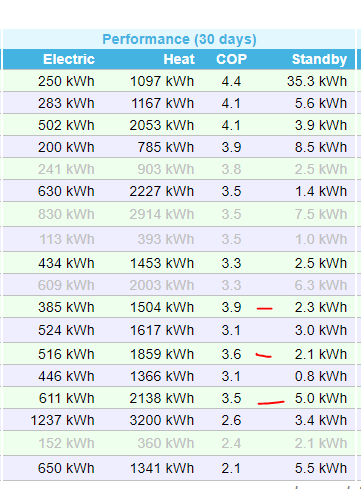
I’m finding the 30 day chart really interesting reading.
Lower the Flow temp, higher the COP. Who’d have thought it. ![]()
And you could also infer from that, by choosing a slightly higher internal room temp, you raise your required Flow and you drop your COP.
I look at Glyn and Trystan above me with their flow 2C and 5C below mine. (35C vs 33C vs 30C)
If I dropped my room temp down from 20.5 to 19.5, that would save me 5C on my flow.
Which would probably get me much closer to their COP.
But these are comfort decisions. We like the target 20.5, so ![]()
If I made the wife and kids sit with 2 jumpers and targeted 16C internal i’d be Top of the Scops!! ![]()
A good point our internal temp are usually between 19 and 19.5C in the evenings. Glyn’s are more like 20-20.5C in the evenings… Somehow Glyn’s house gets a degree warmer even though he is an end terrace, whilst we are a mid terrace… both of us have similar construction, though Glyn did get better air tightness results than us…
The latest stats page is looking great @Timbones! certainly feels like it gives some clarity as to the COP differences!
Absolutely. It’s a superb resource for that - and also for each of us giving a bit more scrutiny to our own systems. It helped me spot my system was periodically bringing in a resistive heater to help the compressor when it didn’t need to. (Totally self-inflicted by me ‘blocking’ the compressor from running 5pm - 7pm for the Octopus EQUINOX trial and the heat pump thought it needed to ‘catch up quickly’ at 7pm; I told it I could afford to wait a bit longer for heat…)
Not that I can establish. The circulation pump does switch off in warmer weather and there’s a configuration setting which controls the threshold for “don’t even bother thinking about heating if it’s warmer than this outside” which I think is what it’s responding to - but I don’t fancy setting that low enough to make the circulation pump go off in February… ![]()
The circulation pump can’t be too bad to be honest. The controller board seems to take a fair bit of the standby power since it never drops much lower even when the pump is off.
Is there a limit to that?
But it is probably cooling the fluid it is circulating.
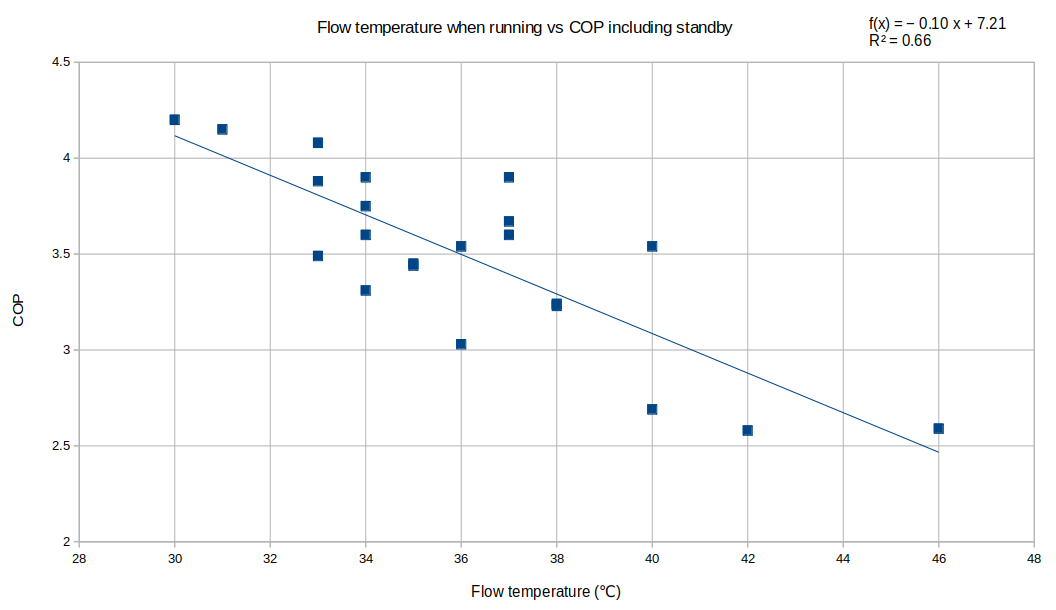
Preparing a few slides for Thursday’s EcoHomeLab. Here are a few comparison plots of the systems listed on the stats page so far:
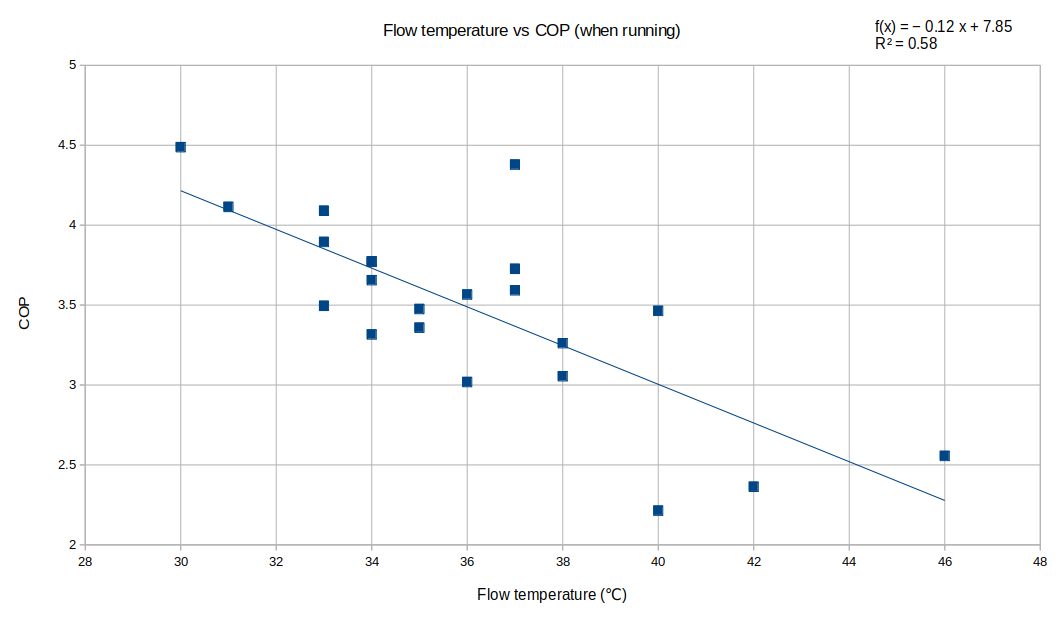
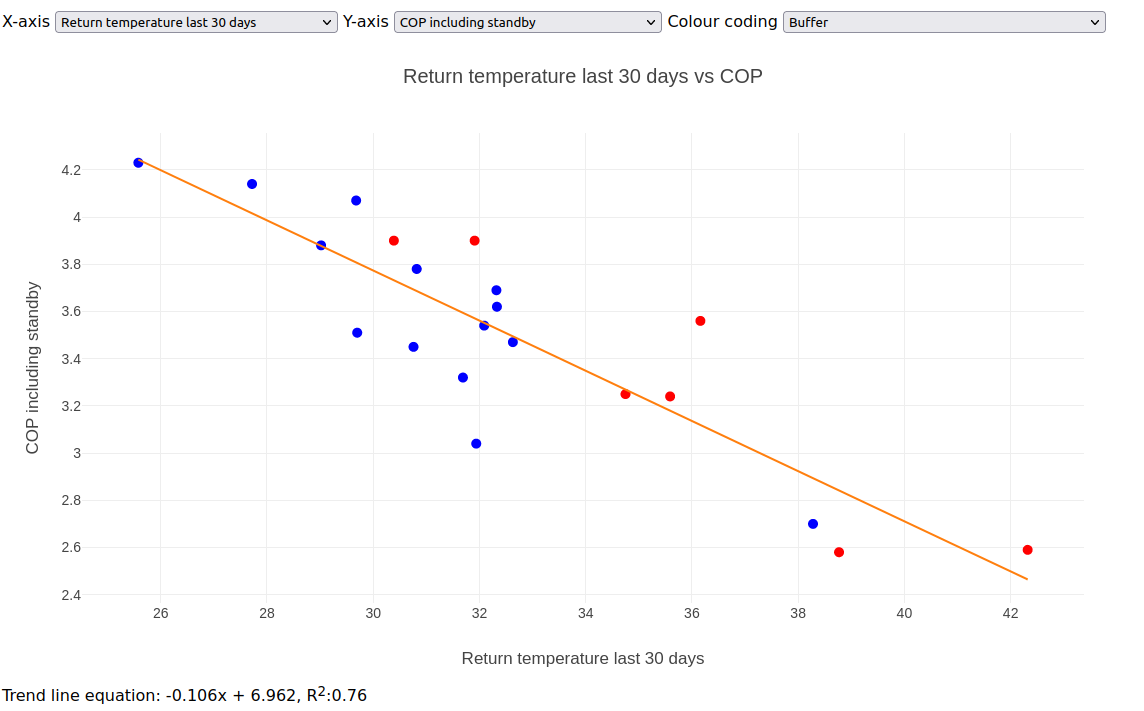
The flow temperature vs COP trend is starting to show up nicely:
Perhaps surprisingly a slightly lower correlation if the COP does not include standby, but not really enough datapoints to go on yet…
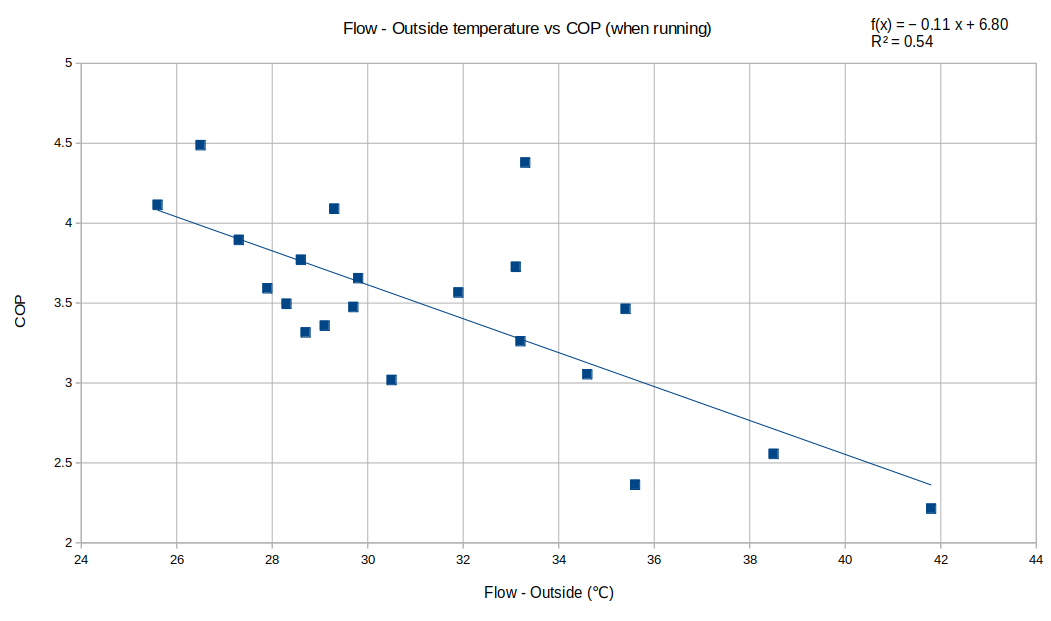
Lower correlation still for flow-outside which is somewhat surprising but probably not enough data points again…
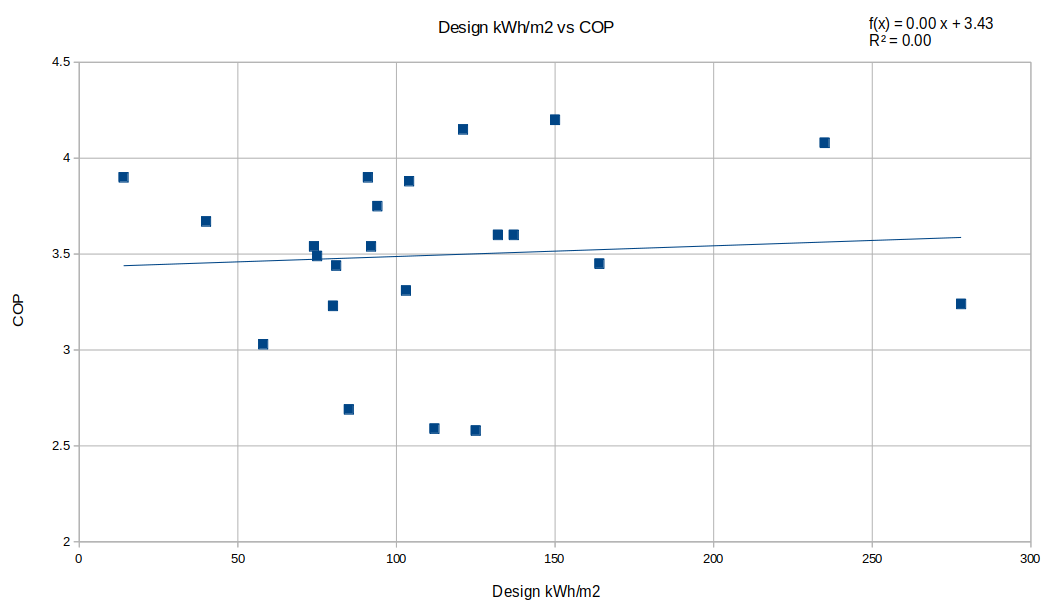
No real discernable trend yet between calculated fabric efficiency and COP:
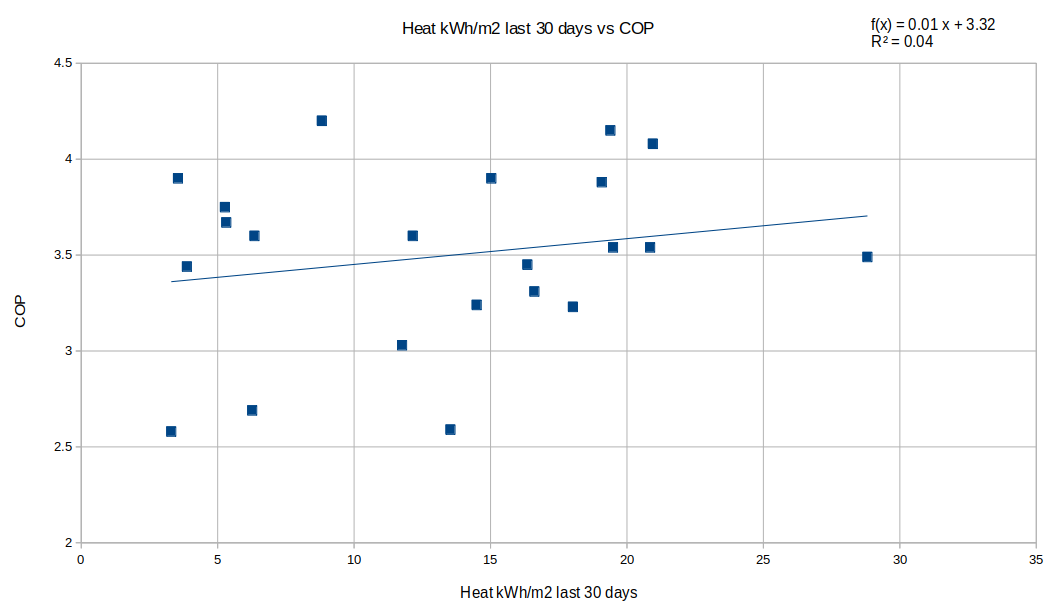
Neither is there a strong trend in measured heat output per m2 over the last 30 days and COP:
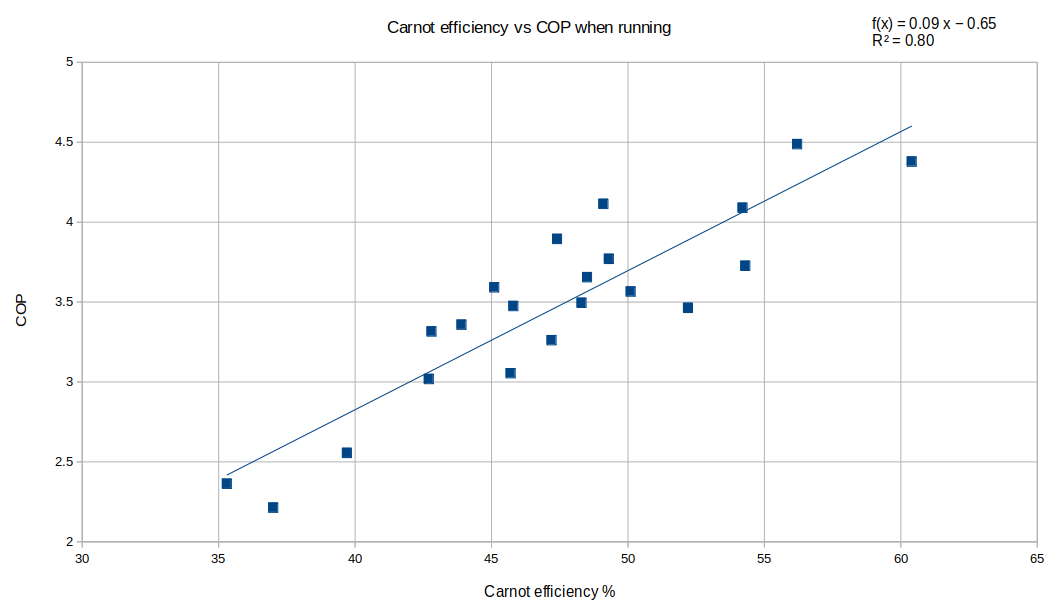
The carnot efficiency vs COP does seem to show a strong correlation.
T_condensing = T_flow + 4K
T_refrigerant = T_ambient - 6K
Carnot_COP = (T_condensing + 273) / ((T_condensing+273) – (T_evaporating + 273))
Carnot efficiency = COP / Carnot_COP
Nothing too surprising yet I guess!?
![]()
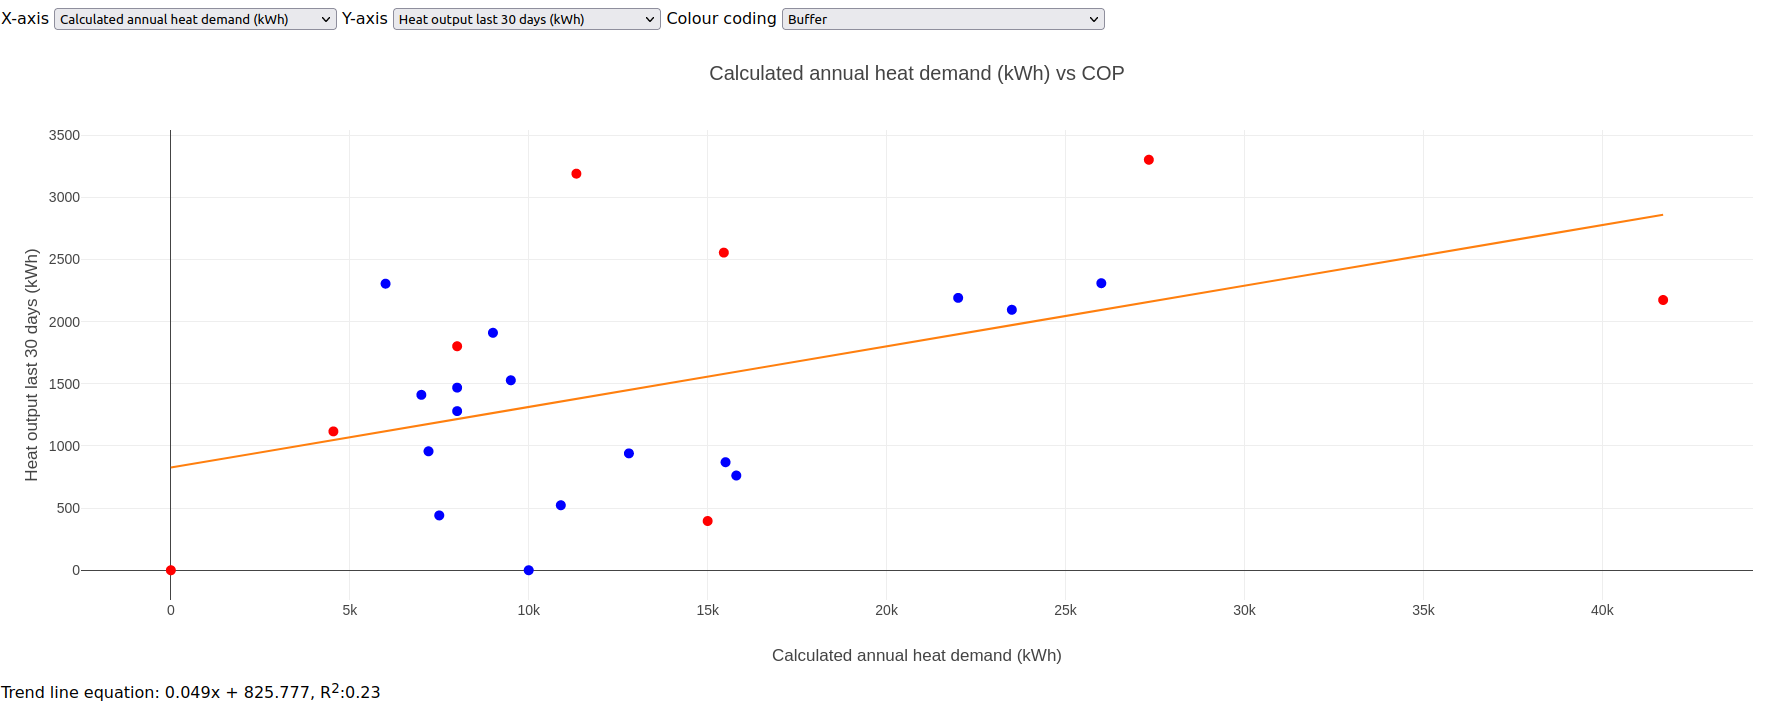
Is this Heat or Energy consumed (just checking) - seems very low considering the design kWh/m².
Is there a correlation between design and consumed Heat/Energy. That might show how good the design/calculated values are.
These are of course distorted by how warm you like your house!
It is heat kWh/m2 but only for 30 days hence large difference compared to annual design value
Ah, might be best to mention that it is Annual Design Heat (rather than energy consumed) ![]()
Still, is there a correlation between the 2?
My GSHP will be showing as an outlier there, since it’s taking heat from the ground loop brine (holding up well at 7 degrees this morning) rather than the ambient air.
Probably not worth worrying about for as long as I’m the only GSHP but when there are others it would be interesting to check flow - brine rather than flow - outside. Would presumably need an enhancement to the MyHeatpump app (already noted via My Heatpump App Enhancement Suggestion - GSHP Brine Temperature Tracking · Issue #179 · emoncms/app · GitHub)
After faffing with open office calc this morning trying to create those graphs, I thought I would have a go at adding a graph interface to the site directly. Bit of a quick go at it but here it is so far: https://heatpumpmonitor.org/graph.html
I haven’t linked to it from the other pages yet, it would be nice to have a tooltip that provides all the data for that particular heat pump, I haven’t figured how to do that yet. I’m using plotly rather than flot. Im more familiar with flot but Plotly has some nice features such as better axis labelling and option to use colour scales for the plot.
Tooltips are working…
good point!
I thought it might be interesting to compare our results so far with those from the Energy Saving Trust ‘The Heat is On’ Phase 2 Trials. Their detailed analysis is available here: https://assets.publishing.service.gov.uk/government/uploads/system/uploads/attachment_data/file/225825/analysis_data_second_phase_est_heat_pump_field_trials.pdf
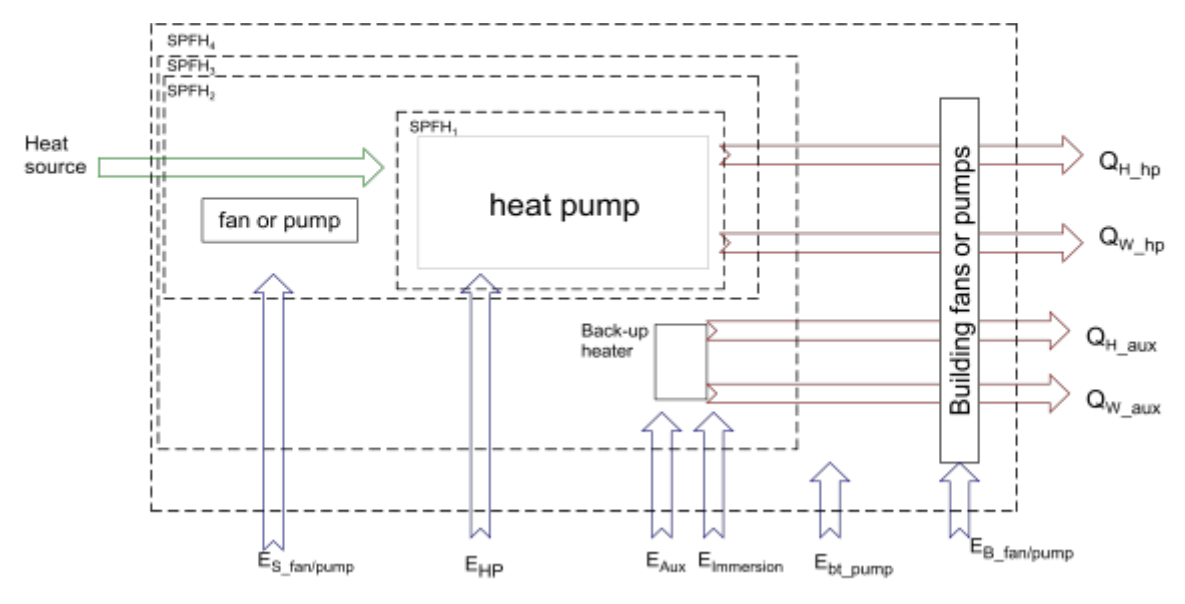
One of the things that their work and report is very good at is defining and collecting data on different system boundaries. It’s something I’ve been aware of for some time having read their report years ago but it’s something we haven’t been very clear on yet on heatpumpmonitor.org.
There’s a useful diagram in the report that defines the H1,H2,H3 & H4 boundary (the accompanying discussion is also useful and worth reading). There’s also a further system efficiency boundary that measures the heat output at the domestic hot water outlets rather than the heat input to the tank.
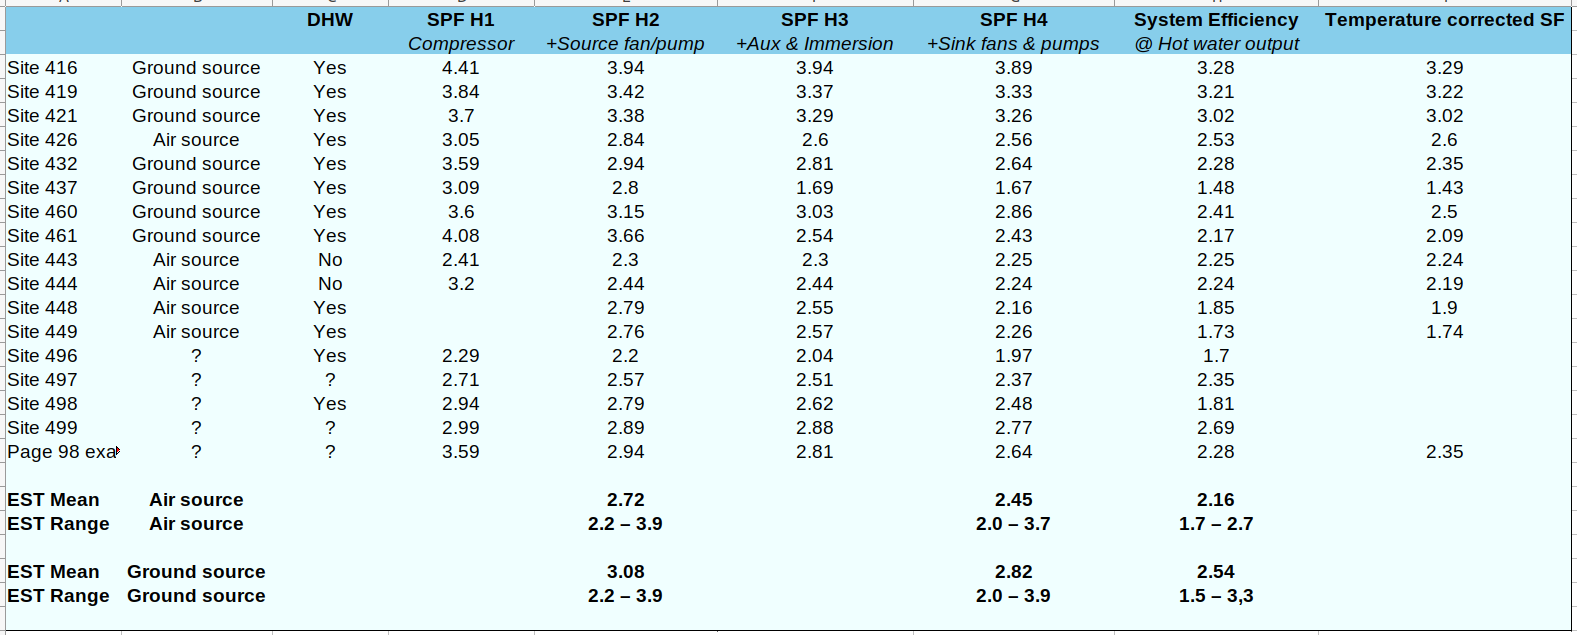
Trawling through that report, I extracted the following table of values for the subset of heat pumps they discuss in the report. Does anyone know if the original data can be downloaded somewhere in full?
The table shows how the SPF figures change with different system boundaries and the results are quite interesting! The drops from H1 to H2 for some of the ground source systems and difference between H1 and H4 can be surprisingly high!
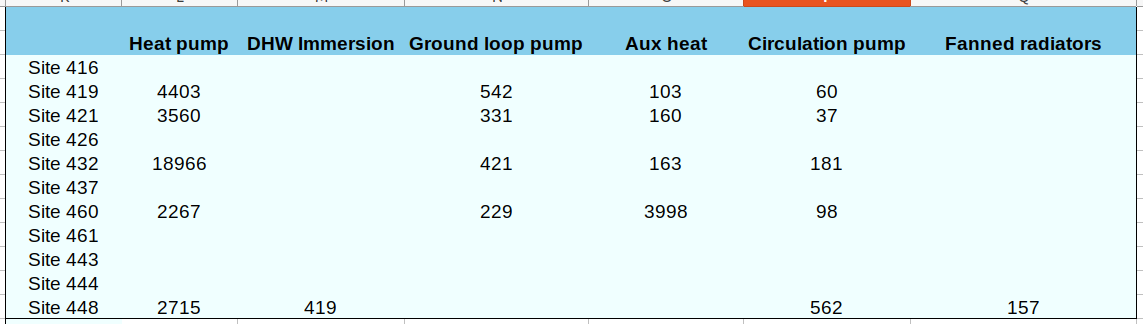
They also share breakdowns of the electricity consumption of some of the sites:
I’ve been monitoring my own system to the SPF H4 boundary with the results including the immersion heater used for legionella protection listed on my monthly summary blog page e.g: https://trystanlea.org.uk/heatpump2021. The results on https://emoncms.org/midterrace/ include everything except the immersion heater - but then I so seldomly use the immersion heater that there’s not that much difference, in 2021 the difference was 4.06 without the immersion and 4.04 with the immersion (correct H4 boundary). Still, I really need to add the immersion heater as a feed option in the My Heatpump app.
Still… my SPF H4 is significantly better than all air source and ground source heat pumps on the subset above ![]() and most of the air source heat pumps on heatpumpmonitor.org have better, if not significantly better SPF H2 values than the SPF H2 values in the trial.
and most of the air source heat pumps on heatpumpmonitor.org have better, if not significantly better SPF H2 values than the SPF H2 values in the trial.
It would be great to be clear about the system boundaries of the data on heatpumpmonitor.org.
A slightly tricky one is how to deal with solar PV divert to an immersion heater? Should that be included in the system boundary of the heat pump? It seems like an unfair penalty for something that makes total sense economically especially if you dont have a battery to be used as a buffer for running the heat pump to do DHW in the summer…
This is a different dataset my chum pointed me to, but I haven’t dug into it yet.
Renewable Heat Premium Payment Scheme: Heat Pump Monitoring: Cleaned Data, 2013-2015
Those Phase 2 trials were April 2009 - April 2010 and heat pump technology has advanced a lot in the intervening years. I regard my GSHP, installed in 2015 as ‘old school’ because it doesn’t have an inverter drive for the compressor and is only ever On or Off - but that was standard for GSHPs in 2015. The use of older technology in those pre-2009 systems will account for at least some of the differences in performance.