I’d noticed this. Perhaps a column with YYMM since start?
Is it really Annual or total (if over a year)?
Yes I’d thought that too, as it is the figure quoted on an EPC.
I’d noticed this. Perhaps a column with YYMM since start?
Is it really Annual or total (if over a year)?
Yes I’d thought that too, as it is the figure quoted on an EPC.
Maybe two columns for the “Annual” use - projected use where there’s less than a year’s data, and actual where there is.
As for cost - with rapidly fluctuating prices, surely this is largely meaningless, whereas ‘cost’ by kWh can at least be converted into a price given today’s (or yesterday’s, or next week’s best guess) tariff.
The heat demand column could be the kWh figure as detailed on the latest EPC for the property, this would highlight how inaccurate the EPC actually is.
Another variable, will be other heating sources (Log Burner, Immersion Heater) which impacts the kWh/m² figure.
Another variable will be DHW strategy (is it all off the heat pump).
Thinking further, other than demonstrating it is possible for a Hp to do the job, the Property information is not overly useful, I’d suggest. The setup (direct, tank, heat exchanger) and how it is controlled might be more relevant to the performance.
[edit]
and perhaps an explanation page is now required with a greater audiance, how to collect data etc. Perhaps some design hints to enable data to be collected?
It is the total kWh for the last 365 days, or less if the system hasn’t been running a full year yet.
The “Heat Demand” is usually from the EPC. My system was predicted to need 22,000 kWh, but I’ve only actually generated 10,500 kWh for the past year.
Perhaps Column heads could be “Electric” / “Heat” and then another column “Period” - e.g. “last 365 days”, with those being less than this greyed out more.
Energy use averaged out over a year anecdotally follows a sine wave peaking mid winter and dipping mid summer to zero (somewhat logical).
If a sine wave is assumed then I think in theory a sine curve and with in annual use could be deduced from a single data point (even 1 day, but 1 week or 1 month would be better) - as frequency is known as annual, and the dip at mid year can be assumed 0 for no heat required. Although won’t be possible to forecast if you only have a summer period with no use.
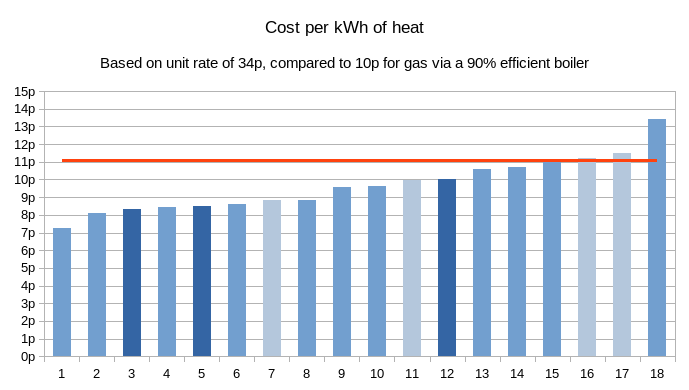
Here’s a quick analysis of running costs for 18 heatpumps listed, ordered by descending SCOP, vs the equivalent cost for a 90% efficient gas boiler (red line), using current the Energy Price Guarantee (as set by UK Government). Analysis may not translate to other countries.

The three darker bars are systems with a complete set of data for the whole year, others are not.
Four paler bars have less than 30 days worth of data, and may change over the year.
Majority of these heatpumps are proving to be cheaper to run than an equivalent gas system.
System #18 is clearly an outlier, and does not perform as well as we’d expect for a heatpump.
Caveat: this is a very small sample, and is heavily skewed towards heatpump owners who have invested in getting good performance from their systems.
The actual running costs will depend on the particular tariff that each homeowner is using, and may be offset by solar PV or other renewable technologies.
Hello,
I have just joined the forum and prepared a message and then lost it just when I was ready to post it…grrr!
Anyway hello and if this message sends successfully I will then send the longer message.
RJK
Welcome, Robert, to the OEM forum.
Sorry to read you had a problem, no doubt you’ll get the hang of it soon. Note that for a while, you’re limited in what you can attach to a post. If it’s a problem, ask. It’s an automatic ‘feature’ to inhibit spammers, and can be set aside quite easily.
Actually, I’m surprised you did really lose it - because I can change browsers and recover a post I was writing, so it might still pop up when you’re least expecting it. ![]()
You’re absolutely right Tim.
My average unit cost for the whole of December was 17p.
Thanks to the EV, Batteries, solar and using the Octopus Go off-peak tariff.
So with a December COP of 3.35, that makes for a nice per unit of heat price in arguably the worst month of the year. ![]()
I’m on track for 14.75p unit price in January.
A post was split to a new topic: ASHP with UFH advice sought
This is an important point and means we definitely don’t have a representative sample. It’s self-selected from people who have opted to install heat metering (often at extra cost) and have also taken the trouble to collect and then publish the data (and probably made configuration tweaks based on the data collected). It would not surprise me if these are among the best-performing installations in the country.
For me the key point is this dashboard shows heat pumps can and do work perfectly well in a wide range of settings and a CoP of 3.5 is a reasonable expectation in the real world, not just in a manufacturer’s lab.
Update: I’ve been working on a new version, which has just gone live!
Most of the changes are under-the-hood, to allow for future features.
Note the change to this header on the right:

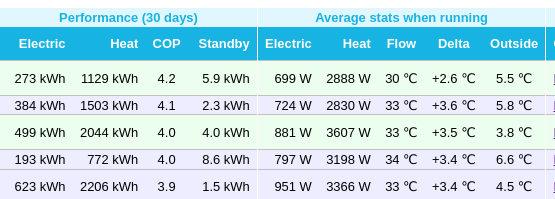
Click on “30 day stats” link to see a new page that has more columns for recent data:

I’m not sure if this page will continue to exist into the summer, or if it will become a “winter stats” page.
Oh, and we’ve now got 25 systems listed now!
Many thanks for your ongoing commitment to this initiative Tim.
It’s great to see the first property from outside the UK listed.
Looks like something’s not quite right though; I’m seeing ‘undefined’ on the summary page and no data on the 30 Day Stats page.
Oops, sorry. That’s fixed now.
Thanks Tim. I’m liking the extra info on the new page. Makes it obvious my GSHP is the only system without an inverter drive (so my compressor is only ever On or Off, and pulls 2kW whenever it’s On) - which is related to it spending most of its time in standby (but with the circulation pump running) hence contributing to the highest-by-far standby power consumption total.
Love this Tim. Great work. ![]()
Is the sorting right on this new 30 day dashboard @Timbones ? I click on the COP heading, but it doesn’t seem to order them by COP? I’m not sure what it’s ordering them by?
Also, will there be a button added (top right) to switch back to the main view?
Great stuff. It’s a fascinating data. ![]()
Glad you’re finding it useful. One of my motivations for this project is for heatpump owners to be able to compare performance their systems against other similar systems to find potential problems.
While the standby for your system is considerably higher than others, you do still win the COP Of The Month award. Is there any way you can turn off the circulation pumps when they’re not required?
Ah yes, well spotted. It was sorting by monthly COP yet displaying yearly COP. That’s now fixed.