Using a Python script to send to the emoncms.org Input API as JSON is working well for me, after a few teething troubles (couldn’t get it to work with a POST sending the payload as DATA but it’s fine as a GET with Parameters).
I’ve got my GSHP temperature data (originating from NIBE Uplink) loading OK to Inputs and on to simple logging Feeds; just waiting for the GSHP to start a cycle to check how that looks in the Graphs.
I’ve then got the problem that the electric sub-meter on my heat pump input only gives me cumulative kWh so looks like I need to derive the instantaneous kW before uploading that.
Thanks @Timbones for a super-quick turnaround on my registration form.
Only about 36 hours of data logged so far but looks like my scripting is working as intended. I’m very much an emoncms newbie so happy to take feedback if anyone spots anything I’ve done wrong.
This is the ideal time of year for Ground Source though… My installation has 2 x 50m-long ‘slinky’ coils about 1.5m down and the soil is still relatively warm this early in the winter (the ‘brine’ is coming in at about 9C just now - even though the air is below freezing). Previous experience shows the ground chills down somewhat over the winter so it will be less impressive in February.
Tim, this is really excellent… well done. I need to make time and have a better look.
I know a 5kW Panasonic ASHP, and should try to put it here.
In the mean time, I have captured a CSV of various readings including temperatures, compressor speed etc. Its got the cold snap. If anyone wants the CSV… they can have it.
emonCMS has options to convert cumulative to Diff in a Graph(see under the graph for the button).
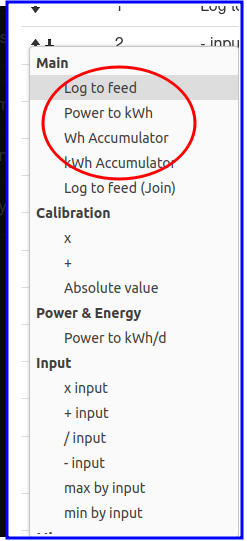
Or the Virtual Feeds options are powerful, all sorts of calculations -eg
Thanks @JustPlaying but I understood that won’t work on emoncms.org when I’m needing to pipe the data into the MyHeatPump App - that requires a ‘proper’ Feed (so not a Virtual Feed either).
I solved the problem by looking back at previous meter readings - I’ve got those logged at one minute intervals so I’m using the average usage over the past 2 minutes rather than the actual instantaneous reading as the "power’ and the latest meter reading as the ‘use’. Some minor niggles with the resolution of the readings (it only reports power to the nearest 30W) which can make the graph a bit ‘choppy’ when the heat pump is on standby but no issue when it’s running and drawing ~2kW.
I’ve put an old 240V coil relay I had lying about (who doesn’t ) on the control to the 3 way valve and I’m reading that on a digital input on the ESP8266 I’m using to monitor the Sika Flow meter output voltage, so I have a digital input in EMONCMS that tells me wether the ehat pump is on heating or DHW.
I’ve been looking at the feeds on heatpumpmonitor.org and notice that my ‘COP 30 mins’ seems to do slightly random things and mostly shows 0 or a very low number. That doesn;t seem to be happening to other heatpumps. The COP in window seems to give the right figure. Any thoughts what might be causing this?
I’ve noticed too that my room temp trace disappears when I zoom out to a week or beyond in the detailed chart screen - it doesn’t seem to happen for other users, again, any thoughts welcome.
Also, I’m wondering if it would be possible to but the average daily ambient temperature (or better still a calculated degree day figure) as a point on the main History chart? It would make daily comparisons more meaningful.
I’ve seen the same behaviour for my system (Derby, GSHP) - typically shows ‘COP 30 mins’ as 0.00 but occasionally an implausibly high figure. I’d wondered if this was because I only post updates to the Inputs / Feeds every 2 minutes but looks like your data is feeding much more frequently than that Rachel, so must be something else going on.
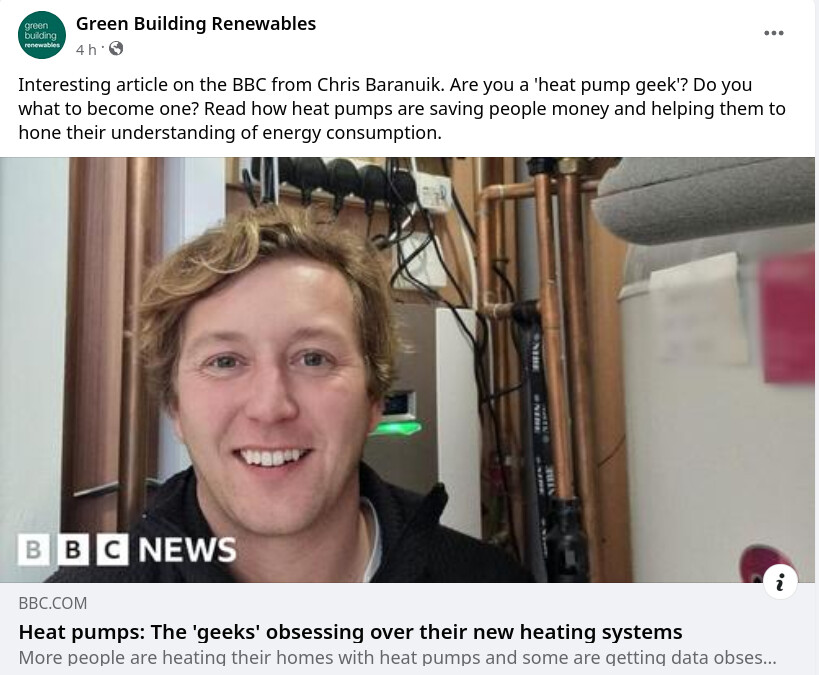
Having come across this data on BBC very interesting to see actual COP being monitored.
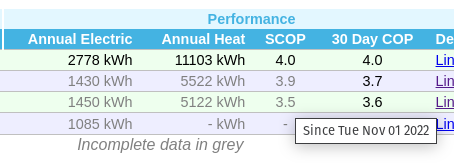
However, the “Annual Heat” in the summary table is very wrong and confirmed by looking at the details, and therefore the summary gives the wrong impression of annual heat required by these properties.
I speculate the monitoring period isn’t being correctly converted to annual (and around half the properties have less than 100 days monitoring).
E.g. No. 18 claims just 246 kWh annual heat - but in actuality looking at the details that’s just the heat used in the last 5 days since monitoring began.
Of course anything with just a brief monitoring period will end up with an inaccurate average until a whole year of data is gathered (and with winter giving a poor/high use average figure), but with time should give an impression of how these houses are also performing from a heat loss point of view.
Once the annual averages are properly calculated it would also then be interesting to see kWh/m2/year for each property, even if this is only really known in reliable detail once a whole year of data is acquired. But it would also provide a good glance to check the calcs are generally right and nothing going wrong. E.g. the Passivhaus should end up 15kWh/m2/yr after 1 year, and expect values then ranging up to ~200 for old housing stock.
Yes, it is true that many of systems do not yet have a full year of data, and so the annual kWh values for these are shown in grey. Hovering a mouse over one of these will show you when the data starts from.
I would be interested to hear any ideas of how to make this clearer. Maybe it just needs to be a paler shade of grey? Perhaps a checkbox to only show systems with a whole year of data? There’s currently just 3 systems will full years (mine has just passed its 1-year anniversary!)
I’m not sure if there’s a sensible way to extrapolate partial data over an entire year, without sophisticated modelling for each system. Simply multiplying one month of data by 12 would be wildly out.
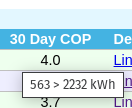
The 30 Day COP is intended to allow for comparisons of different systems for the current heating season, which is likely to become less relevant during warmer months. Perhaps I’ll change this to be “heating season” instead of 30 days. (Hover over COP to see elec/heat kWh for this period).
I am planning to add a page that show running costs for each system (using capped tariffs, compared to gas). This will need to show either only systems with full years, or cost during heating season. Maybe average cost per unit of heat will be good? I shall have to think about this some more.
Are there other analyses that non-heatpump owners would like to see?