Heat Pump testing procedures acc. EN14511 (Samsung)

Dear all,

Because I often have a much lower performance on my heat pump than specified by the manufacturer and received feedback so far has not been helpful to pinpoint causes I decided to just buy a copy of the industrial standard used to test heatpumps in Europe. The EN14511 (I purchased part 2, 3 and 4).

Internet research and my own heat pump documentation pointed me to a number of different standards (Eurovent for example), many of these standards are not usable for testing at home.

The only one that did turn out to be usable (in my search) is the EN14511. This one defines how heat pumps are tested at various load points. So this is the only one that gives you single load points that you can try to replicate and benchmark against.

As far as I could find all heat pumps supplied in Europe should be benchmarked according to EN14511-2 and EN14511-3 even if their construction design code is different.

EN14511-2 is about testing conditions

EN14511-3 is about testing methods

EN14511-4 is about requirements on heat pumps themselves.

When purchasing these standards I was hoping for 2 things:

-To get clarity on the testing conditions and requirements on testing instrumentation accuracy (which I did)

-To get clarity on requirements on the accuracy of instrumentation installed on heat pumps as they are delivered to end users (My interpretation is that there are none).

Disclaimer: If you get any questions after this post: These standards are copyrighted so I am not able to share them or really parts of their contents here. What I am sharing is my interpretation of some core information I found that you could use to approach these conditions as good as possible when doing your own tests. I am not liable for any misinterpretation of these standards.

Preparation: What information to look for about your heat pump

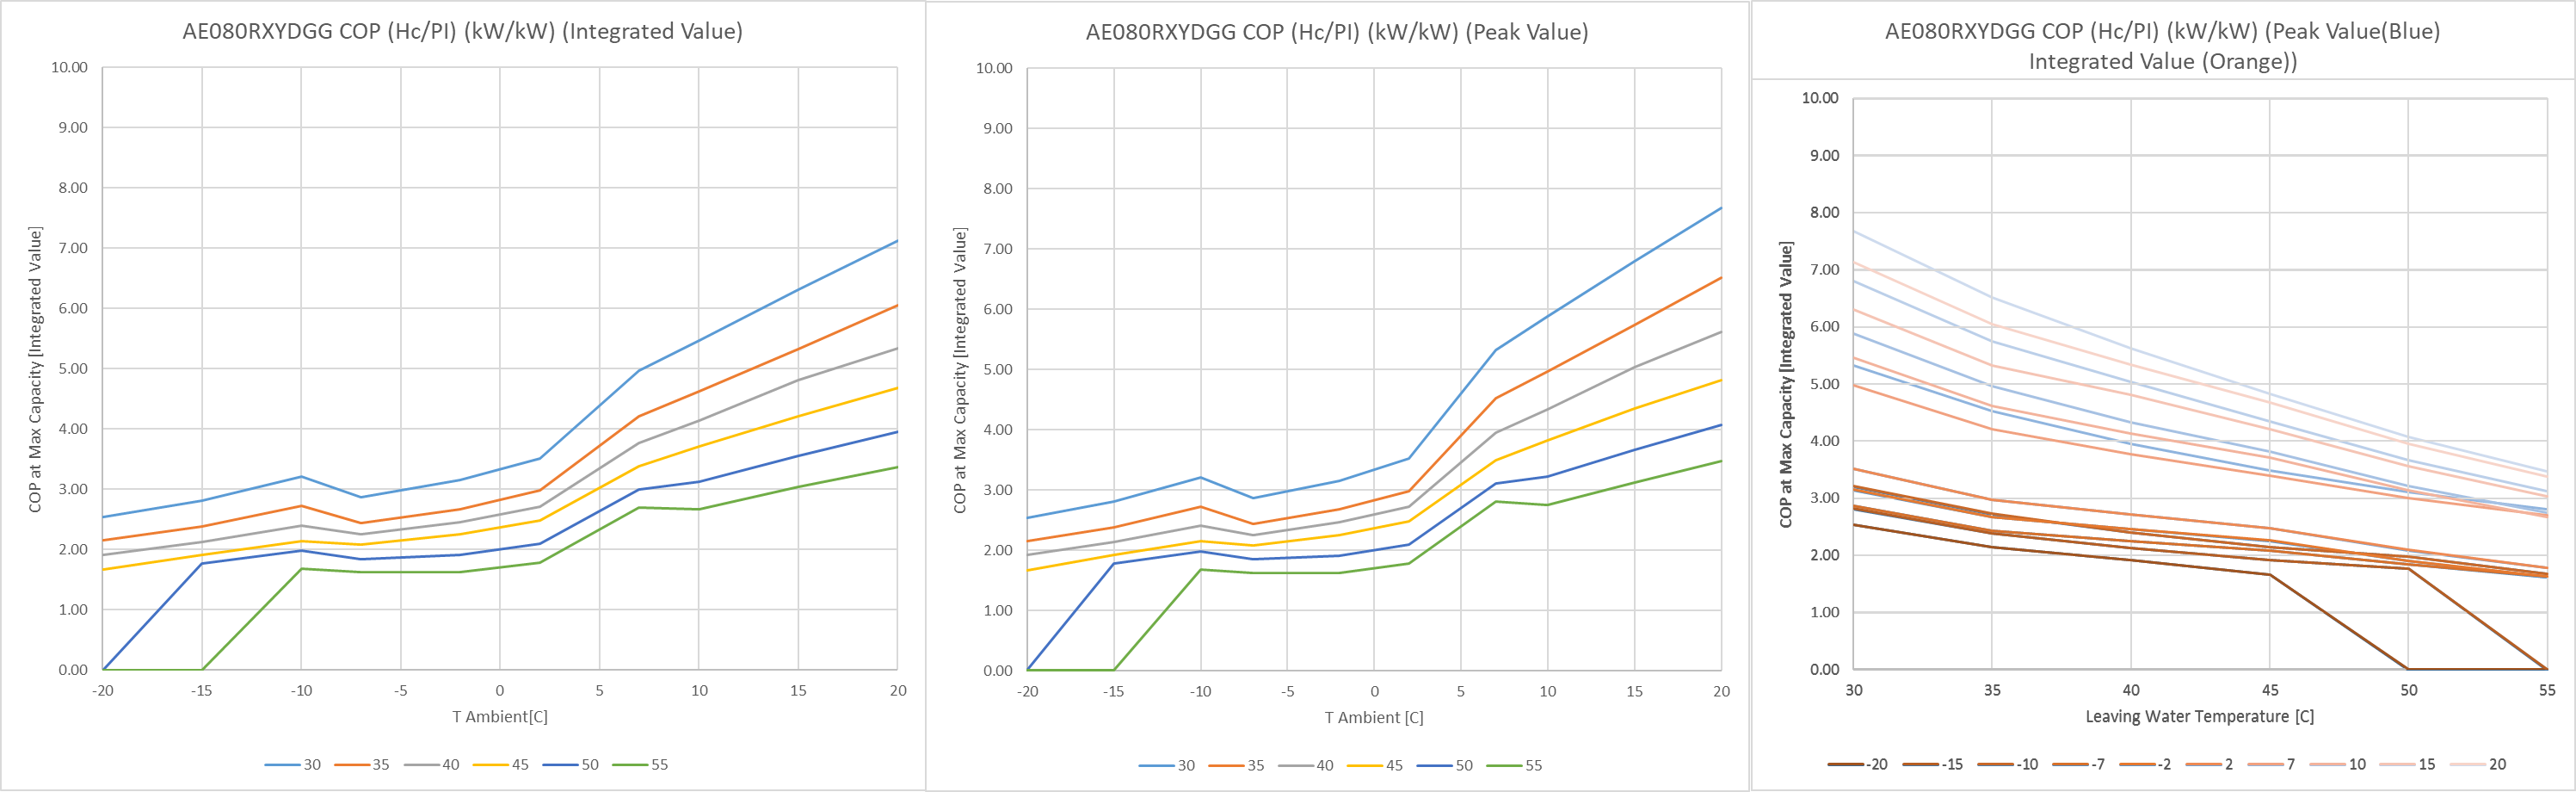
For heat pumps tables similar to the one below are published with their technical information. It states for a number of combinations of ambient temperature and leaving water temperature the following data:

-Supplied heat at high load

-Consumed electricity at high load

If you divide supplied heat by consumed electricity you get the COP at that load point.

Supplied values by Samsung for example are both ā€œpeakā€ values and ā€œintegratedā€ values. Peak are values without defrost and integrated are values with defrost cycles included.

Note on SCOP vs COP: SCOP is a value determined by combining a lot of the tests from the table below with specific weighing factors and not workable to benchmark in a real field installation. So if you want to benchmark anything verifyable you do so based on the tables below or similar info for the specific heat pump you have.

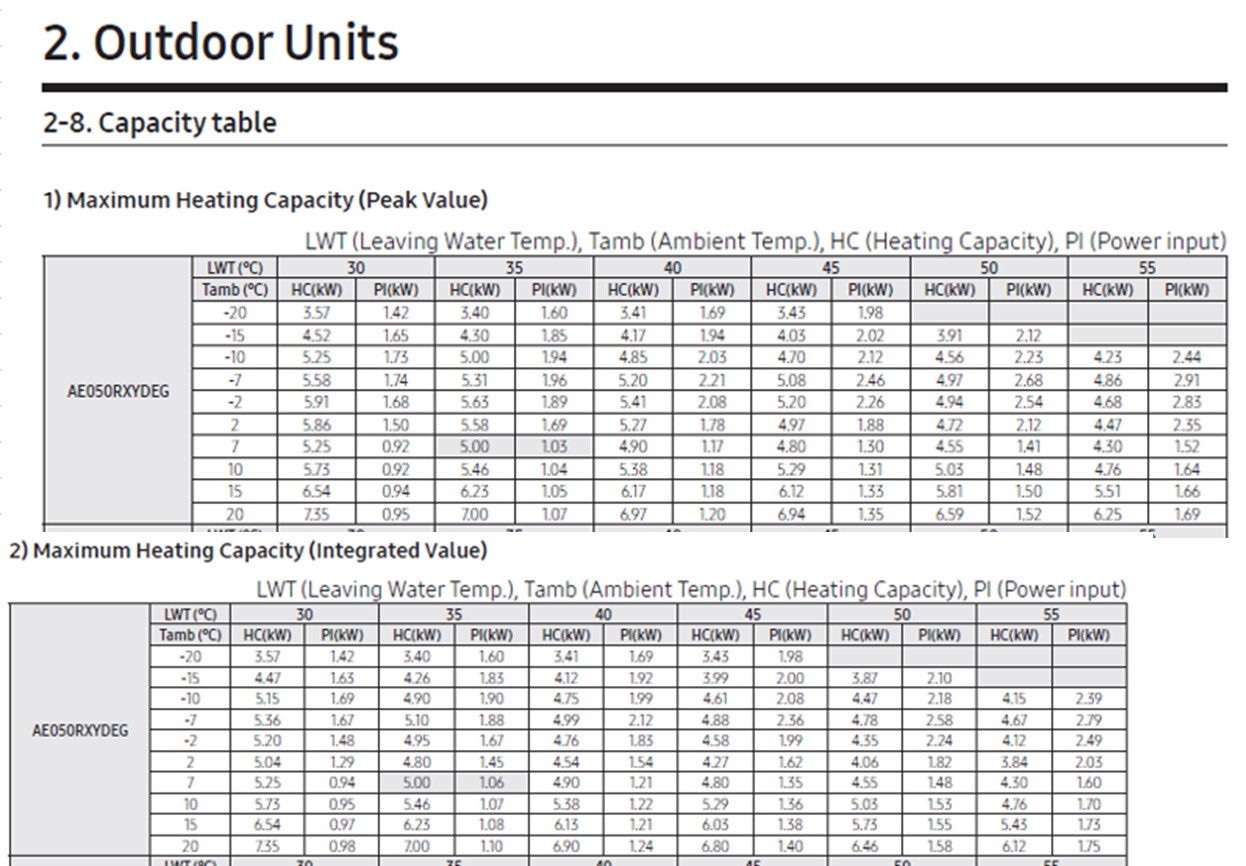
Power consumption and supplied heat of a Samsung AE050RXYDEG Heat Pump (Samsung EHS Technical Data Book)

Outside air temperature and humidity (relevant mainly for defrosts)

EN14511 specifies a number of outdoor temperatures, wet bulb and dry bulb. The differences between the two are such that they correspond to a relative humidity of approximately 93%. My interpretation is that any relative humidity below 93% should probably lead to lower amounts of defrosts and therefore lead to a higher COP-as-measured than published performance figures indicate.

That said I am not sure if lower relative humidity could lead to some ice building up and staying there but not building up thick enough to trigger a defrost.

Testing time and stability of operating conditions

EN14511 specifies the testing procedure with how to start circulation pumps, equipment in the testing chamber and so on. Temperatures have to end up being stable within a few tenths of a degree for a few minutes before the benchmark can start.

If you end up doing a test that includes 1 or more defrosts you always benchmark from end of defrost to end of defrost. It is best to make sure you have more than 1 defrost in your benchmark if they occur at all. Benchmark test time is more than 1 hour in the standard so make sure you take a similar time frame (or longer) for your own benchmark. EN14511 states that if a defrost occurs at the end of the testing time the full defrost cycle has to be included (in that case the actual test time will be longer than the standard testing time).

Then during testing it is permitted to change water outlet setpoints to keep the actual water outlet within boundaries required by the standard.

If all temperatures remain sufficiently stable for the entire test the test is deemed a steady state test. If deviations occur outside these boundaries (for example due to a defrost), the test is deemed a transient test. ā€œIntegrated valuesā€ for the Samsung performance data for example are all ā€œDynamic testsā€ So having 100% stable temperatures is not a requirement to say anything sensible about the data you measure.

Testing measurement accuracy

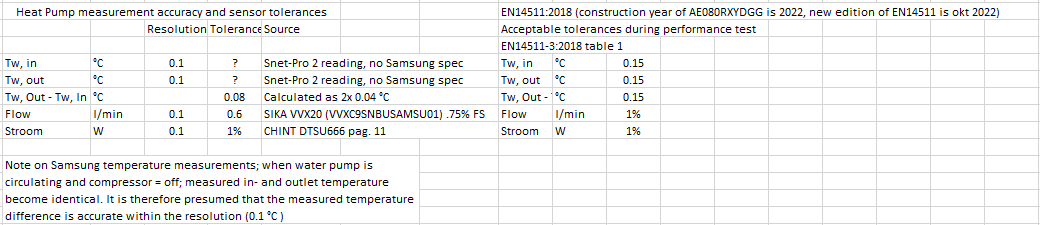
EN14511 specifies a number of sensor accuracies which I am not going to cite all but the following are most important for air-water heat pumps:

-Air temperature: within a few tenths of a degree

-Water temperature: Within 0.15 C

-Water temperature increase: Within 0.15 C

-Consumed electric power: Within 1%

-Water flow rate: Within 1%

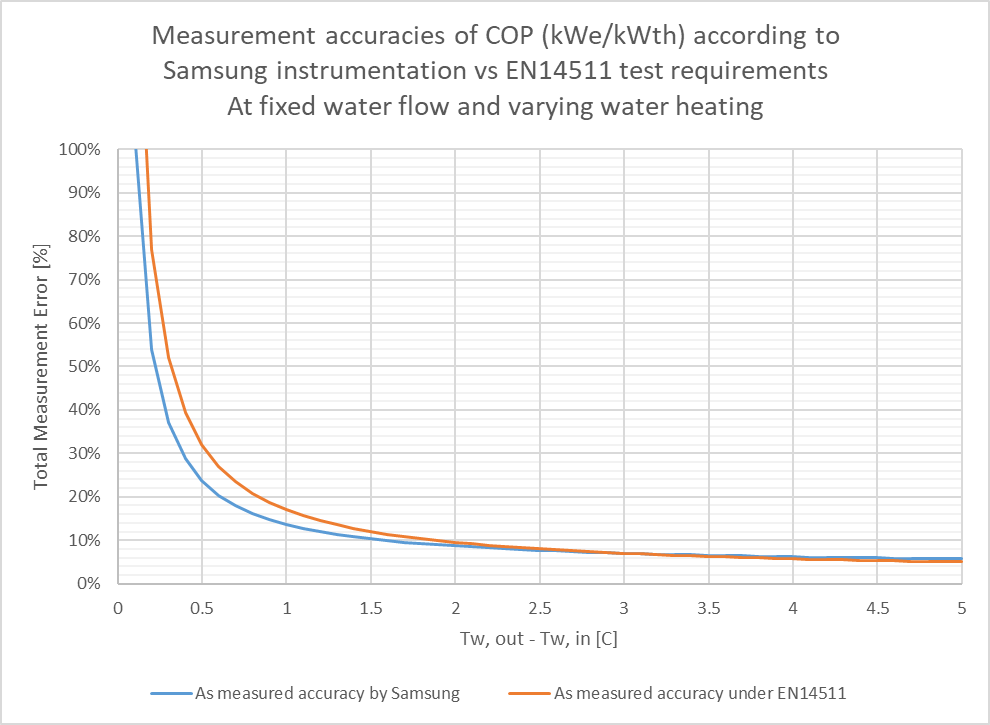
Below is my interpretation of the required accuracy during the EN14511 tests compared to my intepretation of the accuracy I have been able to find for the instrumentation on my Samsung heat pump. I presumed full water flow at all part loads (which is the case for my setup as my pump is not PWM controlled). Then plotted both accuracies as a function of temperature increase. These line of Samsung also includes inaccuracy due to rounding off the measured values to 0.1C.

In my view the measurement requirements during the EN14511 tests are not exotic compared to the instrumentation that came with the heat pump. Power consumption accuracy is also comparable to fairly standard 3phase modbus power meter on sale for about €100,-.

That’s it. If you need to find more I recommend to purchase these standards. They can be bought -among others- on www.nen.nl

Very interesting summary, @Martijn_Hinderdael.

A couple of comments and queries:

  1. Neither of your attached sketches downloads properly (or at all) - maybe you didn’t upload correctly?
  2. You refer to the Samsung EHS Technical Data Book. In the version for the Mono Quiet series, I see that Section 2-9 has 4 capacity tables (two labelled ā€œPeak Valueā€ and two labelled ā€œIntegrated Valueā€, but all four are identical. Even those headed ā€œIntegrated Valueā€ bear the legend ā€œā€¦tested without defrost operation in accordance with EN14511ā€ (my emphasis) :thinking:.
  3. It may be worth distinguishing between the results of the type tests that Samsung perform in the lab to EN14511 (presumably this requires a minimum number of sample units) and those you get on your installed heat pump (which will be subject to the usual manufacturing tolerances, so may vary +/- on performance). Some devices - like safety valves - require manufacturers to apply a derating factor to account for this, but (unless EN14511 says otherwise) I very much doubt whether heat pump vendors are required to.
  4. Neither the Data Book, nor Samsung Tech Helpdesk, tell us what compressor speed was used for preparation of the capacity charts, or even if it was held constant in their preparation. (I wonder whether EN 14511 requires this?) Neither do they tell us how the capacity/power figures vary with compressor speed. I assume that they aren’t required to, so they don’t. Whatever, the cynic in me believes that they tweak their design for best efficiency at 7degC ambient, 35degC LWT - the universal comparison point - for marketing purposes.
  5. The numbers in the table do not vary smoothly between columns and rows as one would expect, so can at best be used as a rough guide.
  6. The instrument accuracies you list presumably apply to the bench test equipment, and not those fitted on the average installed heat pump. For example, the circulating fluid flowmeter will be fitted by the installer (not Samsung) and could be subject to significant error (e.g. too near eddy creators or not properly calibrated), making comparison with vendor capacity tables difficult. [My MID-certified heat meter suggests that the flowmeter used for the controller energy output calculations is indicating ~10% high.]
  7. Your Note on SCOP vs COP. My understanding of SCoP is that it is the ratio of the time-integrated values of energy produced and consumed, rather than the result of ā€œspecific weighing factors and not workable to benchmark in a real field installationā€. Have I got this wrong?
  8. Your comment ā€œThat said I am not sure if lower relative humidity could lead to some ice building up and staying there but not building up thick enough to trigger a defrostā€. For Samsungs at least, ice thickness is neither measured nor used as a trigger. See Samsung R32 ASHPs - when is a defrost not a defrost? for the Samsung EHS defrost algorithm.

Somehow I figured (or was hoping) you’d be either the first or one of the very first to respond @SarahH :wink:

Find my Excel table with AE080RXYD*G performance data below.

The first sketch was a snapshot of that data from the EHS technical handbook.

To me it shows up just fine…on my phone as well as the laptop I posted on so I don’t see what I can solve on this right now. Anyway find more below, I hope the pictures show up better.

That handbook is too big to upload here and this forum does not support uploading Excel files.

Below some more elaborated data: Left 2 graphs are COP per water outlet temperature as a function of ambient temperature. Somehow defrosts only played a significant role for the COP at high water outlet temperatures. Below -15 C no wet bulb ambient temperature is specified which you can also see below in the tables resulting in zero difference between figures for the lowest outdoor temperatures.

Maximum Heating Capacity (Integrated Value) AE080RXYDGG COP at Max Capacity (Integated Value)
LWT (ā„ƒ) 30 35
Tamb (ā„ƒ) HC(kW) PI(kW)
-20 5.60 2.21
-15 6.56 2.33
-10 7.86 2.45
-7 7.72 2.69
-2 7.53 2.39
2 7.35 2.09
7 9.45 1.90
10 10.38 1.90
15 11.93 1.89
20 13.48 1.89
Maximum Heating Capacity (Peak Value) AE080RXYDGG COP at Max Capacity (Peak Value)
LWT (ā„ƒ) 30 35
Tamb (ā„ƒ) HC(kW) PI(kW)
-20 5.60 2.21
-15 6.63 2.36
-10 8.02 2.50
-7 8.04 2.80
-2 8.56 2.72
2 8.55 2.43
7 8.40 1.58
10 9.23 1.57
15 10.60 1.56
20 11.98 1.56
Maximum Heating Capacity difference (Peak Value minus Integrated Value) AE080RXYDGG COP difference (Peak value minus Integrated Value)
LWT (ā„ƒ) 30 35
Tamb (ā„ƒ) HC(kW) PI(kW)
-20 0 0
-15 0.07 0.03
-10 0.16 0.05
-7 0.32 0.11
-2 1.03 0.33
2 1.2 0.34
7 -1.05 -0.32
10 -1.15 -0.33
15 -1.33 -0.33
20 -1.5 -0.33

On your remark 2:
I evaluated the version of the book I got…
TDB-EHS-Tank-integrated-hydro-unit-for-Europe-Mono-R32-50Hz-HP-Ver.1.1_190522.pdf
It somehow does not show up in my search results anymore…maybe you can find it if you search specifcally for this file instead of for ā€œSamsung EHS Technical Data Bookā€

The file I have shows the differences I elaborated on in my post above.

On your remark 3:
I did not find anything in the EN14511 parts I purchased about a minimum number of units that had to be tested. EN14511-3 has no hits when searching for de-rating (or derating), also nothing similar when I search for rating (Rating has 31 hits).

On your remark 4:
I did not find any info in EN14511 dictating that the compressor, fan have to be operated at fixed speeds.
Paragraph 4.4.4.8 of EN14511-3 even states that some fluctuations of process parameters as a result of the functioning of control devices is permissible.

On your remark 5:
I consider these tables performance data that my heat pump should be able to match, not a rough guide. These are the only values that end users have any possibility to validate the performance of the unit they bought against so they had better be accurate enough (or include enough safety margin).

On your remark 6:
The table below shows my comparison between what my Samsung has actually installed and EN14511 requirements. In my opinion the accuracies are fairly similar.
Biggest point of discussion could be the water flow meter. But the water flow meter supplied is a VVXC9 meter by SIKA with quick-fasten connection (and therefore a decent straight in- and outflow length thanks to the straight pipe spools supplied with that sensor)

On your remark 7:
This time integrated value is -as far as I could find- a sum up of a selection of the operating points in the table I shared earlier in this topic. These are then added up to match ā€œStrasbourg weatherā€ as Strasbourg apparently has (close to) the most average European weather. Each ambient temperature has a certain likeliness of occurring and also higher ambient temperatures require lower heat pump load. That said I did not find any info in EN14511 on how to replicate that. If memory serves me well there is a EU guideline that does specify how this is done but again replicating this is too much of an exercise for any regular end user.

On your remark 8:
Interesting info! Reading that I still imagine that having some ice built up but the heat exchanger staying above -6 C could happen for prolonged amounts of time. So it is indeed a confirmation of what I thought.

@SarahH would you be able to share the full PPTX/PDF in your remark 8 with me? I can’t find it for downloading anywhere…

It was actually a link to an external site - it was ā€œGONEā€ when I looked.
@Martijn_Hinderdael Please always upload everything here, not give a link to another site. If the other site goes down, your post here loses much of its value.

I only posted a link to a large pdf of the ehs technical data book that refused to upload.

Everything else from me here is copy paste of images and tables (so far)
Any solution for uploading a large pdf here?

Found it here, courtesy of Bulgaria ……..

It won’t upload, too big. However, I asked Adobe Acrobat to compress it and it did a much better job than ZIP, there you go …………

TDB-EHS-Tank-integrated-hydro-unit-for-Europe-Mono-R32-50Hz-HP-Ver.1.1_190522-compressed.pdf (8.9 MB)

I’ve done some work comparing Samsung onboard monitoring with independent MID (class1 & class2) meter data. In the two systems I’ve been involved in, the onboard Samsung data has over-reported electric usage and significantly under-reported heat delivered. Therefore, It’s worthless to compare the onboard monitoring data with official lab test data.

I think it’s far better to compare real-world performance data, since the lab tests don’t really translate to real-world conditions. This is one of the reasons why we started https://heatpumpmonitor.org/ to enable real-world comparisons. e.g find another installation with the same make, model and size of heat pump and compare the average flow temperature, COP etc.

System 1 (Video)

OpenEnergyMonitor SCOP (MID meters): 4.3
Samsung SCOP: 3.2

Samsung over-reported electric by 5%
Samsung under-reported heat by 20%

Samsung SCOP was under-reported by 32%


System 2 (Video)

OpenEnergyMonitor SCOP (MID meters): 4.7

Samsung SCOP: 3.3

Samsung over-reported electric by 13%

Samsung under-reported heat by 19%

Samsung SCOP was under-reported by 32%


Most of the above inaccuracy comes from the temperature sensor readings, the Samsung Sika flow meter reading is usually pretty good. Because variation in manufacturing and sensor calibration, we shouldn’t assume that all Samsung will under-report SCOP, some might over-report, there’s really no way of knowing without an MID heat meter to compare against.

2 Likes

The default attachment upload size limit is 10MB. @glyn.hudson would be able to change this, the alternative is to split the file into sections (there is free software to do this) and post them separately.

The two ā€œimage.pngā€ are actually links to Google Mail, and when I attempt to access them, both report ā€œGone - Error 410ā€

For attachments above 10Mb, it’s probably best to share Dropbox / google Drive links

If you are referring to the defrost algorithm PDF, Martijn, here it is…
EHS Defrost Algorithm.pdf (1.6 MB)

BTW many thanks for your responses. The only point I would add (to my comment 5.) is that in my EHS Technical Data Book, there are two places that refer to operating performance.

  • The Specification (Table 2-1) gives what I would call the official (definitive) performance figures at the normal comparison point of 7/35 plus a small number of alternative reference points (7/40, 7/47, 2/35, -7/35). If I was wanting to make a warranty claim then I would probably make these my basis.
  • The data in the Table 2-9 capacity tables I would regard as indicative only. They are claimed to be derived using Eurovent rating standard OM-3-2015 (not EN14511) and valid only over a limited range of water deltaT (i.e. LWT - RWT). But when I look at OM-3-2015 it has only limited relevance to A2W heat pumps - it’s really written around air conditioners and worries about things like primary-to-secondary air leakage and pressure drops (nothing at all about accuracy of test equipment as far as I can see). In other words, these data are at best useful for comparison with one’s own observations, but hardly fit for a warranty claim.

I had the original post sent to NEN to validate if what I was about to post here could be legally posted. Apparently copying the mail and pasting it back here did that to the images.

I took out the pictures, went back to Excel and pasted them back in straight from Excel. Are they visible now?

@SarahH I was hoping you were in the posession of a PDF with a lot more control algorithms in them and Defrost was only one of them. Do you have such a document?

@glyn.hudson Are you referring to the supplied heat and consumed electricity as displayed on the wired remote control for your figures? I don’t really trust those either.

What I do is I take a log file generated using SNetPro2 taking the onboard readings for temperature in/out, ambient and water flow. I combine that with the consumed electricity measured with a CHINT DTSU666 electricity meter (connected via Modbus) to my PLC.

Then both logs are combined into 1 file where I can do my analyses. I usually make scatter plots of instantaneous heat delivered vs instantaneous heat supplied on top of taking some longer time averages. In my opinion that should have the accuracy I plotted in the bottom graph of my opening post.

Indeed they are. :+1:

Hi again Martijn,

Unfortunately not, I believe that the defrost and frost prevention ones are the only ones that Samsung have put specific details of in the public domain (and disassembling the EEPROM machine code to identify other algorithms is way above my pay grade). We have inferred quite a bit about others through observation/reverse engineering (e.g. compressor suction/discharge pressure control, min and max compressor speeds, circulating pump exercising frequency etc.) but unless we can install a spy in the Samsung design department its pretty much inspired guesswork.

Yes, that’s what lots of us do to calculate generated energy, but (I think I recall) the LWT and RWT sensors are only taped to the inlet/outlet pipework (don’t know whether HT cement is used) so may be +/-0.5degC at best , so if the actual deltaT is only 2degC that could introduce a big error as @glyn.hudson suggests.

I believe that the WRC gets its energy generated/consumed data from NASA 0x4427 and 0x8414 respectively (totals since installation) by recording their values at beginning and end of the month (for instance) and calculating the differences. The instantaneous values are available at 0x4426 and 0x8413, but SNET doesn’t display these (though NASAmonitor does - see Samsung ASHPs: Review of NASAmonitor – an Alternative to SNET-Pro2). You can get 0x8413 into the SNET display (see Samsung ASHPs: Customising Your SNET-Pro2 Display) but not 0x4426. The NASA messages 0x4426/7 are based on pure water as the circulation fluid, but happily (if you have glycol up to about 30vol%) the density increase and sp ht decrease cancel one another almost exactly, giving a net error in reported energy generated of less that 0.5%. If you do use the above ā€œinstantaneousā€ NASA messages, be aware that these data only arrive at F1/F2 every minute or two (fine for CoP calcs if averaged over a few refreshes as NASAmonitor does).

Hope this doesn’t confuse things further - I’m getting a little off-topic here… :face_with_diagonal_mouth:

Yes, correct. The readings on the controller are using the same sensors inside the heat pump. The error will be present irrespective of how you’re logging the readings. I took my readings via Modbus, but the result will be the same.

To be accurate the temperature sensors need to be a calibrated pair in direct contact with the water flow inserted inside the pipe. This is what heat meters use to achieve class 2 MID accuracy.

1 Like

Well so far I have not had any occasion where the in- and outlet temperature of the water did not converge to exactly the same value if only the circulation pump was running…

So the individual values may be off but I do expect the difference between the 2 to be accurate within the 0.1C ballpark.

On my heat pump that is…

Adding my observations of my gen6 12kW unit.

I have a MID electricity meter measuring electrical use for the outdoor (heat pump) unit connection spur. This does not include any indoor equipment such as circulation pumps and MIM controller etc. Over long runs (all day), the Samsung electrical consumption are around 150W per hour higher than the MID meter, which is roughly consistent (maybe a little high) with my two Wilo circulation pumps and the MIM controller, and is consistent with @glyn.hudson observation that the Samsung controller over-reports electrical consumption by 5-10%

I do not have a heat meter so am reliant on the Samsung figures for heat generated. Like @Martijn_Hinderdael my sensors seem reasonably well matched as when the system is allowed to rest for a prolonged period, both sensors revert to the same value.

I calculate two daily COP figures, using the two electrical usage figures available to me - the MID figure which only records the outdoor unit and the Samsung reported figure which includes outdoor and associated indoor equipment (including two circulation pumps). Over a wide range of OATs, the higher COP figures using just the MID meter electrical usage are very close to the Samsung published figures for my unit (Samsung Technical Data Book, Integrated Value). I wonder if Samsung are only measuring electrical usage of the outdoor heat pump unit when calculating their published figures, rather than also including fixed ancillary usage of pumps etc. This would make sense in that including electrical usage for ancillary equipment will vary from installation to installation depending what ancillary equipment is used, and this fixed ancillary electrical usage for circulation pumps etc has a larger relative impact on a small 5kW unit than it does for a large 16kW.

I actually find this COP figure that excludes the electrical usage of circulation pumps and control systems useful for making a more direct comparison against my old oil boiler (or a gas boiler) which would also have associated electrical usage (and cost) for circulation pumps etc, but which are ignored when considering how much oil or gas we would have burned to generate the required amount of heat. Nobody ever adds 10% for the electrical cost of the circulation pump (and I think the oil boiler must have had an oil pump too), so it makes sense to remove them from the heat pump calculation when making comparisons with oil or gas heating systems.

I’ve also done a sanity check on the Samsung heat produced figure against a DHW tank run from cold which aligns reasonably well against the calculated heat required to raise the temperature of the tank volume by the dT between the cold inlet temperature and the tank set point, and again it’s in the right ballpark so I’m happy my sensors must be reasonably well matched. Overall I’m reasonably confident that my Samsung reported figures are in the right ballpark but I have no doubt I’m fortunate my sensors appear to be reasonably well matched as this is potentially the largest source of error in my data (especially given my dT is very narrow at around 3C). But as @glyn.hudson says, unless you have a MID heat meter fitted, the scope for errors or variation in the data is large.