If anyone can help make sense of this data, would certainly welcome it! We probably need to separate out as many of the different contributing factors as possible, e.g only compare over sizing factors for the same heat pump model running at similar mean flow temperatures?
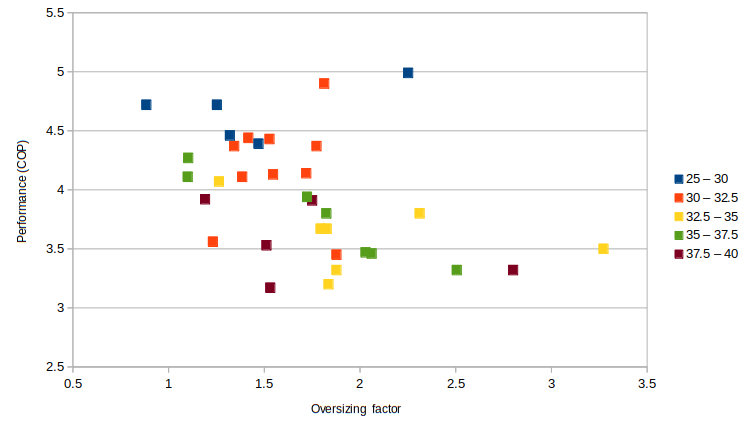
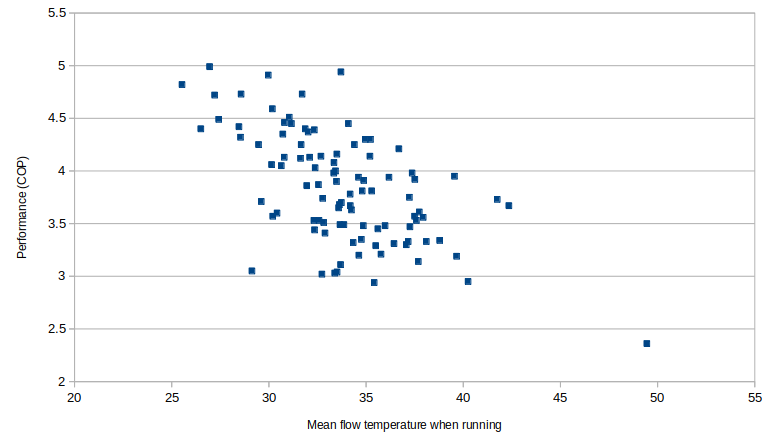
Here’s another chart that shows the relationship between mean flow temperature when running and performance for 97 systems with 72-90 days of data, which is arguably the stronger relationship.
Again here the range is interesting:
There are systems with mean flow temperatures of 26C up to 34C getting close to COP 5.
There are systems running at mean flow temp 34C with COP’s from 3 all the way up to 5…
Some of the outliers may be data processing issues, I noticed one system reporting low mean flow temp that had a period where the standby consumption was above the running threshold that I need to look into in more detail.
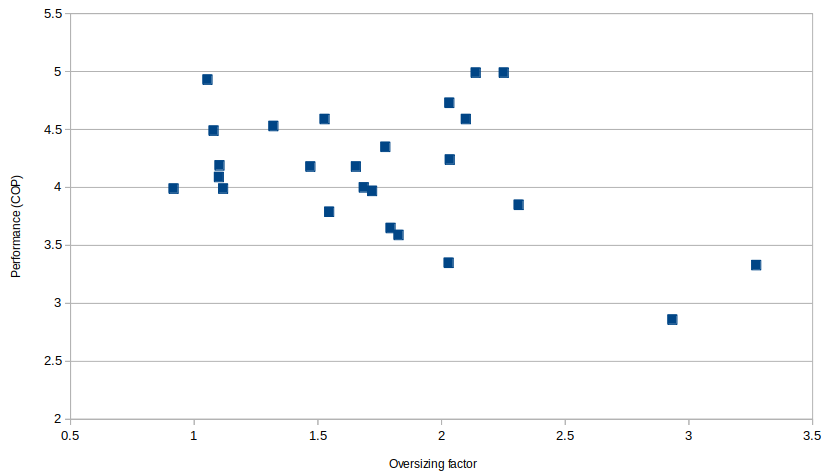
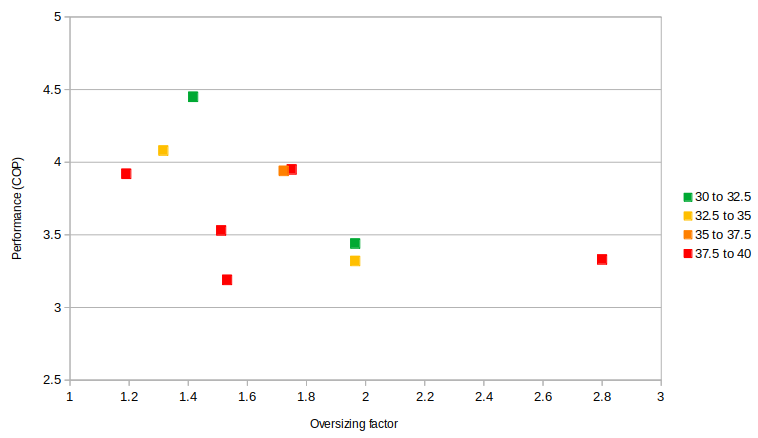
Performance vs oversizing factor for 10 Daikin systems with 90 days of data. Oversizing factor based on badge capacity, datasheet values are slightly lower and some of our own tests much lower which would give lower oversizing factors across the board of course…
First green system on the left is @ColinS’s 11 kW Daikin. The projected heat demand comes out to 8.7 kW but we’ve only seen 7.8 kW in reality from this unit. 11 kW / 8.7 kW = 1.26x oversizing factor. 7.6 kW / 8.7 kW = 0.87x (undersized).
Highest performing green system at the top is @matt-drummer’s Ipswitch system. Projected heat demand: 5.24 kW, 8kW badge capacity = 8 / 5.24 = 1.53x. Actual capacity of this heat pump is likely less due to defrosts but how much Im not sure, we dont have any low temperature data points that are more than 4.4-4.6 kW so far.
Lowest performing systems have both highest average flow temperatures and largest over-sizing factors (Hertfordshire & Farnham).
Looks like it’s probably a good idea to have a badge capacity that is around 1.5x the accurate heat loss for the property (but not 1.5x the inflated heat loss based on high air change rates etc).
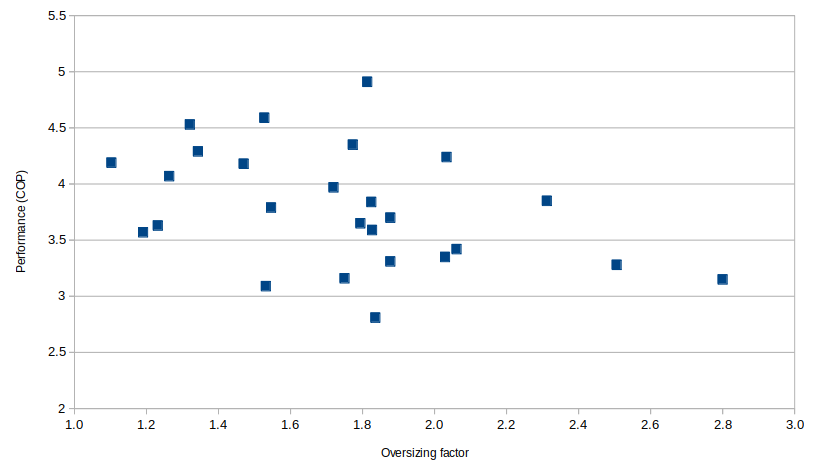
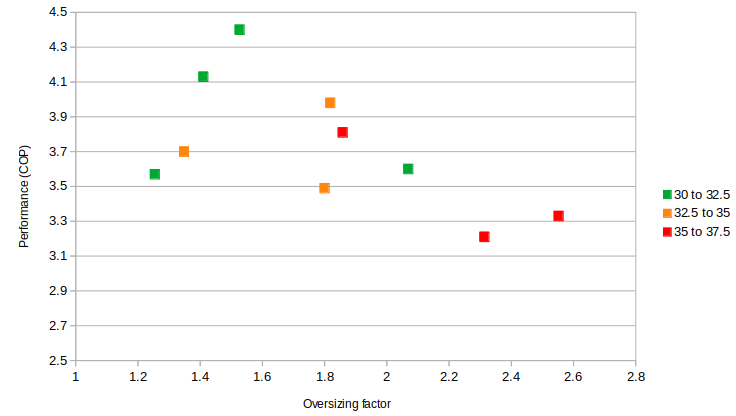
The same chart for Mitsubishi Ecodan’s. Again 10 systems, 72-90 days of data. Oversizing factor based on badge capacity - real oversizing factor may be lower, important caveat…
Highest performing system has 1.42x oversizing factor and lowest average flow temperature when running (31C). Derby 8.5 kW Ecodan with 6 kW measured heat demand https://heatpumpmonitor.org/heatloss?id=138
My older 5kW R410a Ecodan is the yellow data point COP 4.1, oversizing factor of 1.3x vs badge but I think more like 1.18x in reality based on my max output tests, 33C average flow temp.
Why is Newbury, Greenwire (system 32) with 2.8x oversizing, getting slightly better performance than Huddersfield (system 56) with a 1.5x oversizing factor. Flow temp on system 56 is 40C vs 38.1C for 32. But then Weymouth (system 7) has also a 40C average flow temp but is getting a performance closer to COP 4.0 and an oversizing factor of 1.75x…
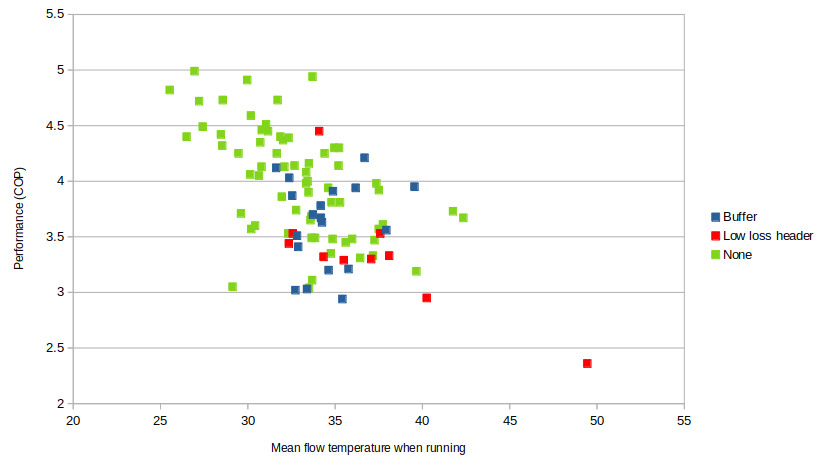
Looks like all the highest performing systems are open circuit combined with low flow temperatures, but still a wide spread with large overlapping areas with all 3 options…
The system with a COP of 4.94 but a relatively high flow temperature of 33.7C is a ground source.
It’s time weighted but restricted to the periods of time when the heatpump compressor is running, with a simple if electric consumption is more than 100W condition.
This threshold should be configurable on a per system basis but is not yet so. I’ve noticed at least one system that is caught out by this with the average flow temp being reported as 30 when it’s actually 35 so it’s a calculation that needs improving.
Good idea to weight by volume, will look into that.
This is volume weighting is what we do in the district heating space - that and binning by power level or flow rate etc to coarsely disaggregate operating modes. Can be surprisingly effective!
My 90 days of data in your chart is not actually 90 days of an 8kW Daikin, I haven’t had it for 90 days yet since it was only installed on 20 February 2024.
Interesting data. It seems to confirm that Low loss headers are a bad idea unless they are really needed to supply multiple flow temps to different zones. It should be obvious to the MCS and others really and needs to be built into training more. As i guess most people on this forum know LLH is just an open circuit bypass that means that HP flow temp has to be higher than needed and so the pump will have both a lower COP and have to cycle more.
The evidence here for buffers is less conclusive but I would like to see more up front calculation of system volumes before buffers are put in. They are only needed to guarantee defrost performance but at the expense of slowing down heat up times.
@trystan - is the above analysis saying that only one of our systems has ever produced at its max data sheet rating?
@TrystanLea Trystan - one factor to consider is those heat pump controllers which have a degree minute function to limit cycling at low demand versus those that don’t. Manufacturers with degree minute functionality in their controllers include Nibe,Vaillant and Stiebel Eletron and perhaps some others. The function may be termed something different by the various manufacturers - for example Stiebel Eletron call it Kelvin Minutes
Jez
Thanks @Jez, Yes agreed, the heat pumps that can do that seem to be able to handle cycling much more effectively than those that end up rapid cycling as they just look at the flow or return temp and turn back on after it drops by so many degrees.
I suspect the minimum output is more important than the maximum output oversizing. Can you re-run some of these graphs, but use a “minimum sizing ratio” for the X-axis? (the ratio of minimum measured output compared to maximum measured output?
Thank you for doing this analysis since it looks like it will help everyone’s understanding a lot (especially mine). Is it possible that the axis labels are swapped on chart 6?
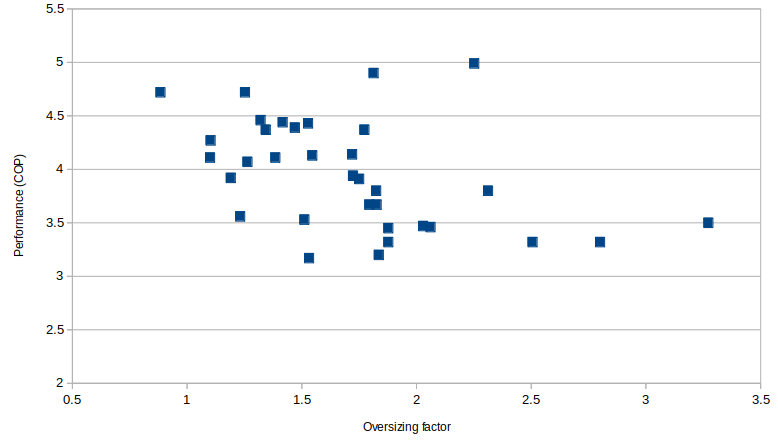
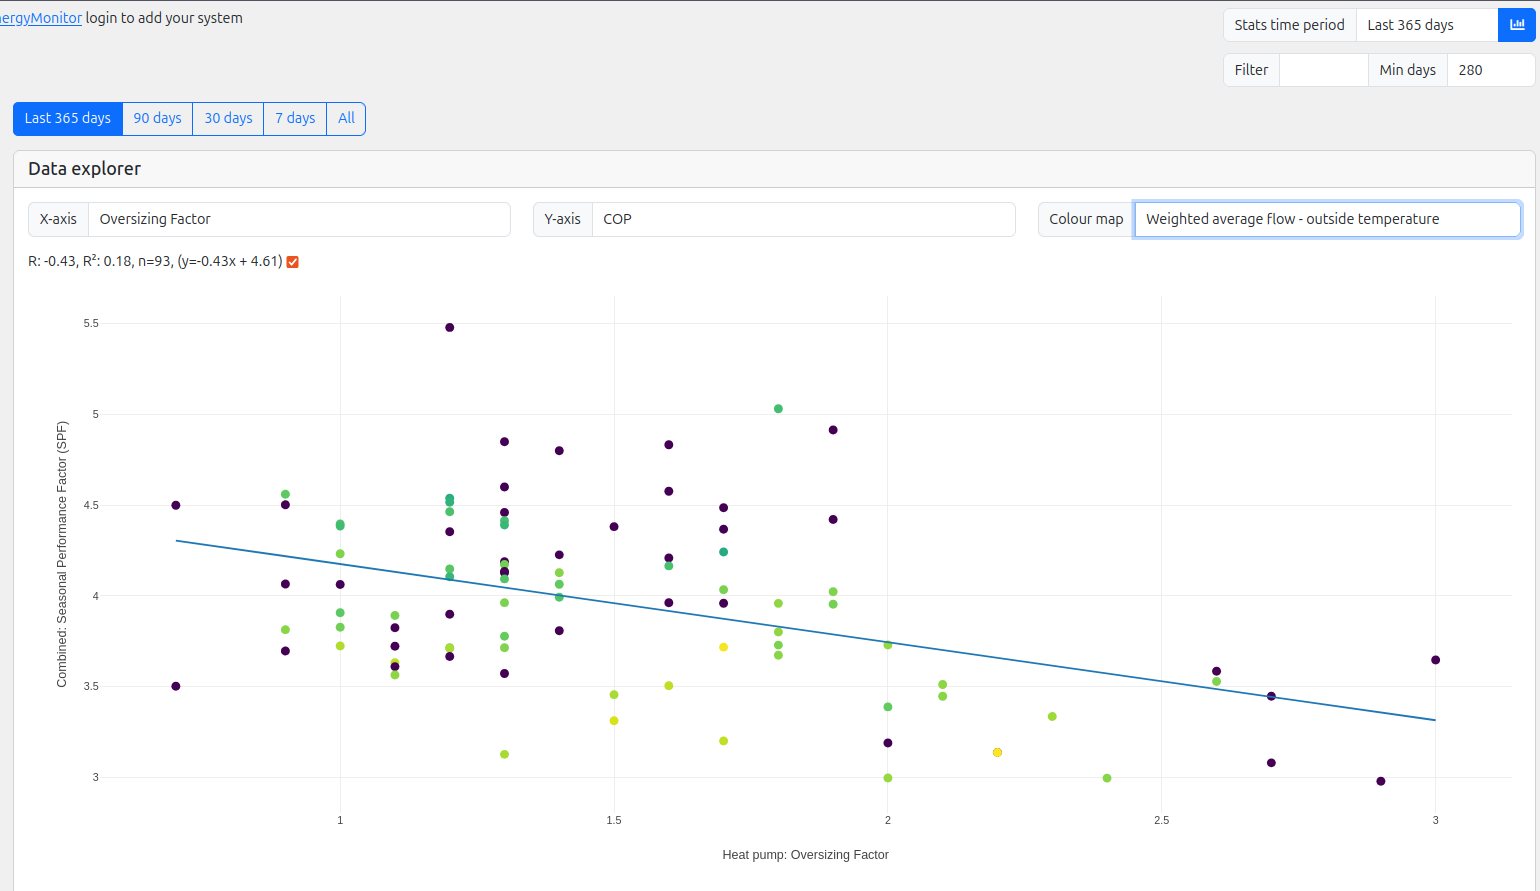
I’ve been though all the systems on HeatpumpMonitor.org today updating the measured heat demand figures and max outputs of the vaillants under defrost conditions in particular. There are now many more systems with an oversizing factor calculated. Im going to change the term “oversizing factor” to “margin factor” as it seems that the data does support the case for a reasonable margin factor on an accurate heat demand assessment! Having a margin of 1.4x is probably not oversizing but more right sizing (make, model, unit specific caveat).
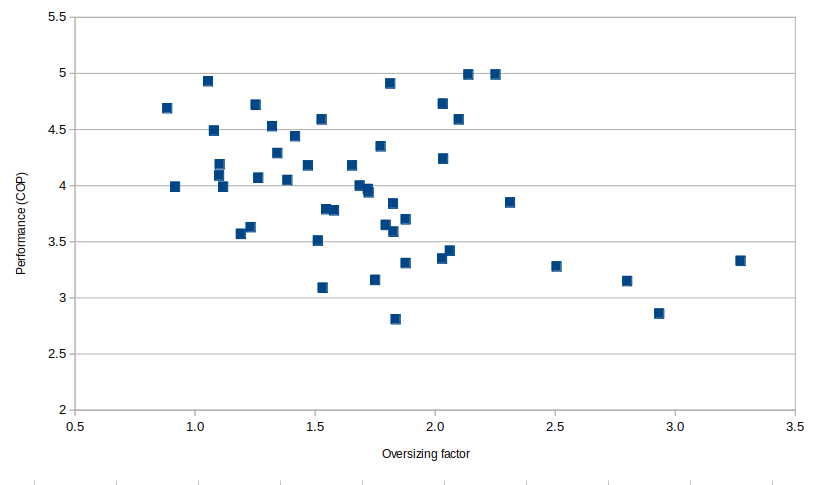
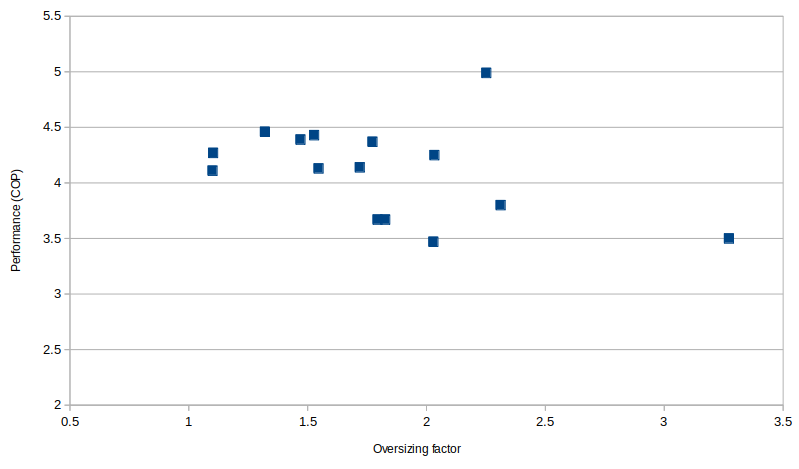
This is the simple oversizing factor vs performance graph (acknowledging that apparent trends in this graph can be misleading, especially for some makes and model of heat pumps. E.g our experience in the Is an oversized Daikin really a problem? - #18 by TrystanLea thread).
I believe it’s important, in the case of Vaillant units, to factor in the relationship between nominal capacity (5kW, 7kW, 10kW etc) which essentially correlate to mean outputs at worst-case conditions, and quoted spec sheet outputs which are peak output not achievable over time during defrost conditions.