I think this issue is common to alI Air Source makes so would value input from anyone with experience and understanding of what happens with heat pumps in Freezing Conditions and if there is any way to set them to minimize the problem. I don’t think it matters too much - for this issue, whether your emitters are radiators or underfloor, mine is a mix of radiators and convector rads. I have enough emitter capacity to run it at 38c and get the required output at -2c outside.
I’ll start by with my story over last Winter and then go into my understanding of the issues freezing conditions raise as to Heat Pump Sizing.
In late 2021 the local Daikin rep was the only one of 6 people I first contacted to respond, hopefully it is different now. The main issue I felt I had was correct sizing. I gave them a detailed MCS analysis. I calculated my house heat input need at 9.8 kw at -2. We had a very cold sub zero week that Winter so I range-rated my gas boiler to a max output of 11kw and it easily kept the house warm - so empirical confirmation of my theoretical work. 9.8kw is the requirement!
With this data Daikin still wanted me to have a 16kw machine with a low loss header. I talked to two real experts and they both said to go for the minimum size to match my design temperature requirements and no low loss header….so I went for the EDLA 11 = 10.6 kW unit. Daikin also insisted on a Volumiser of 20l – again crazy as my system volume is 120litres, but I gave way on that.
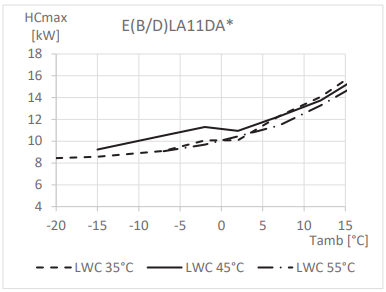
As a final check I asked the sales rep for tech details on the performance at -2c and he showed, but would not give me, a picture from the tech data book. It isn’t generally available but the Daikin forum has a copy which I now have. It shows that the 10.6kW will give close to 9.8kw at -2c – so I was confirmed in my choice.
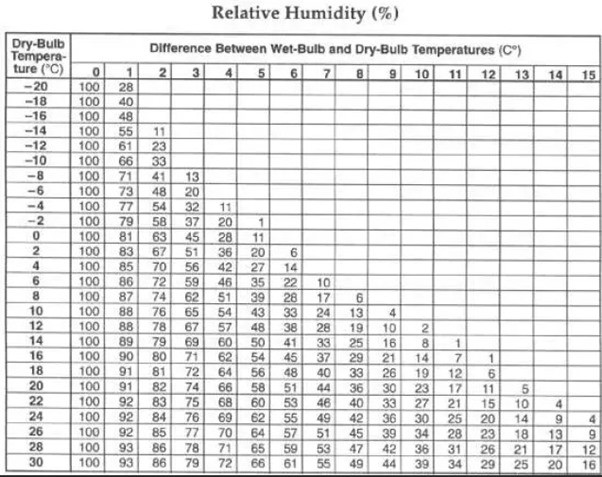
What I now realise is that foggy, damp British Winters usually have a saturated or even supersaturated air at 0c whereas the test data is all done with dry bulb/wet bulb differences of 1 degree. The tests listed are all standards by which I guess all manufacturers have to comply. At 4c and -2c they equate to roughly 80% relative humidity. With this realisation I recently looked again at another table in the Daikin Tech Data Book.
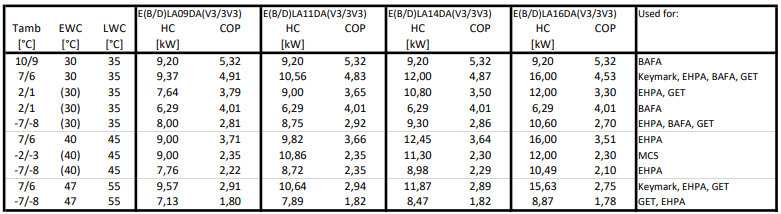
Notice something odd about all four Daikin Altherma model outputs in the second listed BAFA test at 2/1 and 35/30 ? What on earth is this test?
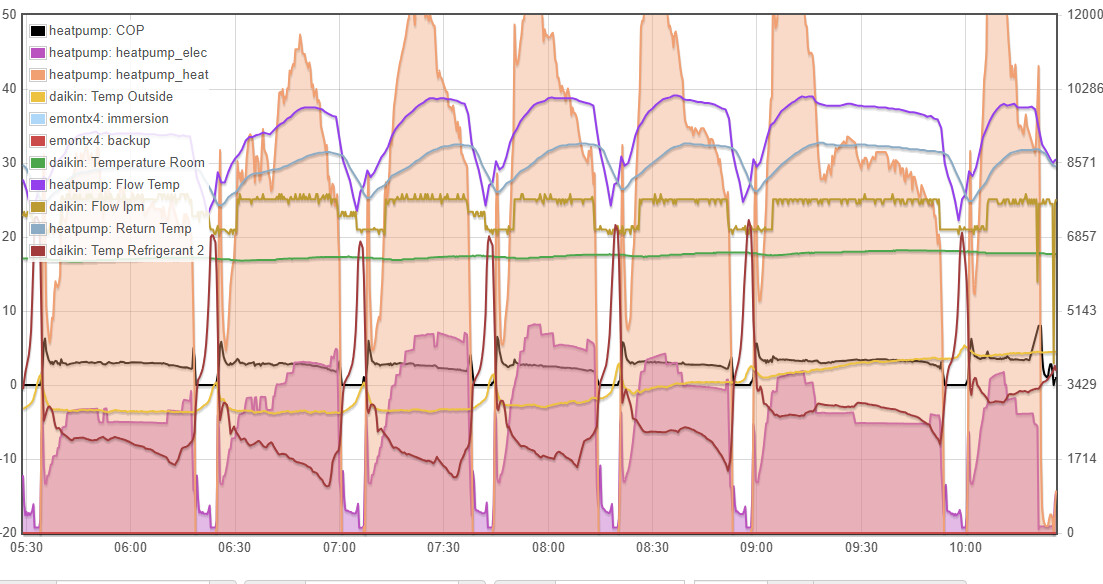
I now understand that the humidity difference makes a huge difference in the frosting up of the unit – at saturation mine has to defrost every 35 mins for 6 mins. At 80% RH that becomes every 3 hours for 6 mins. Which explains why I only get out an average 7.5kw at -2c and flow temp of 38c. I have to supplement the heat in my house for a few days/weeks of the year. The 3kw booster heater should make up teh deficit but somehow does not seem to make any difference at all - curious? So my unit does not perform at all well below zero. Given that the evaporator size is the same with the 11kw and 16kw unit I very much doubt that the ‘bigger’ unit, which with this ‘range’ from Daikin is not really any bigger, would give any more. Having said that my heat pump is working great above freezing and I’m generally very pleased with it.
I am not sure that the Daikin tech guys really understand this – or Octopus, but I suspect that they over size to avoid the problem. Has anyone found more understanding amongst other suppliers?