Im interested in getting a better grasp of how well the monitored maximum output of different heat pumps match their datasheet rated outputs at various outside conditions. In particular heavy defrost conditions. I want to know how much margin is a good idea to build into the sizing assumptions to account for loss of capacity during heavy defrost conditions and will be watching the thread here ASHP sizing for Freezing Conditions with interest.
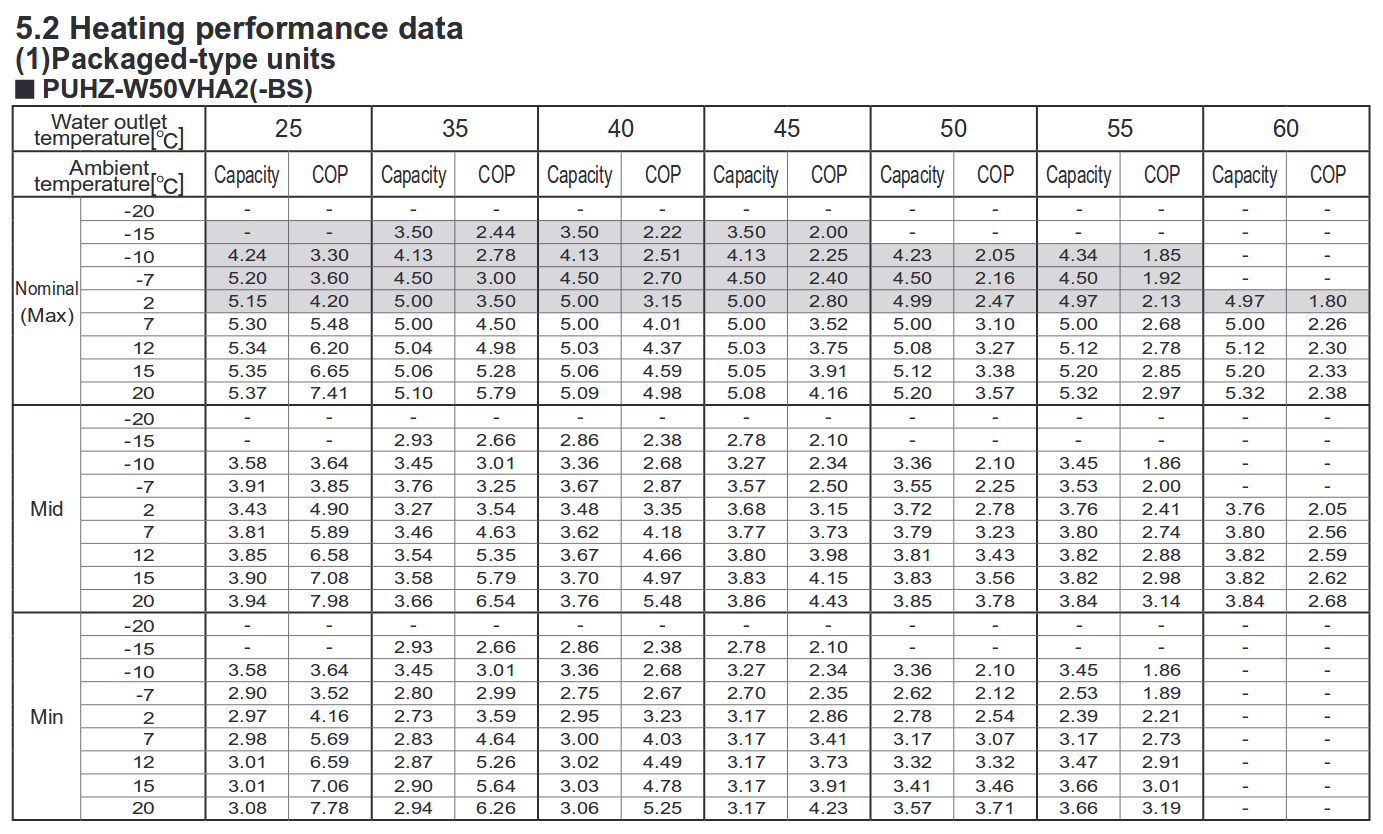
I will post in this thread the results of various tests that I do on my 5kW R410a Ecodan (PUHZ-W50VHA2(-BS) heat pump (I think it was a 2015 model). Although I’ve had the heat pump for quite a few years now, I’ve never really tried to test it’s maximum output over any decent duration of time. The most I’ve ever put in to our house over a 24h period is 74kWh = 3.08 kW and while it often gives 5kW on the DHW cycle, those are quite short periods. On space heating I’ve never really pushed it beyond 3.8kW once it has reached steady state.
Test 1
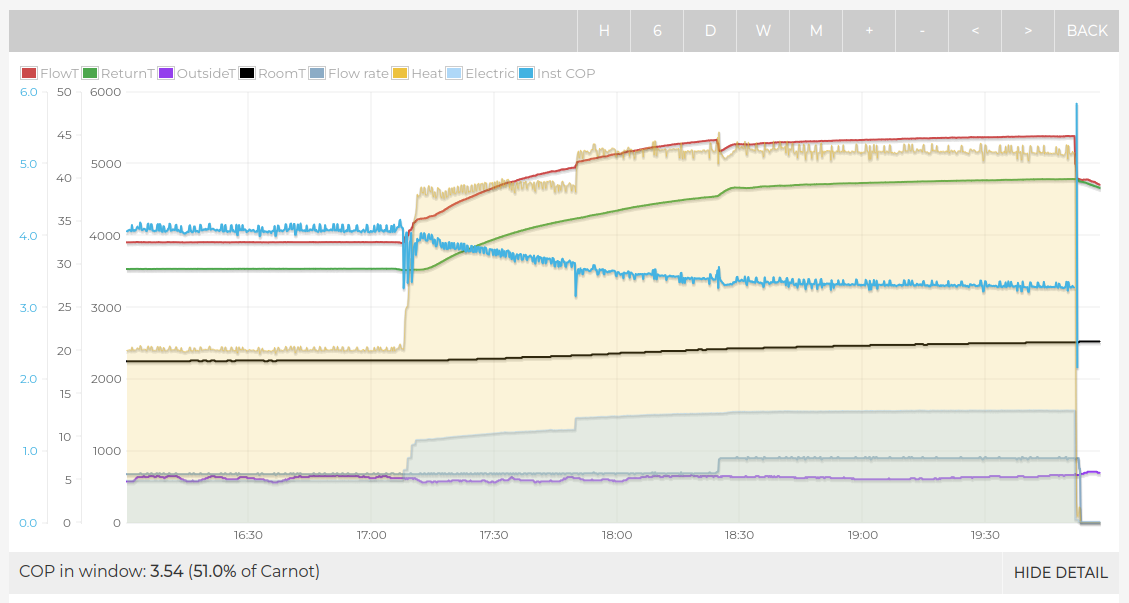
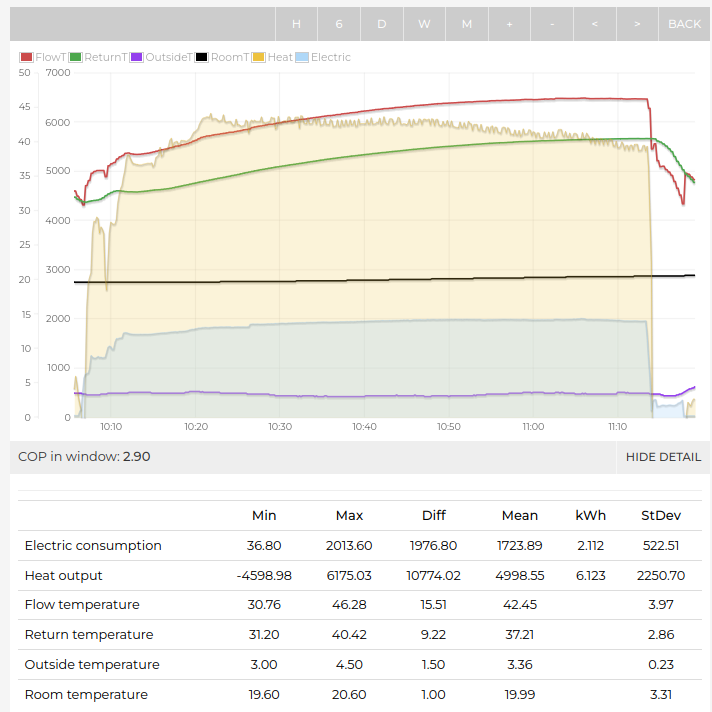
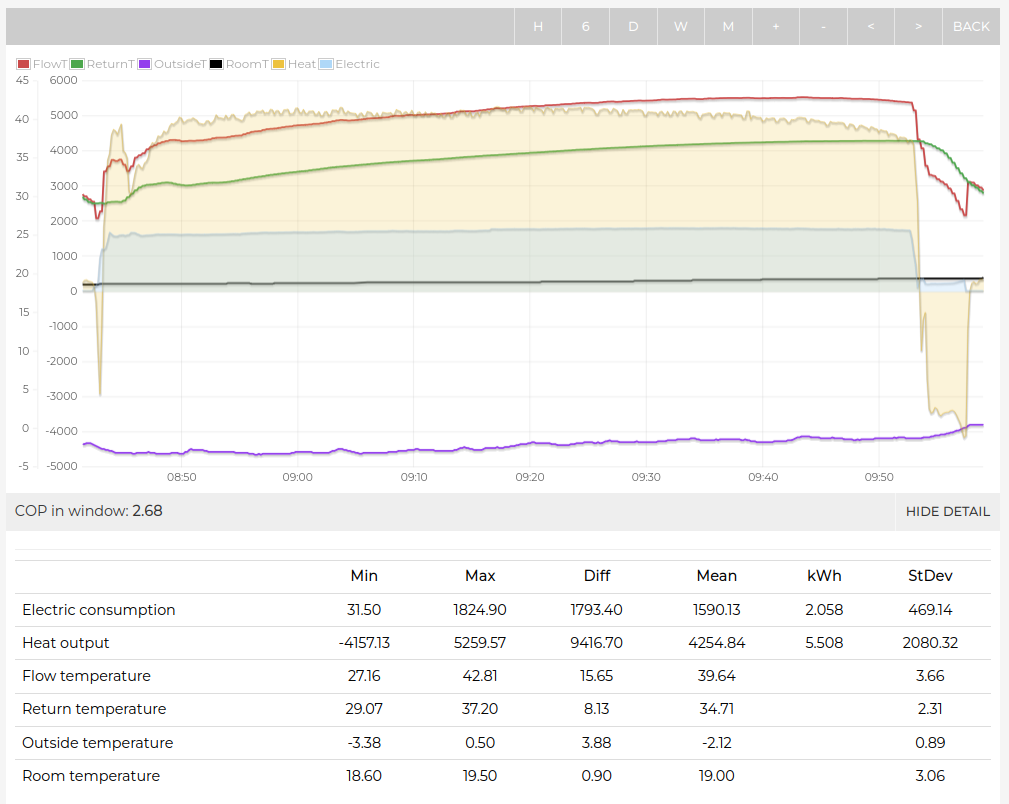
I thought we might get defrost conditions this evening but seems relative humidity was too low. But I did get a good starting point calibration of what the heat pump can do without defrosts:
Outside temp monitored back of the unit: 5.14C
Metoffice relative humidity 74% rising to 85%
Metoffice outside temp 6C down to 3.1C
Metoffice dew point 0.7C
Maximum sustained output over the test period of 2 hours: 5.2 kW (datasheet suggests 5.0kW exactly)
Flow temp at 41C at 17:50 rising to 44.8C at the end
COP 3.35 between 17:50 and end (the full output part)
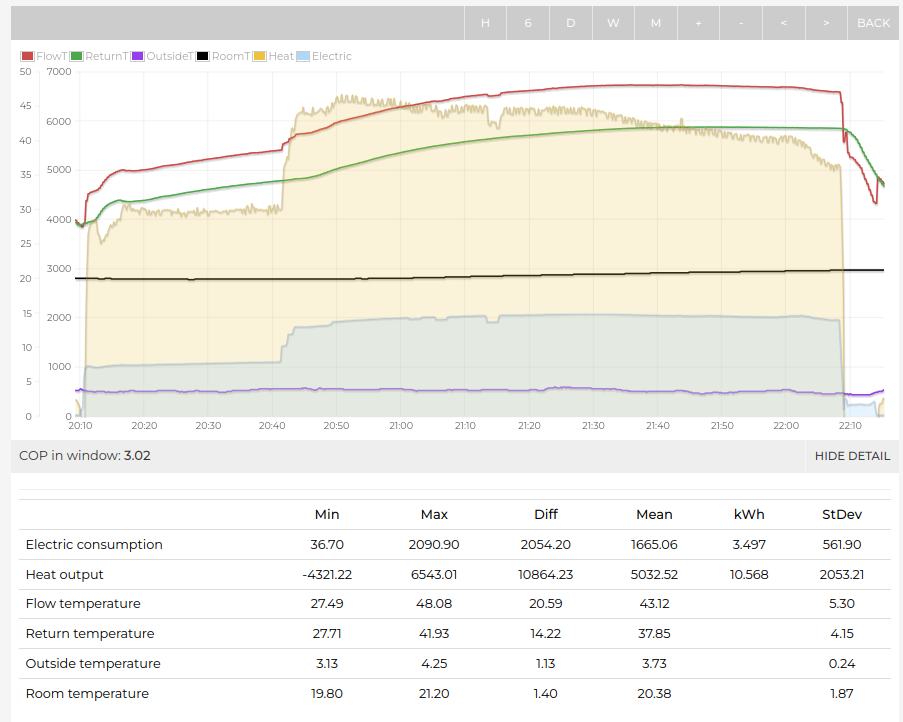
It’s a great way of testing emitter spec, I set the flow temp on the heatpump to 55C fixed target, it obviously couldnt get close to that as the heatpump limits the output, I think it software limited at that point… Compressor should go up to 2.34kw I think according to datasheet , but ecodans software limit max output
If it helps - I put some data on another thread for the last 24hrs from a selection of heat pumps showing rapid defrosting…some similarities in min cycle time across three brands…
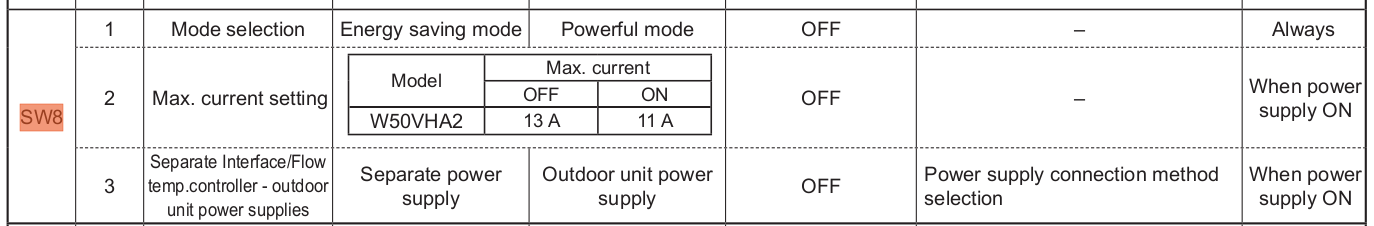
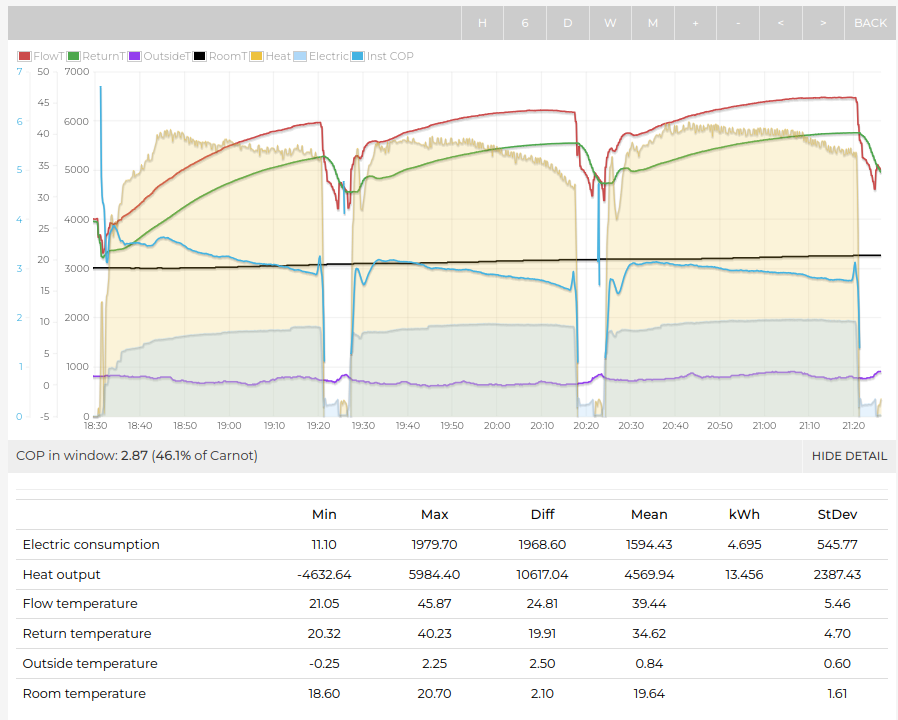
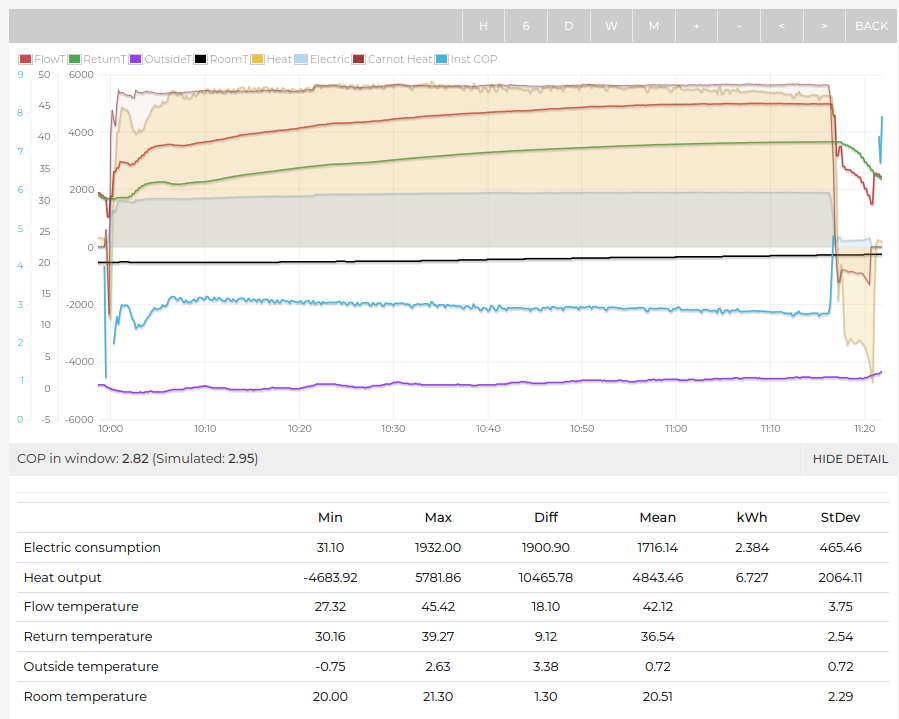
Outside temperature back of unit: 3.1C (rising to 3.7C during the max output period)
Metoffice outside temperature: 3.1C
Metoffice dew point: 2.0C
Metoffice relative humidity: 94%
I started this test setting fixed flow temp to 50C but the heat pump capped out at 4kW (5:30-8:30pm). I remembered that I had set DIP switch SW8-1 to Energy saving mode over a year ago and had thought I had noticed this low capping before. The unit is quieter in energy saving mode which is also a nice benefit. It seems the energy saving output cap changes with outside temperature.
With SW8-1 back to Powerfull mode, the compressor immediately started ramping up ~8:30pm. It went all the way to 6.4 kW of heat output which was really a suprise, I have never seen it go so high before, but then I dont think I’ve ever tried to push it this high…
It sustained an average of 6.2 kW over an hour at peak!
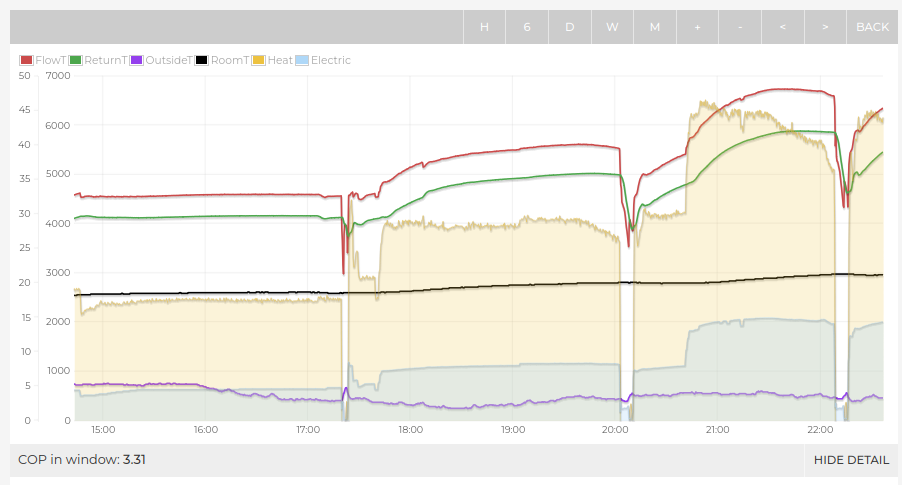
Zooming in on the period, including the defrost at the end the average heat output was almost exactly 5kW and a COP of 3. Which to my surprise actually agrees almost exactly with the datasheet for these conditions…
The test was not really long enough to be that conclusive as it would have been good to have several defrosts and max output for the full duration. The time between defrosts of 2h seemed quite long. Im sure I’ve seen more often than that, perhaps the humidity was not quite high enough.
Will hopefully get more results over the coming week.
The datasheet suggests that capacity should be 5 kW at 2C ambient and 4.5 kW at -7, so about 4.94 kW at 0.84C. So ~7.5% less than the data sheet output in this test.
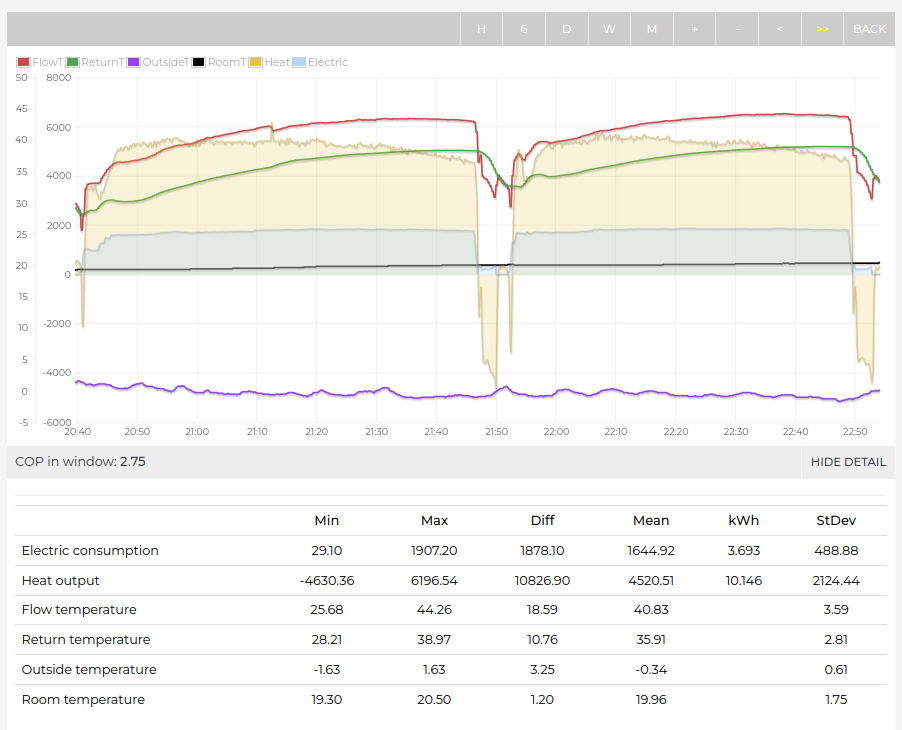
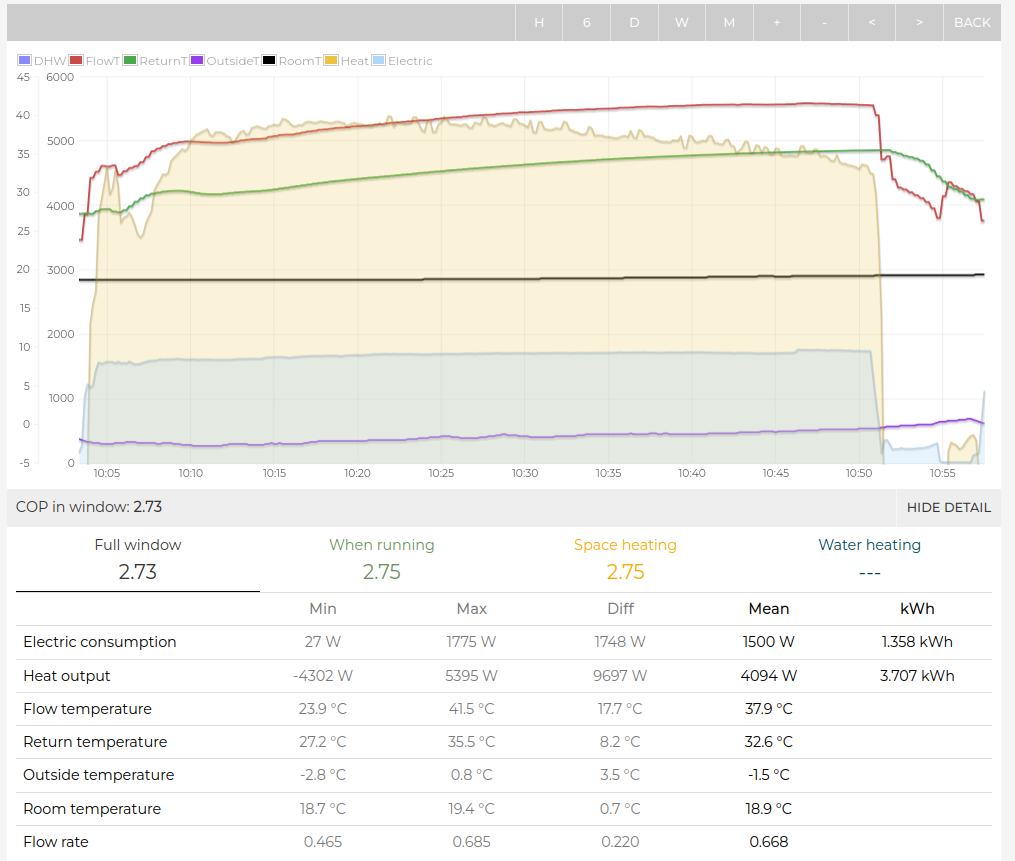
Sadly I didnt get more full cycles, outside and inside temperatures were climbing rapidly and so conditions were not stable enough really for repeated tests.
Ideally I think these tests need 4-5 cycles to ensure that the measurements are not reflecting some other transient effect…
Perhaps extending the design margin on this old Ecodan to 20% if sizing on a accurate heat loss is wise.
Luckily the high end of my inferred design heat loss space heating requirement at -3C is just under this at ~3.8 kW: Though we dont seem to ever experience DT’s between internal temps and outside temps of more than 20K…
Caveat of course is that these results are not transferable to newer models based on different refrigerants! This really feels like one of those things every single model needs to be tested on.
Can HeatpumpMonitor.org partner with a test house that tests and validates capacity and SCOP values for the MCS database somehow? It would be great to understand how manufacturers and others e.g at BRE Heat pump testing - BRE Group go about testing max capacity during defrost conditions. I did try and contact BRE but was told this wasn’t something they could help me with… feels like we need to know the right person to speak to…
BRE are currently at the centre of a scandal alongside Keymark, TUV, and some of the Chinese manufacturers.
TUV operate a lab in China that can do heat pump tests and are trusted by BRE to test in accordance with the standards
BRE are a consultancy that can analyse tests and send summaries to Keymark (less all the original test data)
Keymark can produce energy efficiency labels and trust BRE to calculate the performance (without ever asking to see the working)
MCS et al are copy paste robots that put their name atop the other people’s homework
Problem comes when the TUV lab doesn’t follow the EU test, BRE doesn’t identify this and miscalculates performance, and Keymark issues false seasonal performance/capacity figures.
It’s unclear at this stage just how the same unfortunate mistakes kept getting made that kept resulting in performance errors in favour of these Chinese manufacturers. (i.e who paid who and who is bent vs who is incompetent)
But…
Poland got annoyed enough at this to have recently excluded the use of anything calculated by BRE or tested in China from government grant support.
I don’t think you’ll be hearing anything from BRE on how the check this stuff
There could be some educational fallout from this though in terms of the variety of ways the tests work and can be manipulated and indeed outright cheated. These may disproportionately affect efficiency at higher ambient/part loads AND capacity around 0 from my understanding.
I’d be asking the Polish governing bodies. They know enough to have acted unilaterally on this one.
Thank you Marko. That’s interesting to hear, sounds like a bit of a mess then!
Do you know of any UK universities doing any independent work on this? I know Salford have the capability for a climate controlled test environment with their energy house. I should probably get in contact with them?
Finding the climate chambers and any “on side” employees there would be useful I think.
Salford have one and may be open to talking - though too much of their work may be secretive paying clients rather than publicly funded/academic work.
Octopus have one but I doubt they’d share insights any more than they don’t share any of the performance days being collected from their own installs.
SP / Rise in Sweden have one. Probably quite a few doors around Europe and working with premium manufacturers who might be more open to sharing data by virtue of having nothing to hide.
I wonder where the automotive industry tests stuff. They must have nice climatic chambers too!
I’ll try to make contact with Salford. I have actually visited there twice with CarbonCoop and they did seem quite keen for project ideas and collaborations. This was a while back now though.