Following on from Adam’s HeatGeek video https://www.youtube.com/watch?v=RlcvncWvNUQ. Im wondering where we are on the question of the accuracy of Vaillant’s inbuilt monitoring vs results from MID approved electric and heat metering? Im not familiar enough with Vaillant’s inbuilt monitoring to have a clear view either way, but get the impression that there’s quite a bit of variability?
December 2022 suggests under reporting by Vaillant?
Heat Meter COP: 3.35
Sensocomfort COP: 3.26
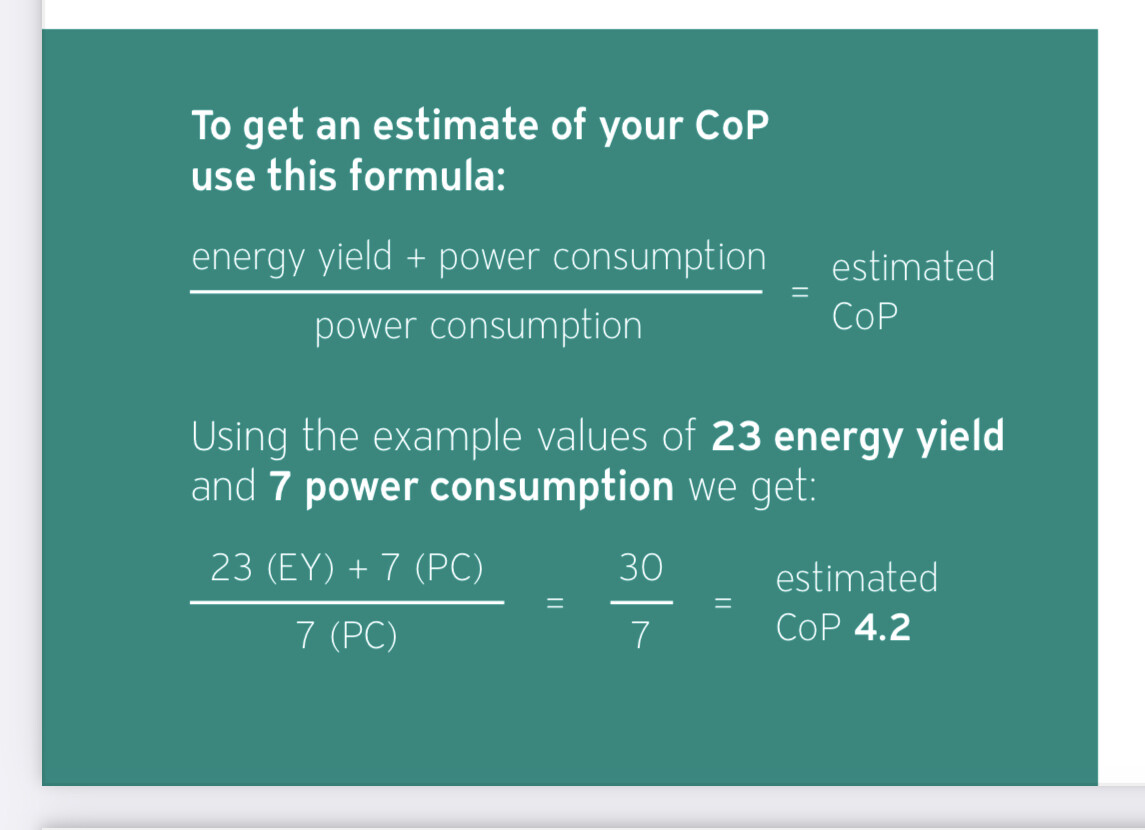
Controller Working Figure: COP 3.2 heat / 2.4 hot water – so hot water is 30% of our requirement, so an overall Working Figure of 3.0?
April 2023 suggests over reporting?
Sensocomfort Heating: 4.9
Sensocomfort Hot Water: 3.2
Combined 4.4?
Heat Meter COP: 4.14
Could the hot water heat meter issues be contributing to the lower SCOP using the heat meter in April?
Michael de Podesta also highlighted issues with his Vaillant app, in his case under reporting SCOP siginificantly The MyVaillant App: a review | Protons for Breakfast 2.83 from the vaillant app vs 3.33 from MMSP
Adam’s own system is under reporting on the Vaillant inbuilt monitoring as well.
There are a lot of Vaillant systems on heatpumpmonitor.org now with both sets of monitoring so we should be able to get a good idea of what the variability looks like?
Do the errors all come out in the wash perhaps as a mix of under and over reporting? The overall result that Adam reports of a SCOP of 4.02 including hot water across all of the systems is certainly in-line with what we are seeing at the higher end on heatpumpmonitor.org and @glyn.hudson and my own experience with our own systems. The key being low temperature design, tuned controls and all of the other factors that are covered in the HeatGeek training as Adam highlights but it would still be great to understand what differences there are between monitoring results so that we are as robust in our findings as possible…
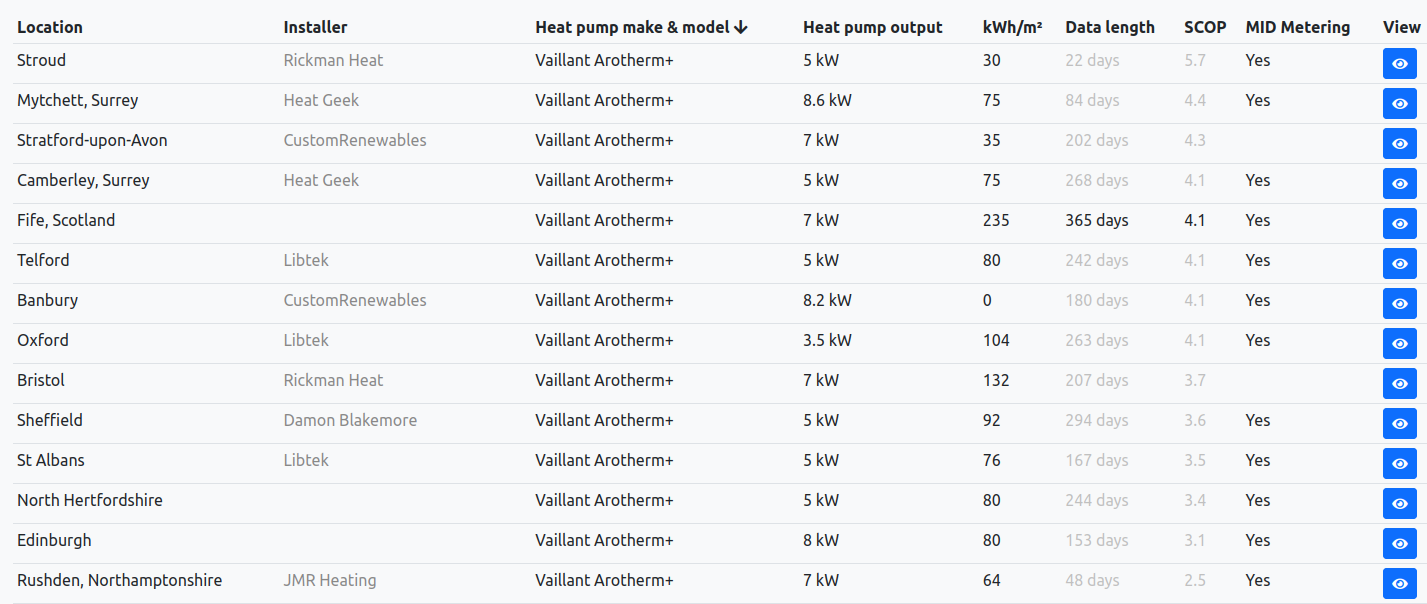
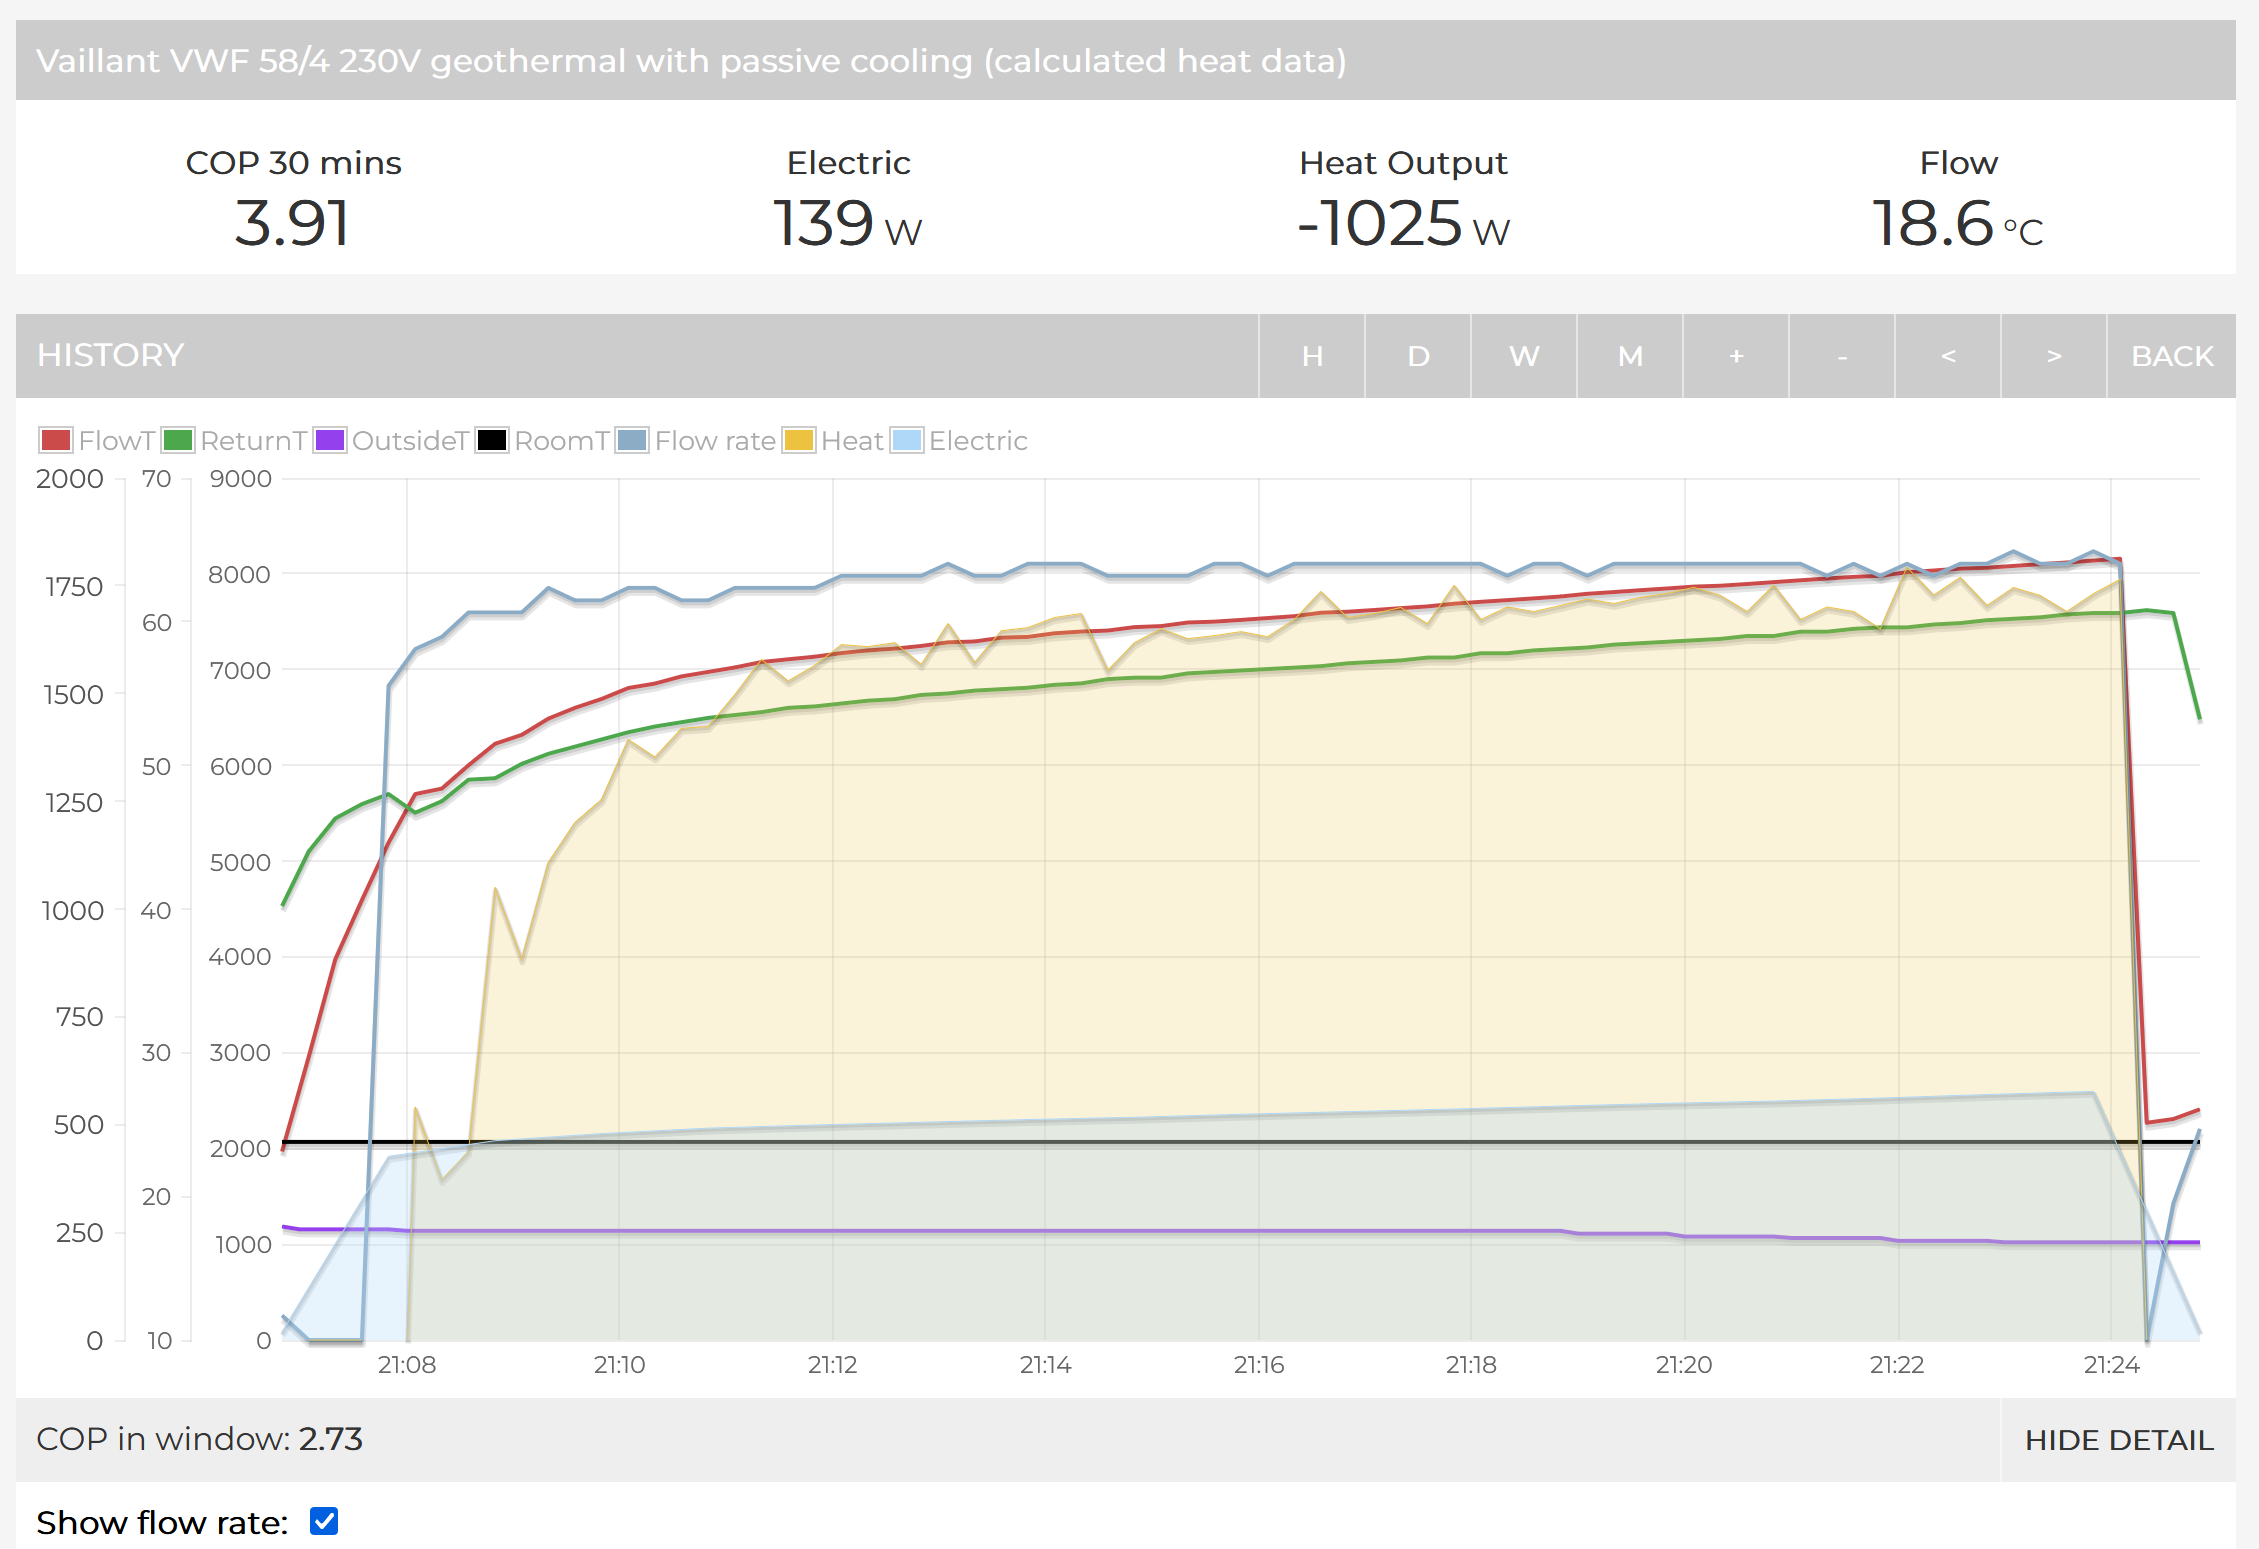
I’m seeing quite some difference between calculated heat/cooling and the heat reported by the unit.
If you like, you can also take a look to the data, started logging since yesterday: http://els23.dyndns.tv:8888/Energie/app/view?name=VaillantVWF584230V
This one is using the calculated heat based on flow rate and delta T.
I also have quite some feeds opened publicly, like the reported COP by the Vaillant unit.
I will try and have a more detailed look at this later.
But I know that the heatgeek data comes from the controller working figure.
I know this cos my install is one of theirs listed on the graphs and they emailed me and asked for the readings (and obviously they then emailed all end users for their figures to get this info).
Yes, working figure from the main ASHP controller is the reported COP for the period chosen, ie month or since install.
My blog post has quotes from Vaillant how they describe this ‘estimate’ and how to get this from the controller.
Interestingly from Vaillant…
" A large number of factors influence this estimate, e.g. the type of heating installation (direct heating mode = low flow temperature or indirect heating mode via buffer cylinder = high flow temperature). This figure may therefore deviate by up to 20%."
There is deviation in the reported figures between working figure and kWh figures as shown in the article.
kWh consumption and yield figures can be pretty wild. These are the figures reported on the room controller (sensocomfort) and in the new Vaillant app.
I don’t trust these!! Especially the hot water figures.
I look at the app right now now, it says my DWH COP for today is 4.0 (1kWh consumed, 4kWh out)
Heat meter shows 2.9 for this mornings run. (0.85 elec / 2.5 heat)
Don’t want to derail this thread, but can you drop into this thread what variables you used for flow rate, elec and heat out please as i’ve been trying to do exactly this with my ebusd config.
Do you know why the Vaillant controller gives different figures compared to the SensoComfort? Surly they must be using the same sensors to obtain and calculate the data?
I’m currently in the process of fitting a Vaillant heat pump myself for a family member, so I’m about to get very familiar with it! I’ll be fitting full level 3 monitoring and also a eBus adaptor, so hopefully I’ll be able to join in on the Vaillant threads.
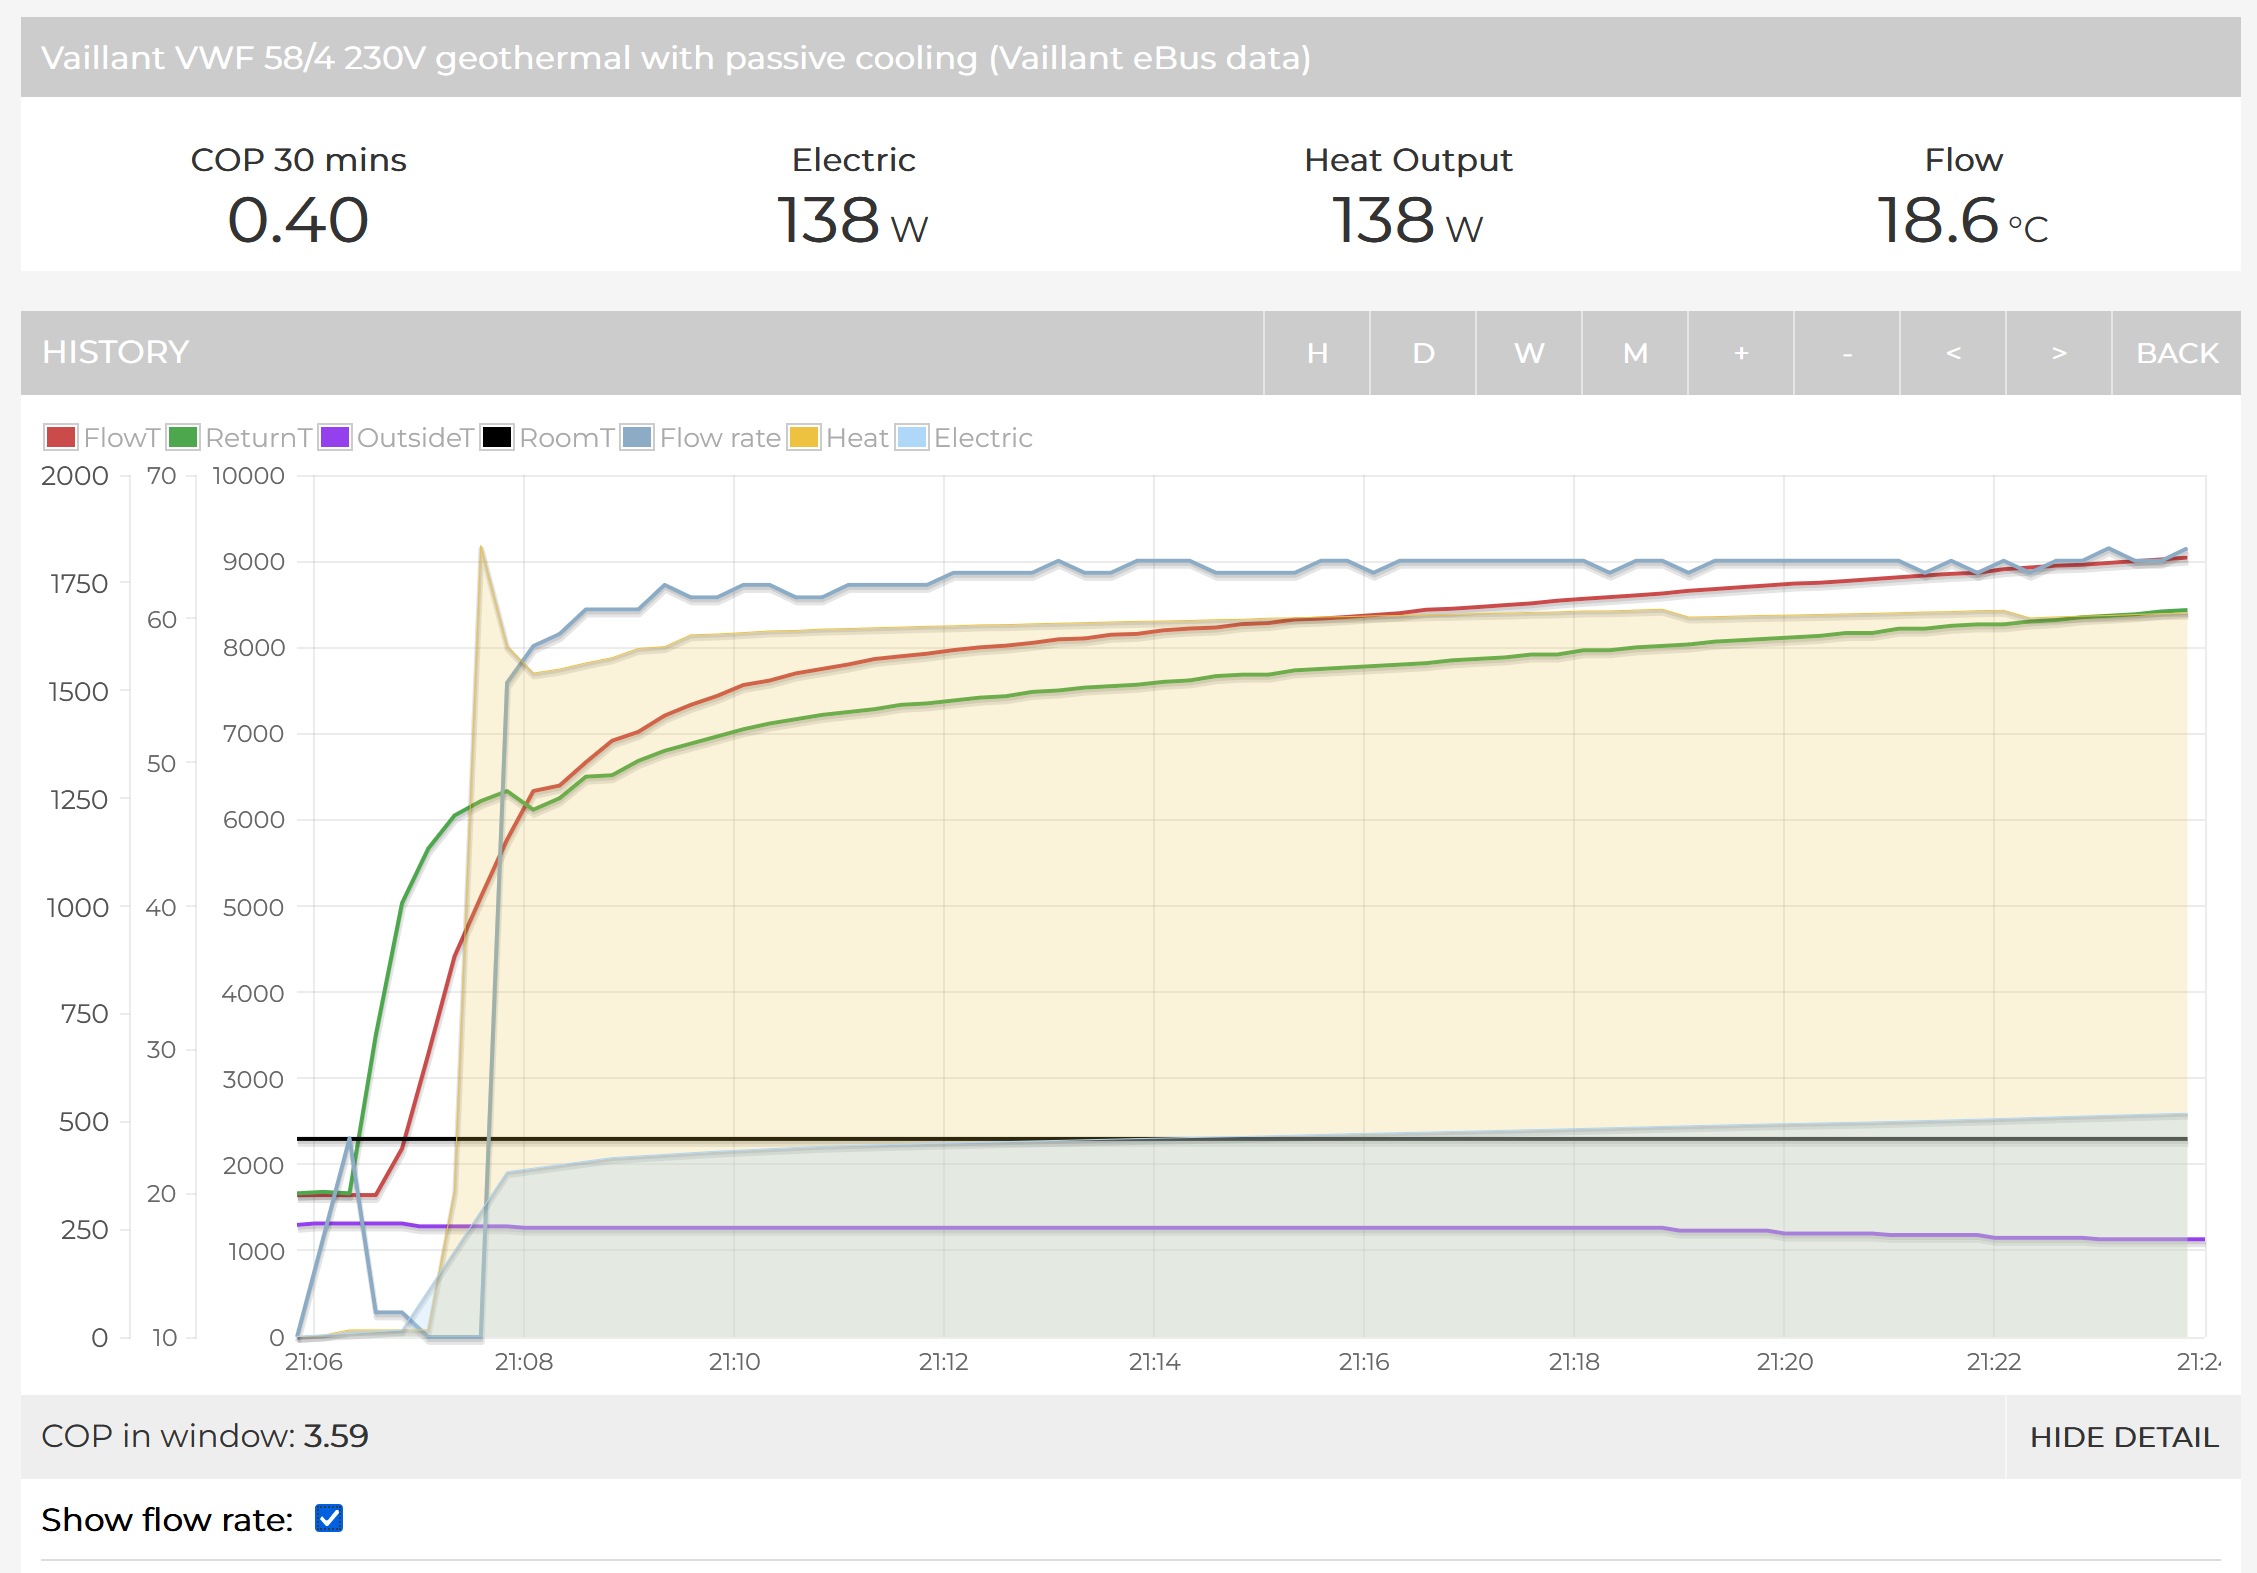
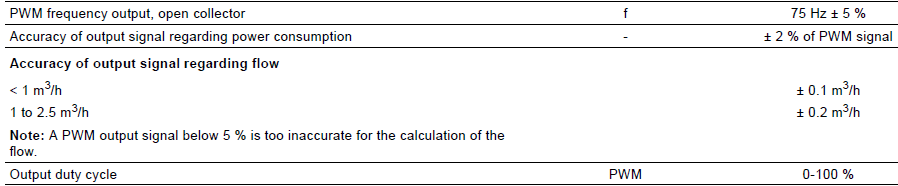
Confirms my assumption that flow info was coming from the pump, couldn’t see a flow sensor in the piping network. Pressure and temp sensors are there and most of them can be read via the ebusd integration.
And then this snippet out of Grundfos documentation here:
Current flowspeed during passive cooling = 1290 l/h, that’s a potential error of 400 l/h (± 200 l/h). I can imagine then the big differences people are saying compared to a MID approved heat meter.
For example during a DHW cycle this goes up to 1800 l/h.
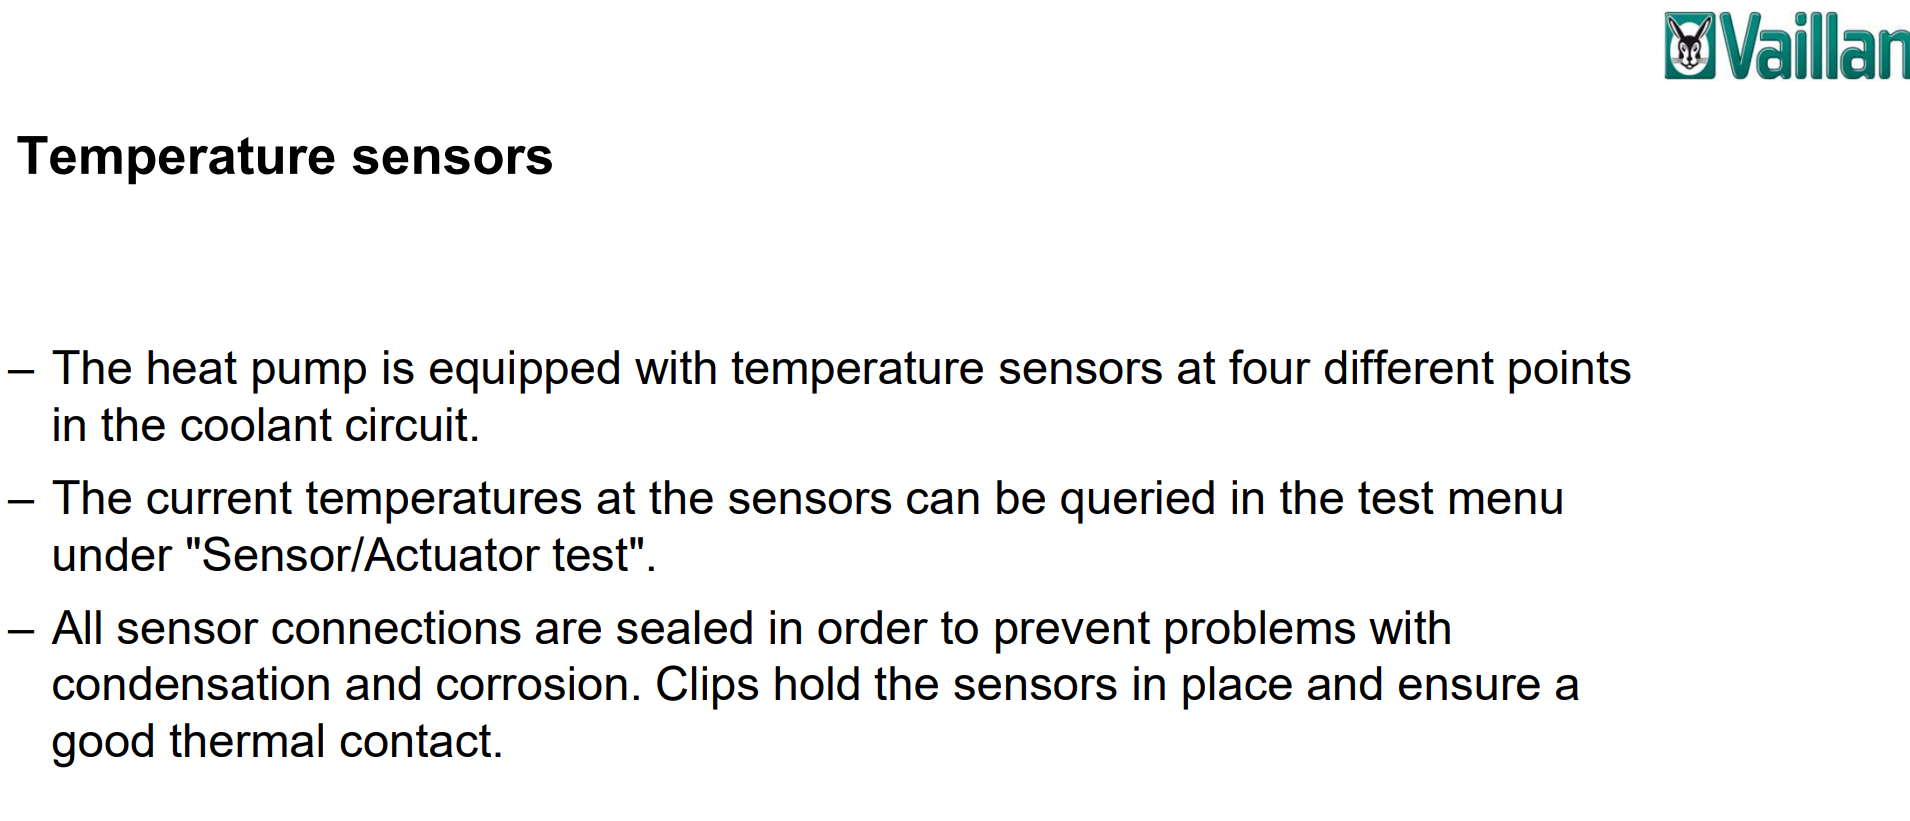
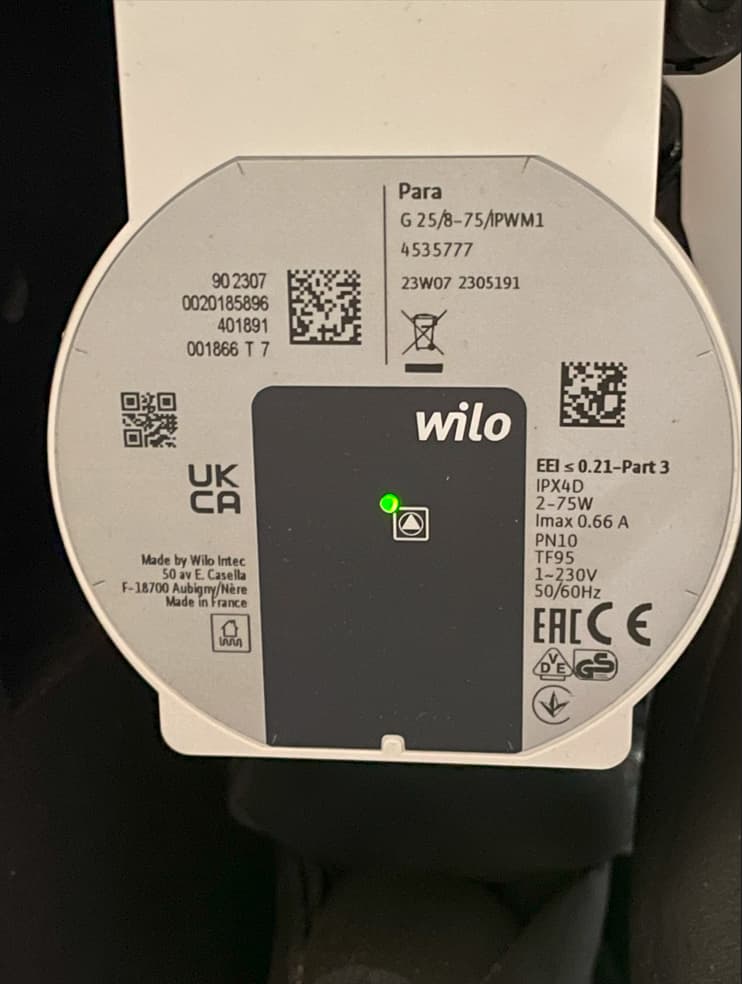
Interesting! That’s a good find. Although it does look like the presentation referring to a Flexotherm heat pump. I was told that the Arotherm+ heatpumps use a Wilo Para pump, but the same principle of flow rate from pump power could (probably) sill applies. I can’t see any flow sensor mentioned in the cut away diagrams in the user manual.
I’m fitting arotherm+ next week, I plan to dismantle the casing and get some good photos of the pump, temperature sensors and other components.
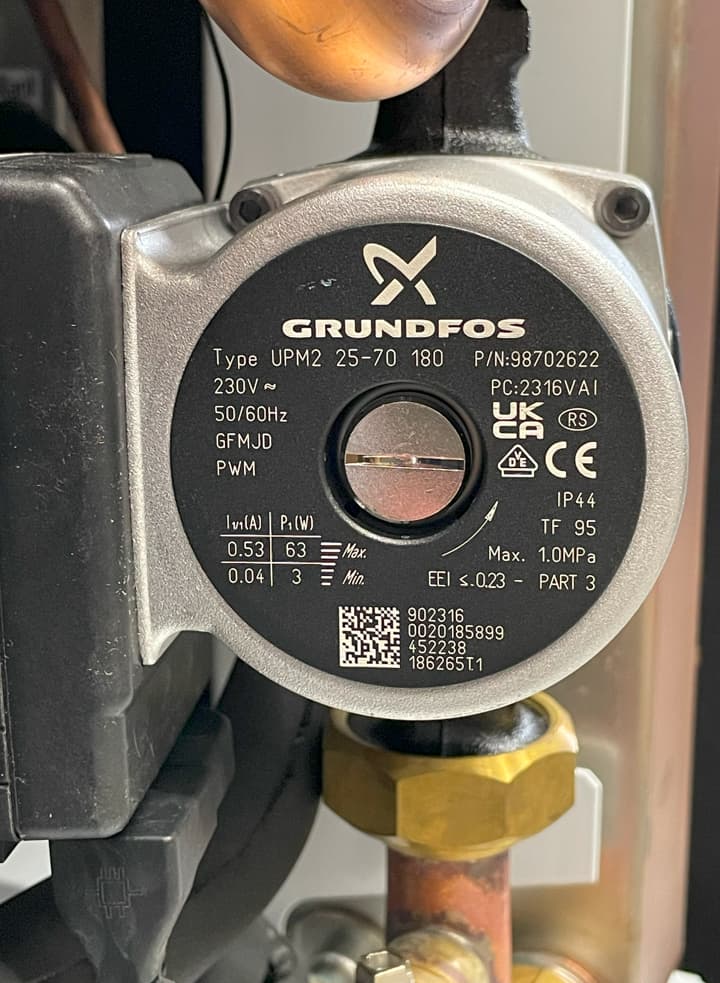
It sounds like the temperature sensors are clip on sensors on the outside of the pipe, rather than using wet sensor pockets that MID approved heat meters use.
I have a geothermal system and the last 2 weeks or so I have the passive cooling running 24/7.
So I get a negative delta T since returnT is higher than supplyT and therefor I get the negative heat for cooling. During a DHW cycle I do get 6000-8000W of heat.
Interesting discussion. I have an aroTherm Plus 13kw unit and use an electricity meter/Sontex Superstatic 440/emonpi emoncms system to monitor energy and CoP. I am naturally interested in the factors that affect the CoP. Over this summer (May onward) I only ran the aroTherm for DHW. I measured a number of variables and ran multiple regression analyses to find which are statistically significant. As expected air temperature is statistically significant but so is the amount of heat energy being generated. The implication is that households lower amounts of hot water may well find they get a lower CoP than those using larger amounts each day. This will likely also introduce variability in the comparisons of different systems run by different households.
Comparing the Vaillant data from the myVaillant app with measurements from my Superstatic 440 and the electricty meter dedicated to the aroTherm, for the two years July 2021 to June 2023, there is a serious discrepency for my system in the measurment of the heat generated and therefore the CoP. The electricity measurments are very close and of no concern.
For July 2021 to June 2022 the Vaillant records the Heat as 16,064 kwhr and CoP as 4.5.
For July 2021 to June 2022 my system records the heat as 13,219 kwhr and CoP of 3.7.
For July 2022 to June 2023 the Vaillant records the Heat as 21,045 kwhr and CoP as 5.0.
For July 2022 to June 2023 my system records the heat as 17,780 kwhr and CoP of 4.2.
If the guy on the How to Geek video is relying on Vaillant system data for his comparisons, he may be seeing CoP figures that are too generous by maybe 0.8 if my data are relevant.
(His comparisons with earlier studies may well be comparing apples and pears datasets).