The figures are from the Supercal 531 heat meter display and the electricity meter dedicated to the heat pump system i.e. arotherm and control electronics. The electricity meter excludes power for the house circulation pumps.
I don’t think Vaillant are ‘inflating’ their results. They do present a rather unusual figure they call Environmental Yield (EY). In reality I think they must measure electricity used (Power Consumption) and measure Heat Generated by some means and subtract one from the other to get EY. If so the formula Vinny shows is correct and EY is the renewable heat generated from the air. The interesting question is how do they calculate the Heat Generated as it is about 20% higher than measured on my Superstatic 440/Supercal 531. Does anyone know specifically how Vaillant measure the Heat Generated?
As above, they are getting their data from the heat pump controller (working figure), not the myVaillant app.
My comparisons shows the working figure a little closer to reality, but still a little off compared to heat meter / sdm120 electric meter.
What to me looks like a ‘fudge factor’ is any electrical power used by the outdoor unit (fan?) that is lost to the environment and not transferred indoors should be subtracted from the top line of the expression.
It’s probably not much, but it will inflate the CoP.
I used the myVaillant app data because in my case they look more realistic than the Working Figure (WF) in the Heat Pump controller and I could get month by month data quickly. So for example the WF for August to date is 4.1 and the myVaillant app Energy Efficiency (EE) is 3.7 (after correction CoP is 3.5). The CoP from the Superstatic 440/Supercal 531 Heat Meter and Electricity Meter reference to date for August is 3.0. The app’s Energy Efficiency is again about 20% higher and the WF is about 37% higher than my reference system.
I think maybe one of the differences between the WF and the EE is that the myVaillant app takes into account the electricity used in running the control electronics, as do my reference measurements and the WF perhaps does not. Still leaves my Vaillant’s CoP estimates substantially higher than the reference.
Agreed, they must be calculating environmental yield from a total heat output figure based on mass flow rate: flow and return temperature sensors and flow rate. At least that is what would make sense given the sensors in the unit. They are measuring the flow rate using a vortex flow sensor, this is what it looks like from a Vaillant system that @glyn.hudson is in the process of installing:
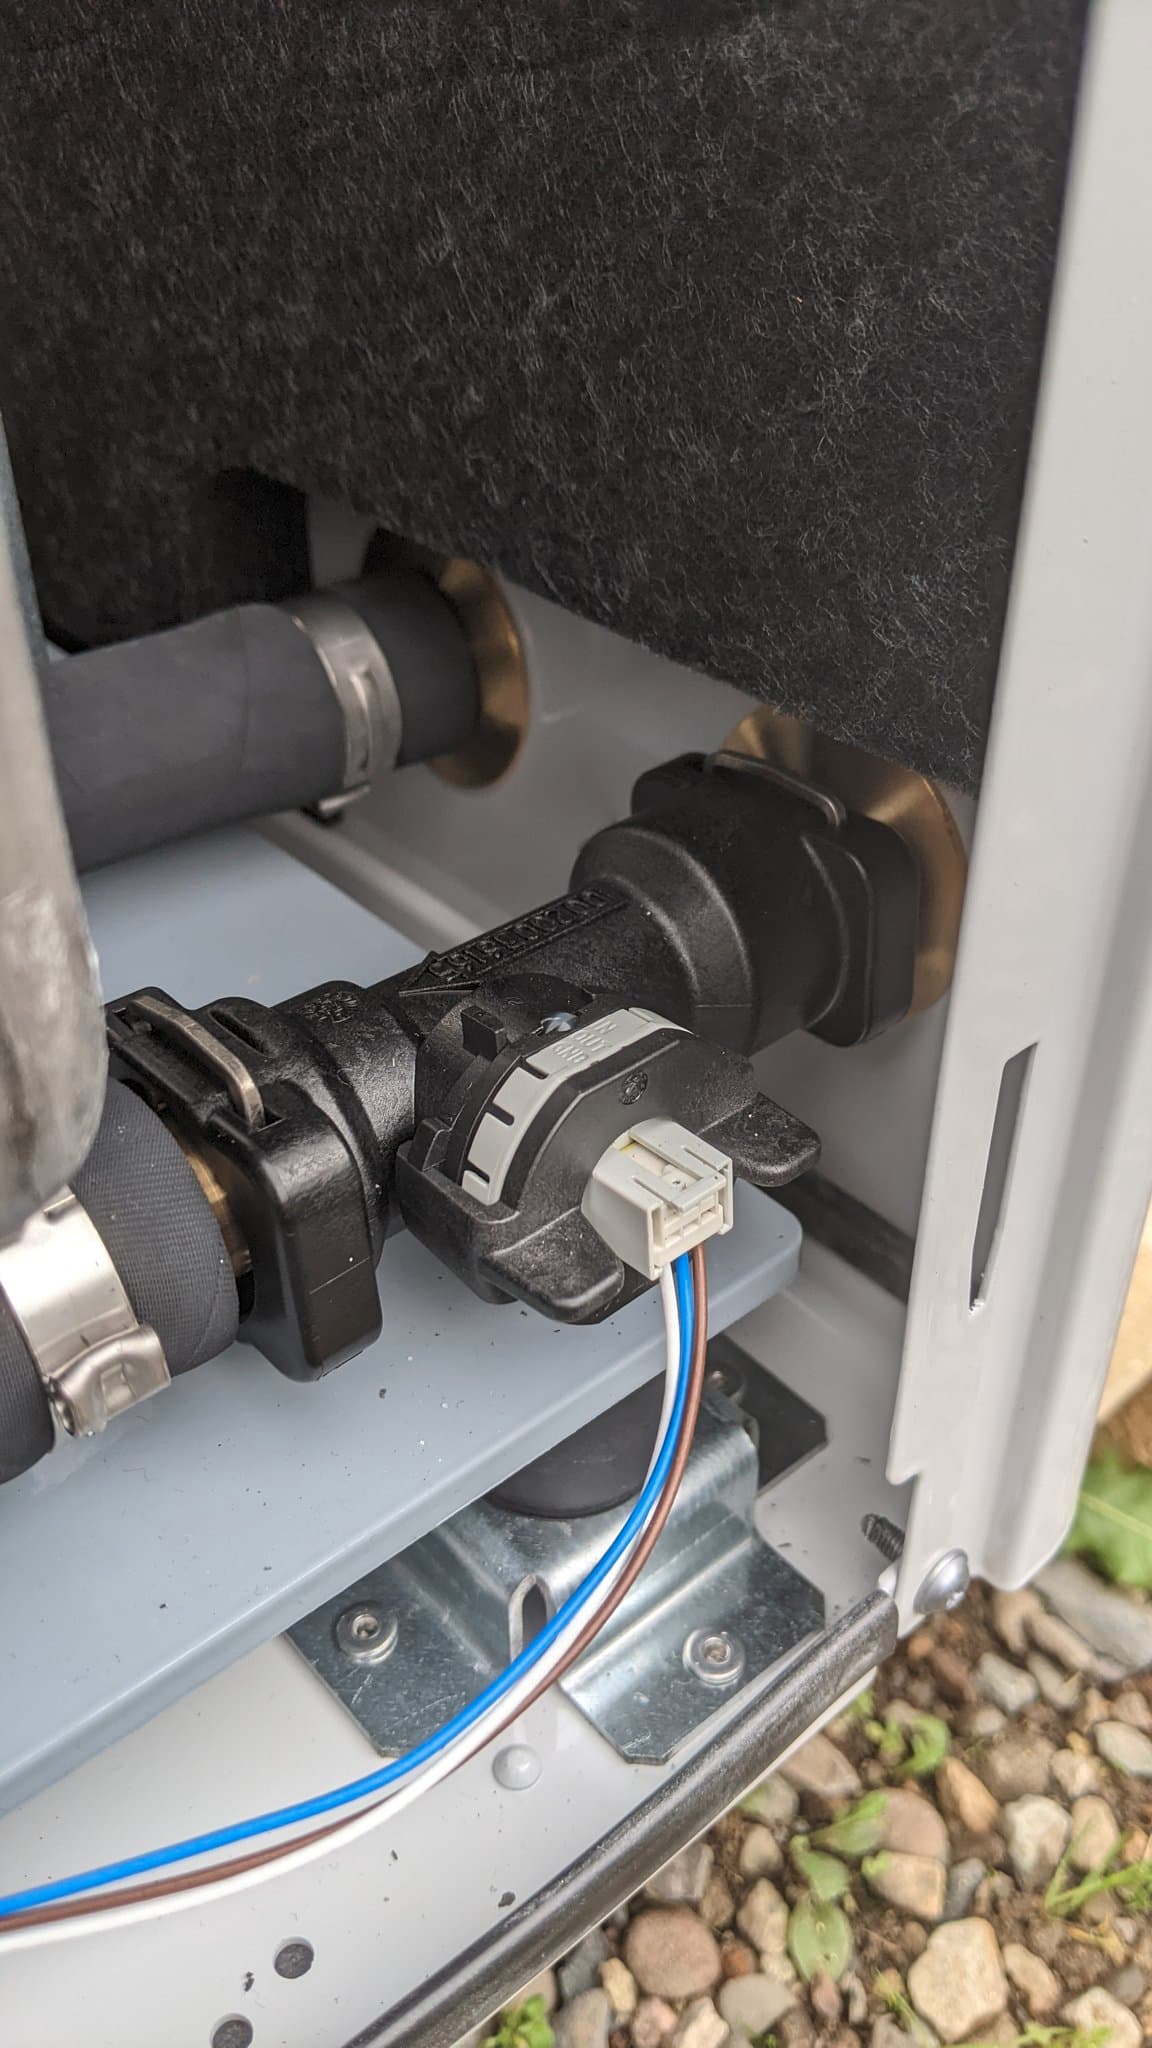
It looks like it is one of these: Vaillant 0020045923 Sensor - Vortex DN15 GC No: 47-044-66 looks like it’s Vaillant own brand (I thought it would be a SIKA but that’s not the case).
Im guessing the error’s that we are seeing are as a result of something simple such as calibration error, assumptions about glycol content? slight errors in the temperature sensors. Perhaps integration errors resulting from frequency of sampling…
The complicating factor here is that there doesn’t seem to be much consistency at least as far as I can see so far… @PjH your electricity consumption results seem close but others get quite large discrepancies… the app and the working figure on the controller seem to be quite different and inconsistent again, @Zarch’s reports a higher COP vs the working figure while yours @PjH reports a lower COP… ![]()
It would be interesting to see the performance specifications for the Vaillant flow meter and associated equipment compared with the Superstatic 440 / Supercal 531 system. The flow sensor is certainly inexpensive so is this reflected in measurement variability?
The point about the lack of consistency in the Vaillant data from different users is well made but it also underscores concerns about the reliability of using Vaillant controller or myVaillant data when comparing CoPs from different systems.
On their myVaillant data section there is a warning that “Energy consumption, energy yields and efficiencies are extrapolated based on various parameters. The actual figures may differ substantially in some cases”.
I have recorded the VR720 and Unitower controller data every Monday for 2 years.
My experience is that the controller, the sensoComfort VR720 and myVaillant app are all reporting slightly different data. It would be very nice if Vaillant would publish exactly what they report, how and where they measure key parameters and where they calculate the outputs.
My initial VR720 had data in “Last month”, “current month”, “last year” and “current year” on install, which then incremented (except “last year”). Second VR720 (wireless), replacing the initial hardwired version in Feb 2022, picked up the same “last year” figures but the “current year”, “current month” figures all reverted to zero and incremented from there. Clearly there must be independent recording and/or calculation going on on the VR720, but does it pull some historic data from the ebus (and is the controller data zeroed on supply??)
The VR720 “current month” energy usage for heating increases by c9 kwh/month even with heating off. Additionally, the total energy use recorded by the controller is always less than that of the VR720 total “Installation”. This difference increases by c 1kwh per month. The rate of change of difference is less during the heating season, and I would suspect that this is a constant, background consumption of c 1kwh/month for the Unitower electronics showing up. How this works with the “current month” heating increment is beyond me.
As @Zarch has illustrated on his blog, the VR720 yield and controller energy data need to be combined to produce a COP using Vaillant’s approximation. The issues above suggests that this may not be reliable!
So to the app. The new myVaillant app doesn’t control heating any longer on my 3.5 Arotherm+ because I have a cooling resistor installed. Apparently this was due to “an error of logic” and Vaillant will get this sorted in v2.9. A bit off topic, but it does show that Vaillant don’t get their coding right all the time. As to the data presented, it is interesting to note that the daily consumption for heating (with heating off) shows one or two hourly consumption columns on the daily graph. These appear on apparent random days and each day when usage is shown always sum to one kwh over a month, they sum to the 9kwh/month of the VR720 heating figure mentioned above. EmonTX4 monitoring shows no high usage at the periods in question.
For the app DHW results, the energy consumption is the same as the VR720 reported figure, but the environmental yield is not the same as the monthly controller figure by a few kwh.The app daily graph for DHW energy usage occassionally misses consumption on some days and often gets the timing of the usage columns out by an hour either way.
Pays your money, takes your choice as to whether any of these data are adequate for an accurate COP. Given that I can’t see any way of putting in a heat capacity to the controller or VR720, the algorithms must be making som pretty important assumptions. And the controller and VR720 may be doing things differently.
I’m saving up for a heat meter.!!
How similar is the data for other brands of ASHP vs MID meters?
Might there be any interpolation being done by Vaillant?
The myenergi app does interpolation when it hasn’t yet captured the full data for a day from the devices. If you compare the data available from their API it’s often a little different due to rounding.
One probably shouldn’t rule out the possibility of the MID meters not accurately recording heat delivery either.
Just because, in a lab, under ideal conditions, the meter passes the accuracy requirements does not guarantee that, as installed, it is true.
(for heat metering, not for electricity metering)
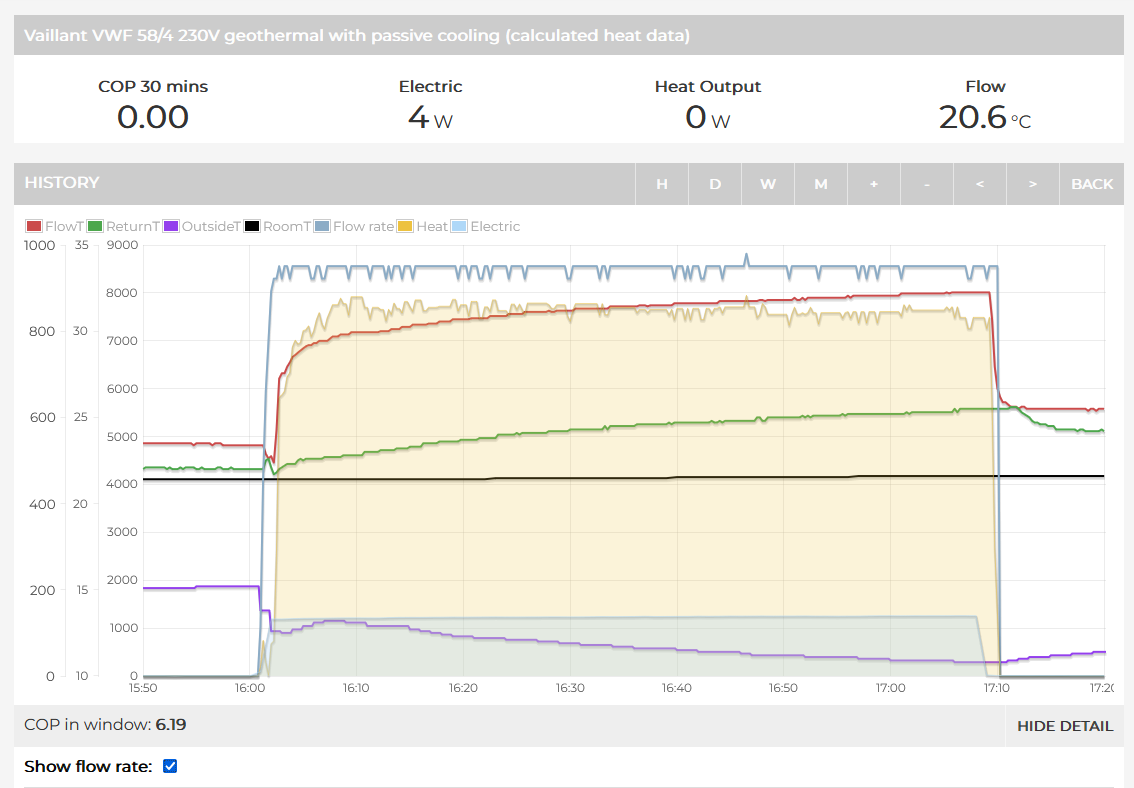
Starting to get colder (average outdoor temp last 24h was 7 deg C) and the first heating cycles occur:
Calculated heat data:
http://els23.dyndns.tv:8888/Energie/app/view?name=VaillantVWF584230V
Reported by emoncms heatpump app
E: 6.3 kWh (FYI true delta from the SDM120 kWh import reading: 6.33 kWh)
H: 36.8 kWh
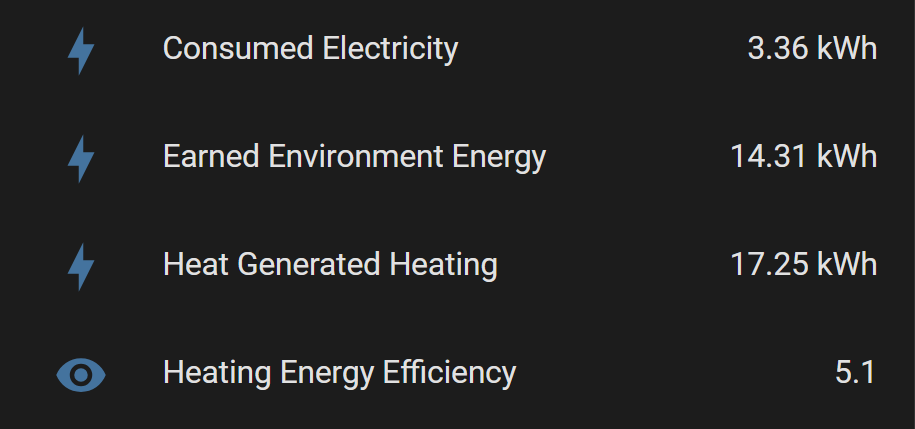
Data from Vaillant eBus:
http://els23.dyndns.tv:8888/Energie/app/view?name=VaillantVWF584_ebusd_data
Reported by emoncms heatpump app
E: 6.3 kWh (FYI true delta from the SDM120 kWh import reading: 6.33 kWh)
H: 12.9 kWh

ebusd hmu YieldHcDay energy 14.3 kWh
ebusd hmu YieldHwcDay energy 7.5 kWh
ebusd 700 YieldTotal energy4 23 kWh
ebusd 700 PrEnergySumHc energy4 4 kWh
ebusd 700 PrEnergySumHwc energy4 3 kWh
ebusd 700 PrEnergySum energy4 7 kWh
COP calculated with Vaillant formula 4.28 average
This is Heating circuit (Hc) and Hot water cylinder (Hwc) together
Individual COP calculated with Vaillant formula Hc 4.575
Individual COP calculated with Vaillant formula Hwc 3.5
Reported by the machine:
CopHc: 5.3
CopHwc: 3.2
Calculated average:
Average Today from the emonCMS Heatpump app:
ebus data: 4.49
calculated heat data: 4.78
I get so many different numbers now… Really curious which ones I can trust…
Who enlightens me :-).
On the other hand, with 6.33 kWh of electricity used and seeing my parents burning 6m³ gas Today and my sister 4.5 m³ of gas. Where you can at least multiply by 10 to get kWh (don’t know if they get low caloric *10.26 or high caloric *11.51, most of Belgium is moving to high caloric but not everyone has switched)
It’s safe to say this is this ground source heatpump is not consuming a lot. Our setpoint is 21°C, which is not low :).
Off-topic but we had a vibration from our Vaillant heat pump - Appears to have been the side of that flow sensor contacting the nyloc nut that’s right under it. You can rotate the whole flow sensor 90 degrees so the connector is on top, takes a little force but the new o-rings are happy with it. I’d advise considering that for yours.
I’m presuming some of the installations will only have a single SDM120 MID monitoring the external unit and won’t have one monitoring the indoor control / pump(s). Would that make enough of a difference? Do the internal components use much power?
Presumably, Vaillant’s figures only include consumption from the external heat pump?

I have my main ASHP power from my consumer unit go through the SDM, then I have go into a henley block to split off and power both the outdoor unit and the indoor controller.
I have to do this because my Mixergy cylinder has an external pump that runs off the controller, so I wanted to ensure that was included.
But if you’re running a standard cylinder, that will just use the pump in the external outdoor unit.
I do have a separate clamp just on the controller itself and in normal running it only draw 1 or 2 watts. So negligible if you don’t manage to include it into the SDM meter.
Correct, Vaillant’s figures will only include the outdoor unit, however assuming there is no secondary pump inside the house the Vaillant indoor controller a tiny amount of power, the biggest consumer is the 9W to open the 3-port valve during DHW, about 9Wh per day! It’s so tiny it can be discounted. Most installs will have the indoor controller connected via a FCU to the main heat pump supply so will be included in 3rd party monitoring.
Monitoring the indoor controller is more significant on other models of heat pumps which have the primary circulator pump inside the house powered by the indoor controller, or the system has multiple pumps.
@glyn.hudson @Zarch Thank you both for the detailed explanation. Much appreciated.
Using Emoncms - graph to compare daily deltas for the ‘electricity_Energy’ kWh figure against those shown in the MyVailant app.
15/12 | 13.2 | 12.9
16/12 | 6.9 | 7.2
17/12 | 5.6 | 5.9
18/12 | 4.6 | 4.8
19/12 | 6.0 | 6.2
I couldn’t spot anywhere to set timezone in MyVaillant app. Perhaps it just uses the address specified in account settings.

I have a freshly installed Arotherm plus 105/6 with a VWZ MEH 97/6 hydraulic station and did quite some investigations regarding the built-in monitoring that I would like to share. First some notes on my hardware setup:
I am reading the eBUS data using ebusd and an Esera USB ebus coupler (eBus Heizung Koppler & Gateways) plugged into a Raspberry Pi using this csv config to decode the data: eigene CSV erstellen und einbinden · john30/ebusd · Discussion #720 · GitHub. It is then being sent to my MQTT broker. I am polling the following measurements every 10 seconds:
ebusd/hmu/CurrentYieldPower - Current vaillant “Environmental yield” power
ebusd/hmu/CurrentConsumedPower - Current electrical power
ebusd/hmu/WaterThroughput - Water flow rate
ebusd/hmu/FlowTemp - Flow temperature
ebusd/hmu/ReturnTemp - Return temperature
I am also measuring the electrical power using a Shelly Pro 3EM; albeit this is for the whole installation. I also installed external temperature sensors on the flow and return pipes (PT100 + MAX31865, manually calibrated in a water bath between 0-100°C to yield zero relative temperature difference).
Using the eBUS values for flow rate, flow and return temperature I calculate the heat power. I also calculate this using the reported flow rate and my own external temperature probes. The eBus queried values (i.e. provided by Vaillant) are piped into emoncms: Emoncms - app view
Here are my observations:
-
Vaillant reported electrical power very closely matches my Shelly measurements. As the power by Vaillant is reported in kW with only 0.1kW increments, I’m using my shelly data instead.
-
The Vaillant “Environmental Yield” power very closely matches the result I get when I calculate heat power using flow rate and (flow-return) temperature and then subtracting electrical power. Most likely this is exactly what they are doing internally. Here’s a graph showing the Shelly electrical measurement (P_el,shelly), reported Yield power (P_yield,hmu), my own calculated heat power (P_heat) and the sum of yield + electrical power. It matches exteremely well. Integrating this yield power over the day gives almost exactly the same value as the Vaillant reported environmental yield energy that can be read off the VWZ device display.

- The graph shows a segment at the end of a heating cycle where we can see behaviour between on- and off state of the heat pump compressor. You will notice that electrical power and yield power drop to essentially zero, but my own calculated heat power does not. Why is that? - That’s because even when the heat pump is off there is a reported deltaT between flow and return of about 1.2K. This should not be there as there is no power input to the system. Flow and return should be at the same temperature and slowly decay at the same rate. As a matter of fact, my own temperature probe measurements show exactly this, as can be seen in the following graph. Where my own PT100 flow + return measurements drop to the same level when the compressor is off (and this temperature closely aligns with the Vaillant reported value), the Vaillant reported flow temperature stays around 1.2K above the return temperature. As a matter of fact, this offset is also visible during operation when the Vaillant flow temperature reports around 1.2K above my own measurement. I do trust my own probes more since what they are measuring makes sense from a physics perspective; and the return measurements exactly align with Vaillants measurement.
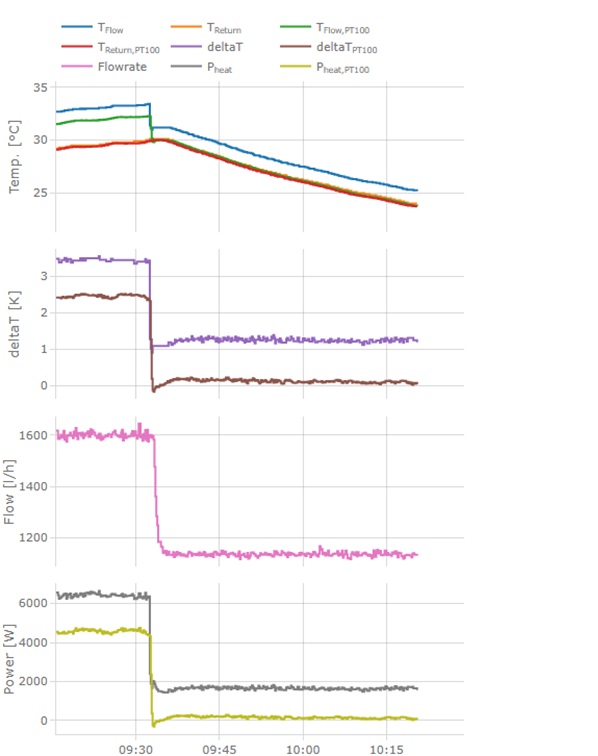
This 1.2K difference coupled with my 1600 l/h flow rate translates to a whopping 2.2 kW overestimation of heating power by Vaillant, which in turn results in a much overreported environmental yield and exaggerated COP.
Further evidence for overestimation of heat power:
We recently had a -10°C average day and I had a flow temperature at around 35°C (hooray for 140mm fans under the radiators!). According to the Vaillant specs, I should get a COP of around 3. The measured COP is 4 - which while I would really like but won’t believe for one second. The same figure is reported by the myVaillant app.
Furthermore I know the heat power requirements of my house very well. In preparation for the heat pump installation I monitored gas consumption using an impulse counter last year and correlated gas usage with outdoor temperature. Over the last heating season I found that I need 3.75 kWh per day for every Kelvin difference between inside temperature (20°C) and outside temperature - and that was with an inefficient 30-year old gas heating system. Using Vaillants reported heat power measures I get nowhere close to that but always significantly higher. I would expect something lower since I’m at much lower flow temperatures, the system is better insulated and does not dump a lot of heat into smoke and my heating room. For the aforementioned -10°C day, I’m getting 4 kWh / K based on the Vaillant data - which is too high. I have essentially never seen a value < 4 kWh/K which I find highly suspect and which led me down this rabbit hole in the first place.
This is either a defect on my pump - which can be fixed as it is still under warranty, or a systematic way to overinflate COP measurements…(of course the app states that the reported values are calculated and can be significantly off).
My question is: Can anyone confirm this behaviour? Are your reported flow and return temperatures also significantly apart even when the compressor is off? How well do they match your own measurements?