STM32 Development

PC7 is pulled high and then breifly goes low after a reset. It then comes back on about 90ms after LD2 (PA5). I can see that in your updated shield code its a rising edge trigger, I tried adding in the following:

HAL_ADC_Stop_DMA(&hadc1);
HAL_ADC_Stop_DMA(&hadc2);

MODIFY_REG(hadc1.Instance->CFGR, ADC_CFGR_EXTEN, ADC_EXTERNALTRIGCONVEDGE_RISING);
MODIFY_REG(hadc2.Instance->CFGR, ADC_CFGR_EXTEN, ADC_EXTERNALTRIGCONVEDGE_RISING);

pulse_tim8_ch2(0);
HAL_Delay(20);
HAL_ADC_Start_DMA(&hadc1, (uint32_t*)adc1_dma_buff, ADC_DMA_BUFFSIZE);
HAL_ADC_Start_DMA(&hadc2, (uint32_t*)adc2_dma_buff, ADC_DMA_BUFFSIZE);
pulse_tim8_ch2(0);

Which edge you use shouldn’t matter, in fact I use both in the case where the caller has requested a lag between ADC starts. In the no-lag case I arbitrarily chose rising.

Passing 0 to pulse_tim8_ch2() is problematic though. I’m not sure what that’ll do but I suspect it’ll generate no pulse at all which would explain why they’re not starting because they won’t see the edge they’re all waiting on. If you look at my start_ADCs() routine you’ll see I never pass the 0 through, but turn it into a 1 to ensure there is some pulse.

I’m not entirely confident that’ll get you going though, because your earlier code snippets was passing 1. Without your .ioc file it’s hard to see how the h/w has been set up. I always make the .ioc file part of my revision controlled repository because it’s the starting point for all the generated code.

[EDIT] In the no-lag case, which I think is what you’re trying to replicate, the duration of the pulse doesn’t matter because the ADCs are all waiting on the same edge, but there needs to be one.

I got a chance to put the txshield demo s/w onto the calibrator and calibrate it up. While at it, I added the ability to display real world units (Volts, Amps, Watts etc.) instead of raw A/D units. The calibration multipliers literally get applied right at the final printf, everything up until then is done in raw A/D units. The multipliers live in calib.h, and if you’d rather stick to raw A/D units, you can just set them all to 1. Here’s what they look like for my specimen:

//
// Change these all to 1.0 if you want raw A/D units
//

const float VCAL = 0.24119479813;

const float ICAL[MAX_CHANNELS] = {
  0.04874034071,
  0.04897653045,
  0.04883745917,
  0.01989279489
};

const int ADC_LAG = 269;             // ~4.8 degrees

I’ve got 3x SCT013s (100A:50mA) plugged into channels 0-2, and an SCT006 (20A:25mA) plugged into channel 3. I’m using the standard 33R shunts onboard the shield (which is probably a bit of a stretch for the SCT006), and a locally sourced 9VAC wall-wart for the VT. All calibration was done at 230V, 10A, 50Hz.

The nominal multiplier for the SCT006 is:

I / 4096 * 3.3 / 33 / 0.025 * 20, or I * 0.01953125 (c.f. 0.01989279489 calibrated)

The nominal multiplier for the SCT013 is:

I / 4096 * 3.3 / 33 / 0.05 * 100, or I * 0.048828125 (c.f. 0.04883745917 calibrated)

The nominal V multiplier is a bit tricker due to the wide range of output voltages, but if you start with the effective divider of your VT you can get pretty close. My VT has a divider very close to 23, i.e. when I put 230V in I get 10V out. Using that, the nominal multiplier for V is:

V / 4096 * 3.3 * 23 * 13, or V * 0.240894 (c.f. 0.24119479813 calibrated)

Calibrate V and I and you get Power for free.

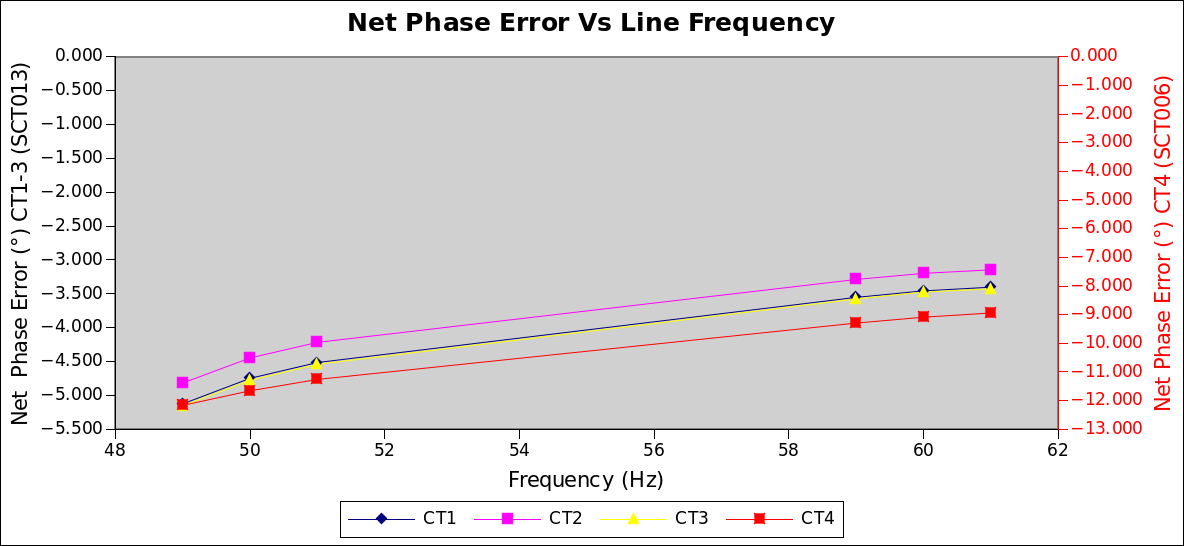
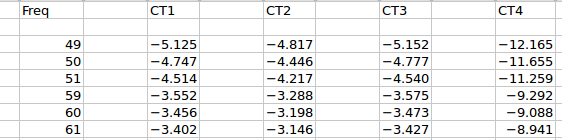
Phase error was calibrated at 90°, the 3 SCT013s called for a correction of 4.866°, 4.409° and 4.873° respectively, net… i.e. relative to the VT (I’ve no idea how much each contributes). The SCT006 called for a correction of 11.599°. Since I’m using the simplistic ADC lag technique to calibrate away phase error, it’s a one size fits all situation and I went with a 269 usec lag (or ~4.8°). The poor showing of the SCT006 measurements show just how vital per-channel phase correction is (but we already knew that). It got less than half of the phase error correction it needed and it shows. I tested the calibration at 3 different phase settings: purely resistive, PF of 0.5, purely reactive.

Calibrator set to 230V, 10A, 0° phase shift (expected Preal = 2300W):

CPU temp: 39C, Vdda: 3306mV                                                                                  
0: Vrms: 230.05, Irms: 10.00, Papp: 2300.65, Preal: 2296.65, PF: 0.998                                       
1: Vrms: 230.05, Irms: 9.99, Papp: 2299.27, Preal: 2296.31, PF: 0.999                                        
2: Vrms: 230.05, Irms: 9.99, Papp: 2298.48, Preal: 2295.17, PF: 0.999                                        
3: Vrms: 230.05, Irms: 10.00, Papp: 2300.67, Preal: 2282.09, PF: 0.992          

Calibrator set to 230V, 10A, 60° phase shift (expected Preal = 1150W):

CPU temp: 39C, Vdda: 3302mV                                                                                  
0: Vrms: 229.96, Irms: 10.00, Papp: 2299.63, Preal: 1150.86, PF: 0.500                                       
1: Vrms: 229.96, Irms: 10.00, Papp: 2300.39, Preal: 1155.70, PF: 0.502                                       
2: Vrms: 229.96, Irms: 10.00, Papp: 2299.46, Preal: 1148.40, PF: 0.499                                       
3: Vrms: 229.96, Irms: 10.00, Papp: 2299.84, Preal: 899.04, PF: 0.391     

Calibrator set to 230V, 10A, 90° phase shift (expected Preal = 0W):

CPU temp: 39C, Vdda: 3304mV                                                                                  
0: Vrms: 230.06, Irms: 10.00, Papp: 2299.88, Preal: 2.55, PF: 0.001                                          
1: Vrms: 230.06, Irms: 10.00, Papp: 2300.57, Preal: 7.79, PF: 0.003                                          
2: Vrms: 230.06, Irms: 10.00, Papp: 2299.95, Preal: 0.16, PF: 0.000                                          
3: Vrms: 230.05, Irms: 10.00, Papp: 2300.53, Preal: -279.61, PF: -0.122         

txshield_demo_7.tar.gz (884.3 KB)

Thanks @dBC.

I’ve been otherwise occupied the last few days so my progress has been minimal at best.

Thanks for version 7, although I haven’t tried it myself, I have just committed it to the repo and the changes can be seen at emontx_demo_7 · stm32oem/stm32tests@43b243a · GitHub.

I would be interested to know what results you get for 49Hz and 51Hz if that’s an easy test while you have it setup. We know that 60Hz will yield slightly different phase correction settings, and we have been discussing a possible Vac phase correction mapped to Voltage magnitude, I’m just wondering what the real world value in doing a correction for minor changes in line frequency might be.

The results also clearly highlight how much more effective adjusting for 0 at 90° is compared to targeting a PF of 1 or highest power at 0°.

How close do you need to get the voltage?

My voltage is varying by up to 1.2 of a volt which make it quite hard to calibrate.

3: Vrms: 242.53, Irms: 1.75, Papp: 423.85, Preal: 12.42, PF: 0.029
CPU temp: 35C, Vdda: 3308mV
0: Vrms: 241.78, Irms: 0.50, Papp: 121.69, Preal: 4.38, PF: 0.036

Thanks!

Here you go. Keep in mind this is net phase error. Both the VT and the CT will be sliding around on their phase error graphs and I’m only measuring one relative to the other. You’d probably get quite different results with a different VT.

I had to give CT4 it’s own axis otherwise it would have swamped the others.

Or if you prefer raw numbers:
phase_vs_freq_d

The closer the better!

That’s probably not helped by the very long sample averaging time (10 seconds) the demo program uses. When you’re connected to a calibrator and getting the exact same signal cycle after cycle after cycle, a long averaging time is great but can be a real pain if you’re trying to nail a moving target like grid voltage.

That long averaging time helped hide any errors introduced by the lack of zero crossing checking. There were so many samples in the average (~147,000) that the “tail errors” caused by having partial half-cycles in the stats got blown away by the sheer numbers.

Here’s version 8 that has some rudimentary zero-crossing detection so that the averaging sample should be a whole number of half cycles. That in turn should let you reduce the averaging time without fear of “tail errors” kicking in. You can do that with this define in power.h:

`#define REPORTING_INTVL 10               // seconds`

The zero crossing detection is based on the raw A/D readings with just the nominal mid-rail removed, so it won’t be perfect, but should be a lot closer to zero than a random start. There’s no timeout while it waits for a zero crossing, so if you get no power data at all, check your V signal.
txshield_demo_8.tar.gz (885.8 KB)

Thanks @dBC the graph seems to demonstrate there is some linearity in close proximity to the 2 key frequencies although that linearity isn’t consistent across the 2, So it would seem any “simple” phase correction tweak we might incorporate for frequency would need to be 50 or 60Hz specific, a wider single band (eg 45-65Hz) would involve something more complex.

As you say though, these values are specific to your AC adapter and may vary for the OEM adapter, having said that I for one, would like to see a more flexible implementation with this device that can suit a wider range of VTs and CTs.

However, what I was more interested in was the exact tests you did previously, but with the frequency changed to get a real world idea of whether we should pursue a frequency based adjustment to the phase correction.

I would have liked to have seen the same result blocks eg

CPU temp: 39C, Vdda: 3302mV                                                                                  
0: Vrms: 229.96, Irms: 10.00, Papp: 2299.63, Preal: 1150.86, PF: 0.500                                       
1: Vrms: 229.96, Irms: 10.00, Papp: 2300.39, Preal: 1155.70, PF: 0.502                                       
2: Vrms: 229.96, Irms: 10.00, Papp: 2299.46, Preal: 1148.40, PF: 0.499                                       
3: Vrms: 229.96, Irms: 10.00, Papp: 2299.84, Preal: 899.04, PF: 0.391  

but the last 2 columns would then be specific to the test frequency so we can see the actual real world change a +/-1Hz shift means to the accuracy of the data returned at unity, 0.5 PF and 90°.

Since any tests I perform are done at the mercy of the line voltage bouncing around and a frequency that I cannot define, or predict (plus it generally only shifts a small amount during any test period), not to mention whatever else is going on with noise and harmonics etc, I have therefore never actually seen a difference that could be attributed to frequency changes alone. It’s difficult to quantify those inaccuracies.

With your constant and clean voltage signal and load, any in change PF or Preal will be predominantly due to the changed frequency and help determine the value of such a correction. I understand the actual figures will be specific to your VT, but I’m interested getting a feel for the “swing” in results for a 1deg change

I’m specifically wondering how the PF and Preal are affected by the change in frequency, I suspect like many things, the impact will be much greater at lower PF’s and that this is another error that gets hidden in most monitoring projects by the larger high PF loads.

As you know any monitor that has more than 2-4 CT’s per phase is more likely to reveal any “low PF” errors as more CT’s are introduced and specific circuits get monitored, eg even a typical household ring main, once you remove heating, DHW and the “cooker spur” becomes a haven of different types of loads with varying PFs and far less large unity loads to hide behind, with higher CT counts, I think we will need to focus more on the non-unity loads, almost “just to retain” the accuracy OEM devices have previously demonstrated when monitoring whole house or PV and compared to a billing meter over a period of time.

No problem at all, thanks for sharing and documenting all this. The least I can do is upload it to a git repo for easy access for dissection, digestion and discussion :grin:

[edit - Just updated with tar number 8] emontx_demo_8 · stm32oem/stm32tests@3f6ee85 · GitHub

Ahhh… the reason I rejected that approach is because my current ADC-lag phase correction is time-based not degrees-based so it doesn’t perform at all well when the line frequency is not near nominal, even without the magnetics changing their behaviour. There’s some data on that above. I thought you guys were considering going the PLL loop to solve that.

It’s easy enough for me to add what you’re requesting, but from memory I think the ADC-lag induced error will swamp any change-in-magnetics error, which I figured is what you were really interested in. You can see in that much earlier post, the error is 1.74° at 49Hz and that’s without any magnetics involved (signal generator feeding the ADC inputs directly, no CTs or VTs).

That makes sense! I had overlooked the fact the correction was time based and therefore not relative to the signal, never mind then.

Yes I suspect PLL might be the favorite approach although I don’t think any decisions have been made at all yet.

My thinking is that what ever CT’s and VT’s are used, there will be a phase correction calculated, but if that correction is not static across the actual working frequency and trying to determine if A) it’s worth trying to fix and B) whether we could simply use the measured line frequency to adjust the correction for each sample set. eg use the sample count of the last cycle to increase or decrease the phase correction value(s) used.

Indeed, it’s that very post that piques my interest in whether we need to correct for line frequency.

Although now with the realization of the time vs angle fact and re-reading the lead up to that post, I now wonder if I got the wrong end of the stick, back then. Based on that comment and a recent forum discussion involving an Airbus, I had got it into my head that phase error might not be constant across the working frequency range.

I now think you were saying (in that comment above) there was a greater phase error at 49Hz and 49.8Hz because the correction being applied is time-based and the correction had therefore changed angle, relative to the waveform. I mistook that to mean the angle of phase error had changed not that the angle of correction had changed. My mistake.

So that I’m sure, can you please clarify if any phase errors present with VT’s or CT’s are a constant angle regardless of frequency (with all other aspects as constants)? I do understand the time and therefore the correction applied in the test sketch is obviously frequency dependent, although I overlooked the fact the correction was time based in the test sketch when I asked for the extended results.

Correct. In that much earlier test, there were no magnetics involved (my shield hadn’t arrived yet).

Nope, unfortunately they change with frequency as well. In that post with the graph, just a few back, there is no correction. I set the ADC lag to 0 so the ADC samples were perfectly aligned to sub nsec timing. I told the calibrator to shift the two signals by 90° (and it knows how to do that correctly at all line frequencies). All that slope in those plots is down to frequency change and frequency change only. Had all four been perfectly horizontal lines, then we could say the phase error is insensitive to line frequency, but clearly that’s not the case. What we can’t tell from that graph is how much of the change is down to the VT or the CT, since it’s all relative/net.

The extent to which their phase error does vary with frequency and current depends a lot on the quality of the CT, and probably on how high a voltage they’re trying to generate (how big a burden R). I think that SCT006 (CT4) above is working well outside its comfort zone driving a 33R (its slope is worse than it looks, due to the change in y-scale). The 333mV CTs I use with my energy IC based monitor are pretty flat graphs, so I think the idea of going with a lower Vref has merit. It’s just hard to prototype with patch cables due to noise constraints. Current is probably the big one, as line frequency tends not to drift too far from nominal.

Sorry, forgive me I’m confusing myself here. I know the error varies and yes you have just confirmed that in that graph. I’m just not very confident of what I understand and I’ve let doubt seep in. As I stated I do not get to see these effects in the real world, it’s all theoretical and/or bundled in with other errors and influences.

Good that makes much more sense to me.

That is my understanding too. From what I gather, the lower the burden, the lower the phase error, but more importantly IMO is the reduction in the swing, across the load range, this becomes even more valuable if it reduces any additional swing from frequency fluctuations too.

It’s easy to add in a static correction, not so easy to map that to both load magnitude and line frequency.

Users can calibrate for a phase error if it is relatively flat, once there is a significant slope, their calibration only suits the frequency at which it is done, which for most of us will not be the nominal frequency and it will be moving.

I’m trying to understand if the potential variation in phase error angle based on line frequency warrants adding another dimension to the correction calculation. I think it has been largely accepted that with the right burden, the swing in phase error across the larger part of a CT’s operating current is minimal and that the swing in phase error relating to the voltage magnitude has more impact, should we also be looking to apply a correction for frequency based variations in phase error too?

Your data shows a swing of maybe 0.5° and is using higher than ideal burdens (22R @ 3.3v for the 100a sct), considering real world (or in the UK at least) we would rarely if ever see a 1Hz change, is the swing in error due to frequency a viable correction if every sensor has it’s own characteristics or is it even negligible?

That’s why I was hoping for some Preal and PF data to get a feel for the actual impact and maybe even get an idea of effort vs reward of a correction.

Perhaps I’ll take a closer look at the STM32F3Discovery pinout and the F303VC ADC channel assignments might let us get a short batch of 18+ channel shield pcbs made. The Discovery looks like it can be easily hacked to add an external Vref down to 2v (2.048v ?). A cheap batch of 10 or so PCB’s would cost very little.

Sorry to show my weakness in the theory and make you go over all this again, at least it gives @Robert.Wall a breather, he usually gets the job of hammering it home until the proverbial penny eventually drops for me.

My gut feel is you can probably forget about frequency, other than the gross adjustment of having one setting for 50Hz and another for 60Hz. During major network events, like an entire state going dark, we see about +/- 0.2Hz deviation. I think long before it gets anywhere near as low as 49Hz or as high as 51Hz things will deliberately trip as they represent a significant under/over supply of energy. But my experience is limited to how the grid works here in Aus, it may not be universally that well governed; you definitely hear stories in this forum of some pretty dodgy grids out there.

When I get a chance I’ll try to repeat the graph above, but with Current on the x-axis, and maybe even another with Voltage on the x-axis since I can control them independently. I’ve no experience with VTs but I have seen some pretty non-flat graphs in Robert’s reports. I do know CT phase error varies with current. On my energy IC monitor, I lock in the phase correction from 1/10th the rated current, and hope for the best. So a 20A CT I calibrate a 2A, a 50A at 5A etc. Dynamic phase error correction is interesting, but not something I have any experience with. I wonder if you almost need some sort of PID control loop techniques so you’re not constantly chasing the previous value. Get it wrong and it may end up worse than just using a fixed correction.

What would be a more suitable burden for the 100a sct?

@dBC

With the latest version and a 4 second reporting interval I was able to reduce the error between my meter and the reported Vrms to about 0.05 volt. Thanks.

It appears to be dead simple. (Famous last words! I did write “appears to be”.) If you look hard at the maths for the interpolation/extrapolation between samples, you’ll see that you can rearrange it and sum what I call “partial real powers” - current × voltage sample and current × last voltage sample, and then apply the inter-extrapolation when the average current and voltage are known. I’ve done that first part in the upcoming emonLibCM, but not added the look-up to correct the value that’s used.
There’s no real reason to prevent you saving the accumulated sums of current × a few voltage samples so that you can choose the appropriate pair and always interpolate (which introduces smaller inaccuracies).

That’s always a real possibility, and what makes me reluctant to offer the facility for general use. It does require knowledge of the variation of phase error against the measured quantity for the transformers in use, and that’s unlikely to be data that’s readily available, unless it’s one we’ve tested.

Any c.t. is more accurate the lower the burden resistance. A dead short is the ideal case, but ever so slightly unrealistic. In reality, a balance has to be found between ADC problems with low burden voltages and c.t. errors with high burden voltages.

[N.B. It’s 100 A, not a.]

1 Like

Robert, what would be the process to determine the optimum value for the burden resistance, using for example the shop SCT-013-00 CT’s?
Would it be desirable to try and get the front end working as accurately as possible at this stage, so that it doesn’t skew data further into the processing chain, and add further complications?

Paul

I’m starting to think that might be the case too.

Same here in the UK.

but

and there are some off grid installations, and backup power solutions out there too, I try not to think too much about what we have as a norm since that might not be global and it might limit our thinking and therefore the application of our device. If something is too hard or costly to implement, then we need to look at the reality of who needs it and how often etc.

Actually, the answers in the question.

Because the shield is designed for 5v operation it has 33R burdens for the same target CT’s. My bracketed values are the currently used “3.3V” values for the emonPi and emonTx.

It’s exactly the same calculation as used in the other devices, the “variable” element assuming the same CT is used, is the Vref, emonTx Shield is 5v (when used with an Arduino Uno), emonPi and emonTx 3.3v, and currently the Nucleo64 (F303RE) is fixed at 3.3v. The 100/144 pin packaged F303’s do allow a Vref of down to 2.0v, but ST’s proto boards have the Vref hardwired to AVCC (3.3v). The DiscoveryF303 has a well placed 0R resistor that could be removed to introduce a different Vref.

In production we can go as low as 2.0v with a 100/144 pin packed F303 but we are stuck with 3.3v Vref on the 64pin. a 2.0v Vref would allow us to use a burden around 13 or 14 ohms, so significantly lower and therefore a flatter phase error across both frequency changes and the larger part of the CT’s current range.

That’s what I was hoping for by suggesting a short run of cheap pcbs we can self/hand populate.

We could add 66R resistors in parrellel to the existing 33R’s to get the required 22R (for 3.3v Vref) but there is so much movement in the 33R tolerance and the midrail tolerance that we are only going to get a certain level of accuracy with this shield, especially at 3.3v Vref. Plus we only have 3 CT channels, so loading up the processor or crosstalk or power related issues etc etc will not surface when only testing with 3 CT’s.