Building on the post here looking at why Over-sized heat loss = over estimated design temperatures and then my thoughts on system sizing lower down in that thread: Process for system sizing. It got me thinking that it would be useful to be able to explore this question of accurate assumptions vs CIBSE defaults for different types of houses in a more efficient and dynamic way.
Introducing “Super Simple Heat Loss”: Calculate heat loss in seconds rather than spending hours drawing up a house! Compare assumptions and impact on sizing…
I would be interested to hear if anyone can replicate their measured heat loss in this tool and how it’s accuracy compares to drawing the house in detail using a floor planner type tool like HeatPunk. It’s not a replacement of course as you still need that room by room detail, it’s more a way to get quick sizing numbers.
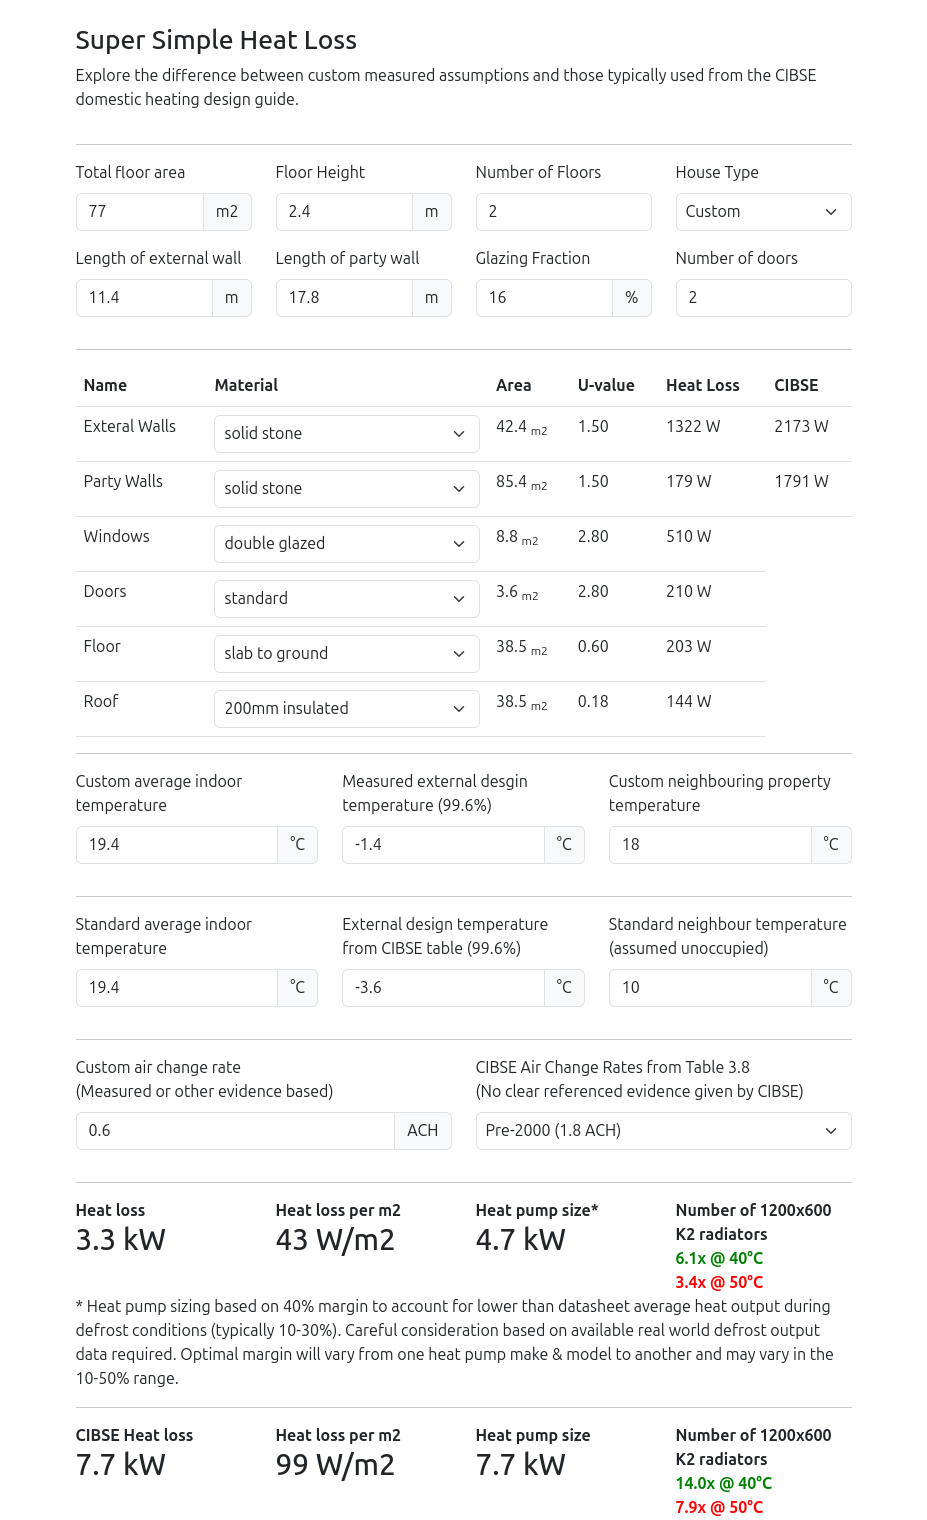
Example 1: The first example and the one that loads in the tool by default is of my own house, a mid-terrace, solid stone house in North Wales. Using the Custom shape option where it’s possible to enter in the length of external and party walls, the tool reproduces the heat loss in my more detailed room by room calculations almost exactly. Here’s the overall result:
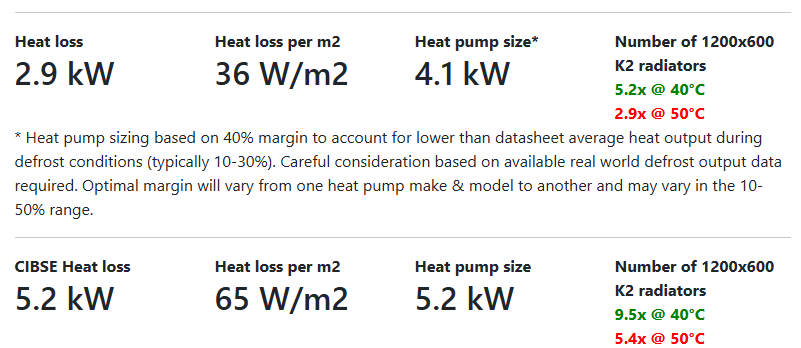
The heat loss based on an air change rate of 0.6 ACH, heated neighbours at 18C and measured stone wall U-values from SPAB comes out to 3.3 kW, which is very close to what I measure https://heatpumpmonitor.org/heatloss?id=2 the HeatpumpMonitor.org value is 3.5 kW at DT 23K while my heat loss calc is 3.3 kW at DT (19.4–1.4), which are both very similar numbers.
The CIBSE default assumptions value here comes out a little higher for some reason that the 7.5 kW I calculated in the more detailed calculation. This might be to do with the way the room by room calculation will weight e.g bathroom heat loss at 22C and 2ACH higher than an average air change rate and indoor temperature. It’s a small difference so happy enough with that.
Apart from the heat pump size we can see that the biggest difference is arguably the number of 1200x600 K2 radiators required to meet the heat loss at a flow temperature of 40C! I only need 6 such radiators at 3.3 kW but would need an impossible 14x radiators at 7.7 kW! Id be designing to 50C if I believed the CIBSE default heat loss and setting the weather comp curve accordingly without realising I was running much hotter than needed! Which illustrates how much of an effect these assumptions have!
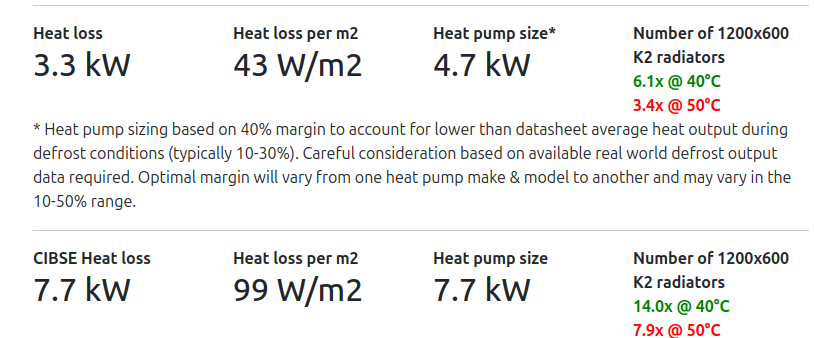
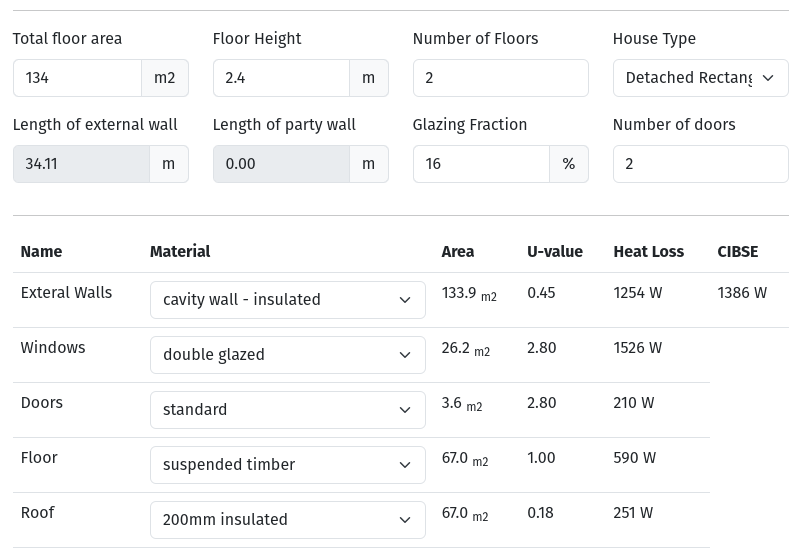
Example 2: Other end of the scale a 140m2 (16:9 aspect ratio), detached, post 2006 build (CIBSE suggests 0.5 ACH here), insulated cavity walls, insulated slab, 300mm loft insulation. Here the calculated heat losses are the same if we assume the same -3.6C design outside temperature for both:
I think this could result in an undersized heat pump. If the heat pump stated max output matches the heat loss exactly and the real world heat output of the heat pump in defrost conditions is lower than this. The system may get a higher SPF if a decent margin is added e.g 30-40%, though this of course depends on the make and model…
We need 10x 1200x600 K2’s for a 40C design flow temperature which shouldn’t be too hard.
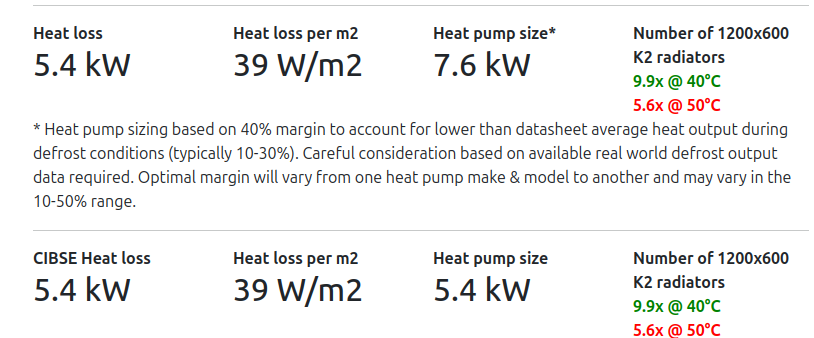
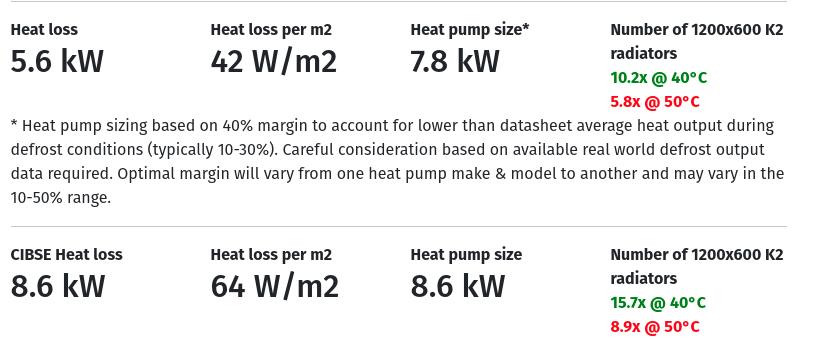
Example 3: If we now assume that this same house was built pre-2000 and so uses the pre-2000 air change rate average of 1.8 ACH:
This might push from e.g an 8kW Daikin up to a 9kW and so suddenly loose that low end modulation potential. The number of K2 radiators apparently required for 40C design flow temperatures has also jumped up significantly and likely out of practical range.
Clearly weather compensation needs adjusting automatically based on reallife proformance rather then setting on install day (never to be changed) based on standard heatlose calculations.
Thanks both, a couple of interesting sizing examples:
10 kW, Viessmann Vitocal 150A:
SPF H4 5.0
Measured 24h heat demand: 5.4 kW
datasheet max output 9.7 kW
1.8x margin factor.
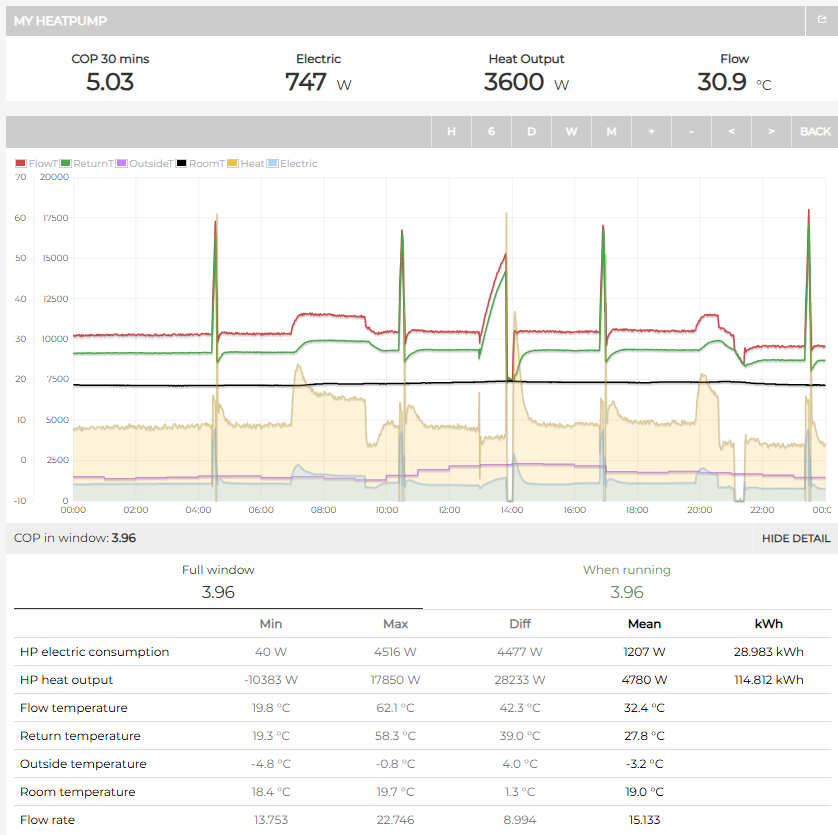
Performance on the coldest day -3.2C was also amazing COP 3.96 (Emoncms - app view). Average electric 1207W, heat: 4780W. Peak electric: ~2000W, heat: ~8000W (over 10 mins).
Performance on an average heating season day +5.2C also great COP 5.18 (Emoncms - app view).
Minimum modulation around 670W electric, 3300W heat.
Probably the best example of a heat pump + system that works very well with a large margin. Weather comp is tuned to actual heat loss of course on this one, both with the help of the installer and the householder I believe.
Measured 24h heat demand: 12 kW extrapolated, 9.7 kW max so far
Haven’t compiled a large number of defrost test results for the 12 kW yet, but there is one period on this system that might be close giving 10.7 kW.
Very little margin on this one, possibly 1.1x based on coldest day so far, but could be just under. A good example of a system sized right up to the edge.
@TrystanLea All very interesting. I maybe missing something, but how did you arrive at the average maximum heat outputs for these systems, ie ~8000W (over 10 mins) in the 10 kW, Viessmann Vitocal 150A example etc
This seems bang on for measured heat loss and the CIBSE is pretty close to my calculated heat loss using MCS room by room spreadsheet.
Measured Heat loss @-2C is 3kW, your calculator gives 2.9kW at 19C inside temperature and -2C outside.
Calculated Heat loss @-3.9C is 5.3kW (room temps varying 18C-22C), your calculator gives 5.2kW for CIBSE inside at 19.6C (default) and -3.6C outside (default).
For radiators our actual total radiator area is 5.5x @ 40C, we can produce the 3kW with internal temp of 19C with a flow around 35C.
CIBSE estimate is similar to my MCS calculation which predicted needing a flow temp just above 50C at -3.9C external.
We have a 6kW Daikin, which is arguably overpowered. The calculator’s suggestion of a 4kW pump seems about right to me.
So your calculator is as close as I think its possible to be to reality, and took a fraction of the time that running a proper heat loss calculation takes.
Having said that, I’m glad I also did a “proper” room by room heat loss calculation because that did produce very good results for getting the relative sizings of the radiators in each room right, even though the absolute values are way off.
Thanks @Jonathan that’s great to hear and thanks for sharing the results of running your numbers through it! Did you use Custom wall lengths or just a floor area and shape?
@Lakee I zoomed in on 10 mins over that 8pm peak to get that average peak output. Emoncms - app view I mentioned peak just to appreciate that the systems do vary in their output during the day. I focus a lot on the 24h average in general but there can be quite a bit of variation above that in the day.
I used floor area and shape, it seemed close enough.
Returning to the premise of your original thread on over estimated heat loss leading to incorrect weather compensation curves. Could you get the calculator to calculate a curve as well? Either taking the estimated radiator sizing or making that a configurable value?
Would be interesting to compare this with your calculator. When I’ve got a spare 5 minutes, I’ll put our data into your calculator to see how things compare. We have a heat loss calculation by our M+E engineers for the new build as well as a completed Buildhub spreadsheet.
Our ASHP installers used the data we provided from the M+E engineers for our MCS install - these checked out with the Heat loss spreadsheet.
Thanks @Bramco great to hear how it compares for you. The actual implementation is the same basic equations as used in a full heat loss calc, it’s just simplifying by using the floor area + shape approach to get basic building dimensions.
Think that’s where for me it might not work - we have a 1 storey part of the house and a 2 storey part - so I guess I’d have to model it as two separate semi detached buildings.
Semi detached 1920 solid stone, 101 square meters.
Brand new doors/windows and a 6 month old extension that makes up the whole back of the house to roof level.
Octopus survey puts my heat loss at 9.1kW and an 11kW Daikin installed.
My 3 months + of HTC data/calculations puts me at 4.89kW worst case
Putting my own house as close as I could and using an ACH of 0.6 gives me a decent ball park.
Can kinda see where Octopus are coming from with their survey.
1960s detached here, setting just house type, 134 m², ratio 16:9 and selecting cavity walls with insulation and suspended floor, left all other numbers at default.
House is a little drafty though, so I tweaked the ACH up to 0.8 so it matched heat demand.
Interestly the required radators capacity at 50c flow for CIBSE is very close to the number this heatlose calculation method gives for 40c flow. This is a seems to be a good match for how Octopus installs behave with skilful operators.
I still concerned about the risk of getting heating systems that will not work for people who have declining health, due to the temperatures they require.