There is no indication on the meter nor the manual where the inductive output is. I’ve used the youtube video in the thread where Edward used a bat detector. It also appears to be where MartinR has located his. I’ve held the probe in all orientations all round the meter. When (very) close to the mains wires I get random data.
On a a few occasions, when held near the exact spot shown in the videos, I seem to get some data, but it appears to be corrupted noise (mirrored ? symbols printed - ie not a valid ascii character ).
The meter should send data every 6 seconds according to the manual.
To answer your other question from a few days ago, picking up the signal from the meter : I’m doubting the hell out of myself now, having experimented so much with this.
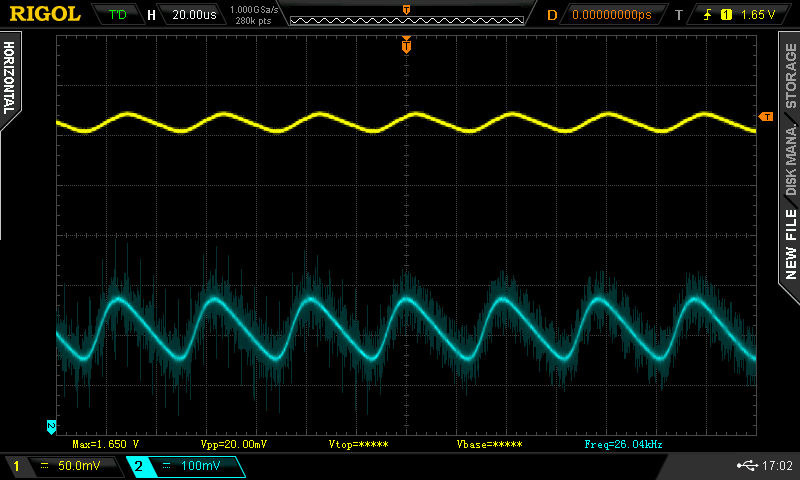
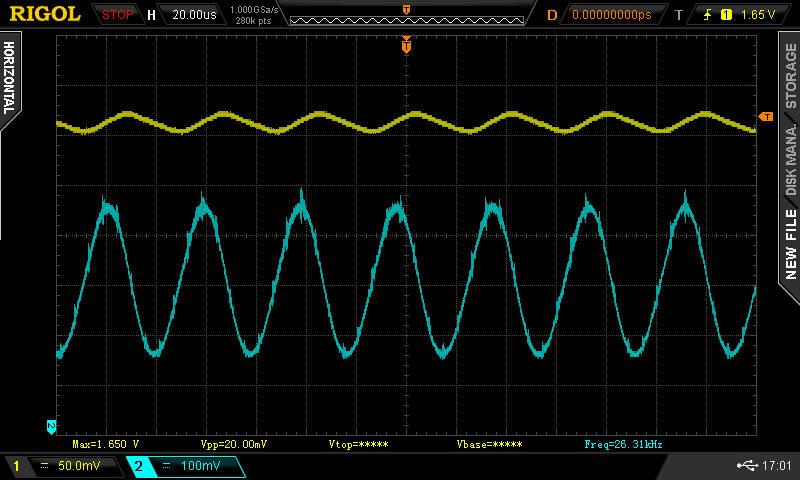
I’m pretty sure I picked up the 20mv pk-pk 26Khz wave on the scope with this circuit ( I_am_ sure!) I remember vividly finding and measuring it at 26Khz on the scope and seeing a nice sine wave with jagged edges - but I will go back and reverify that.
I need to go back to the scope approach to see what the waveforms look like and stop messing with the arduino. I need to see what the opamp is amplifying and what the signal looks like in all three stages (pre amplification, amplified and compared).
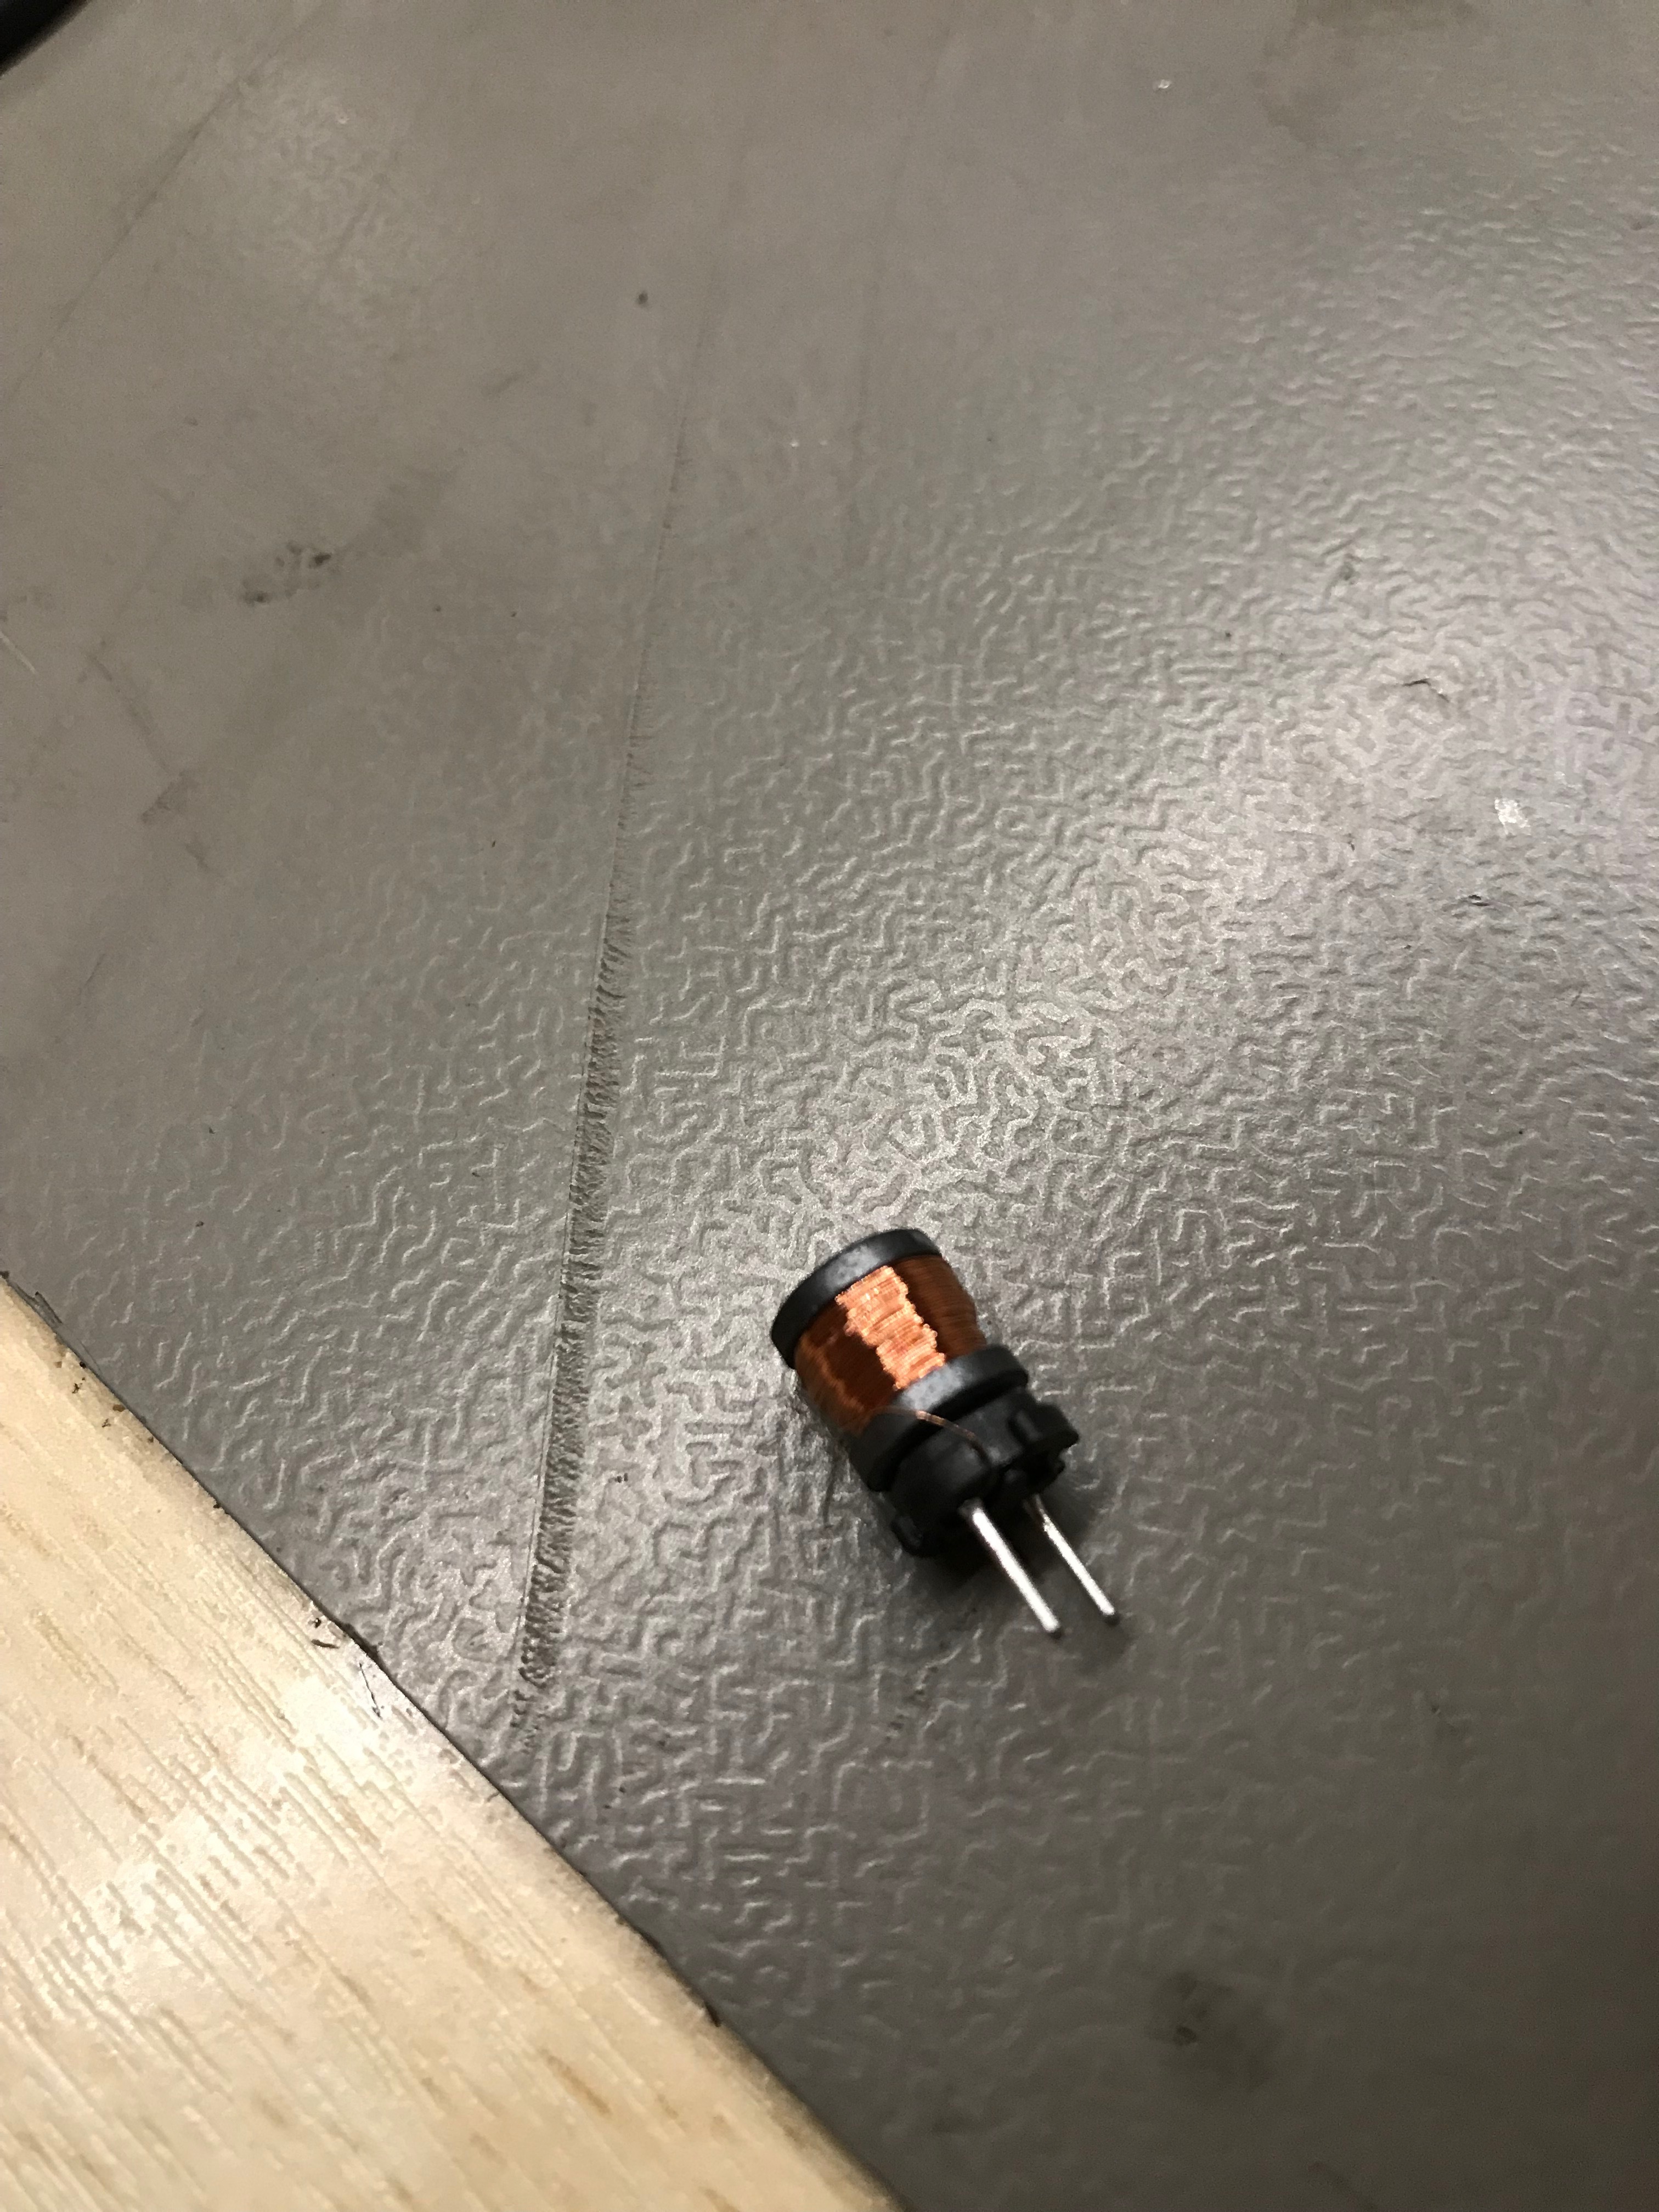
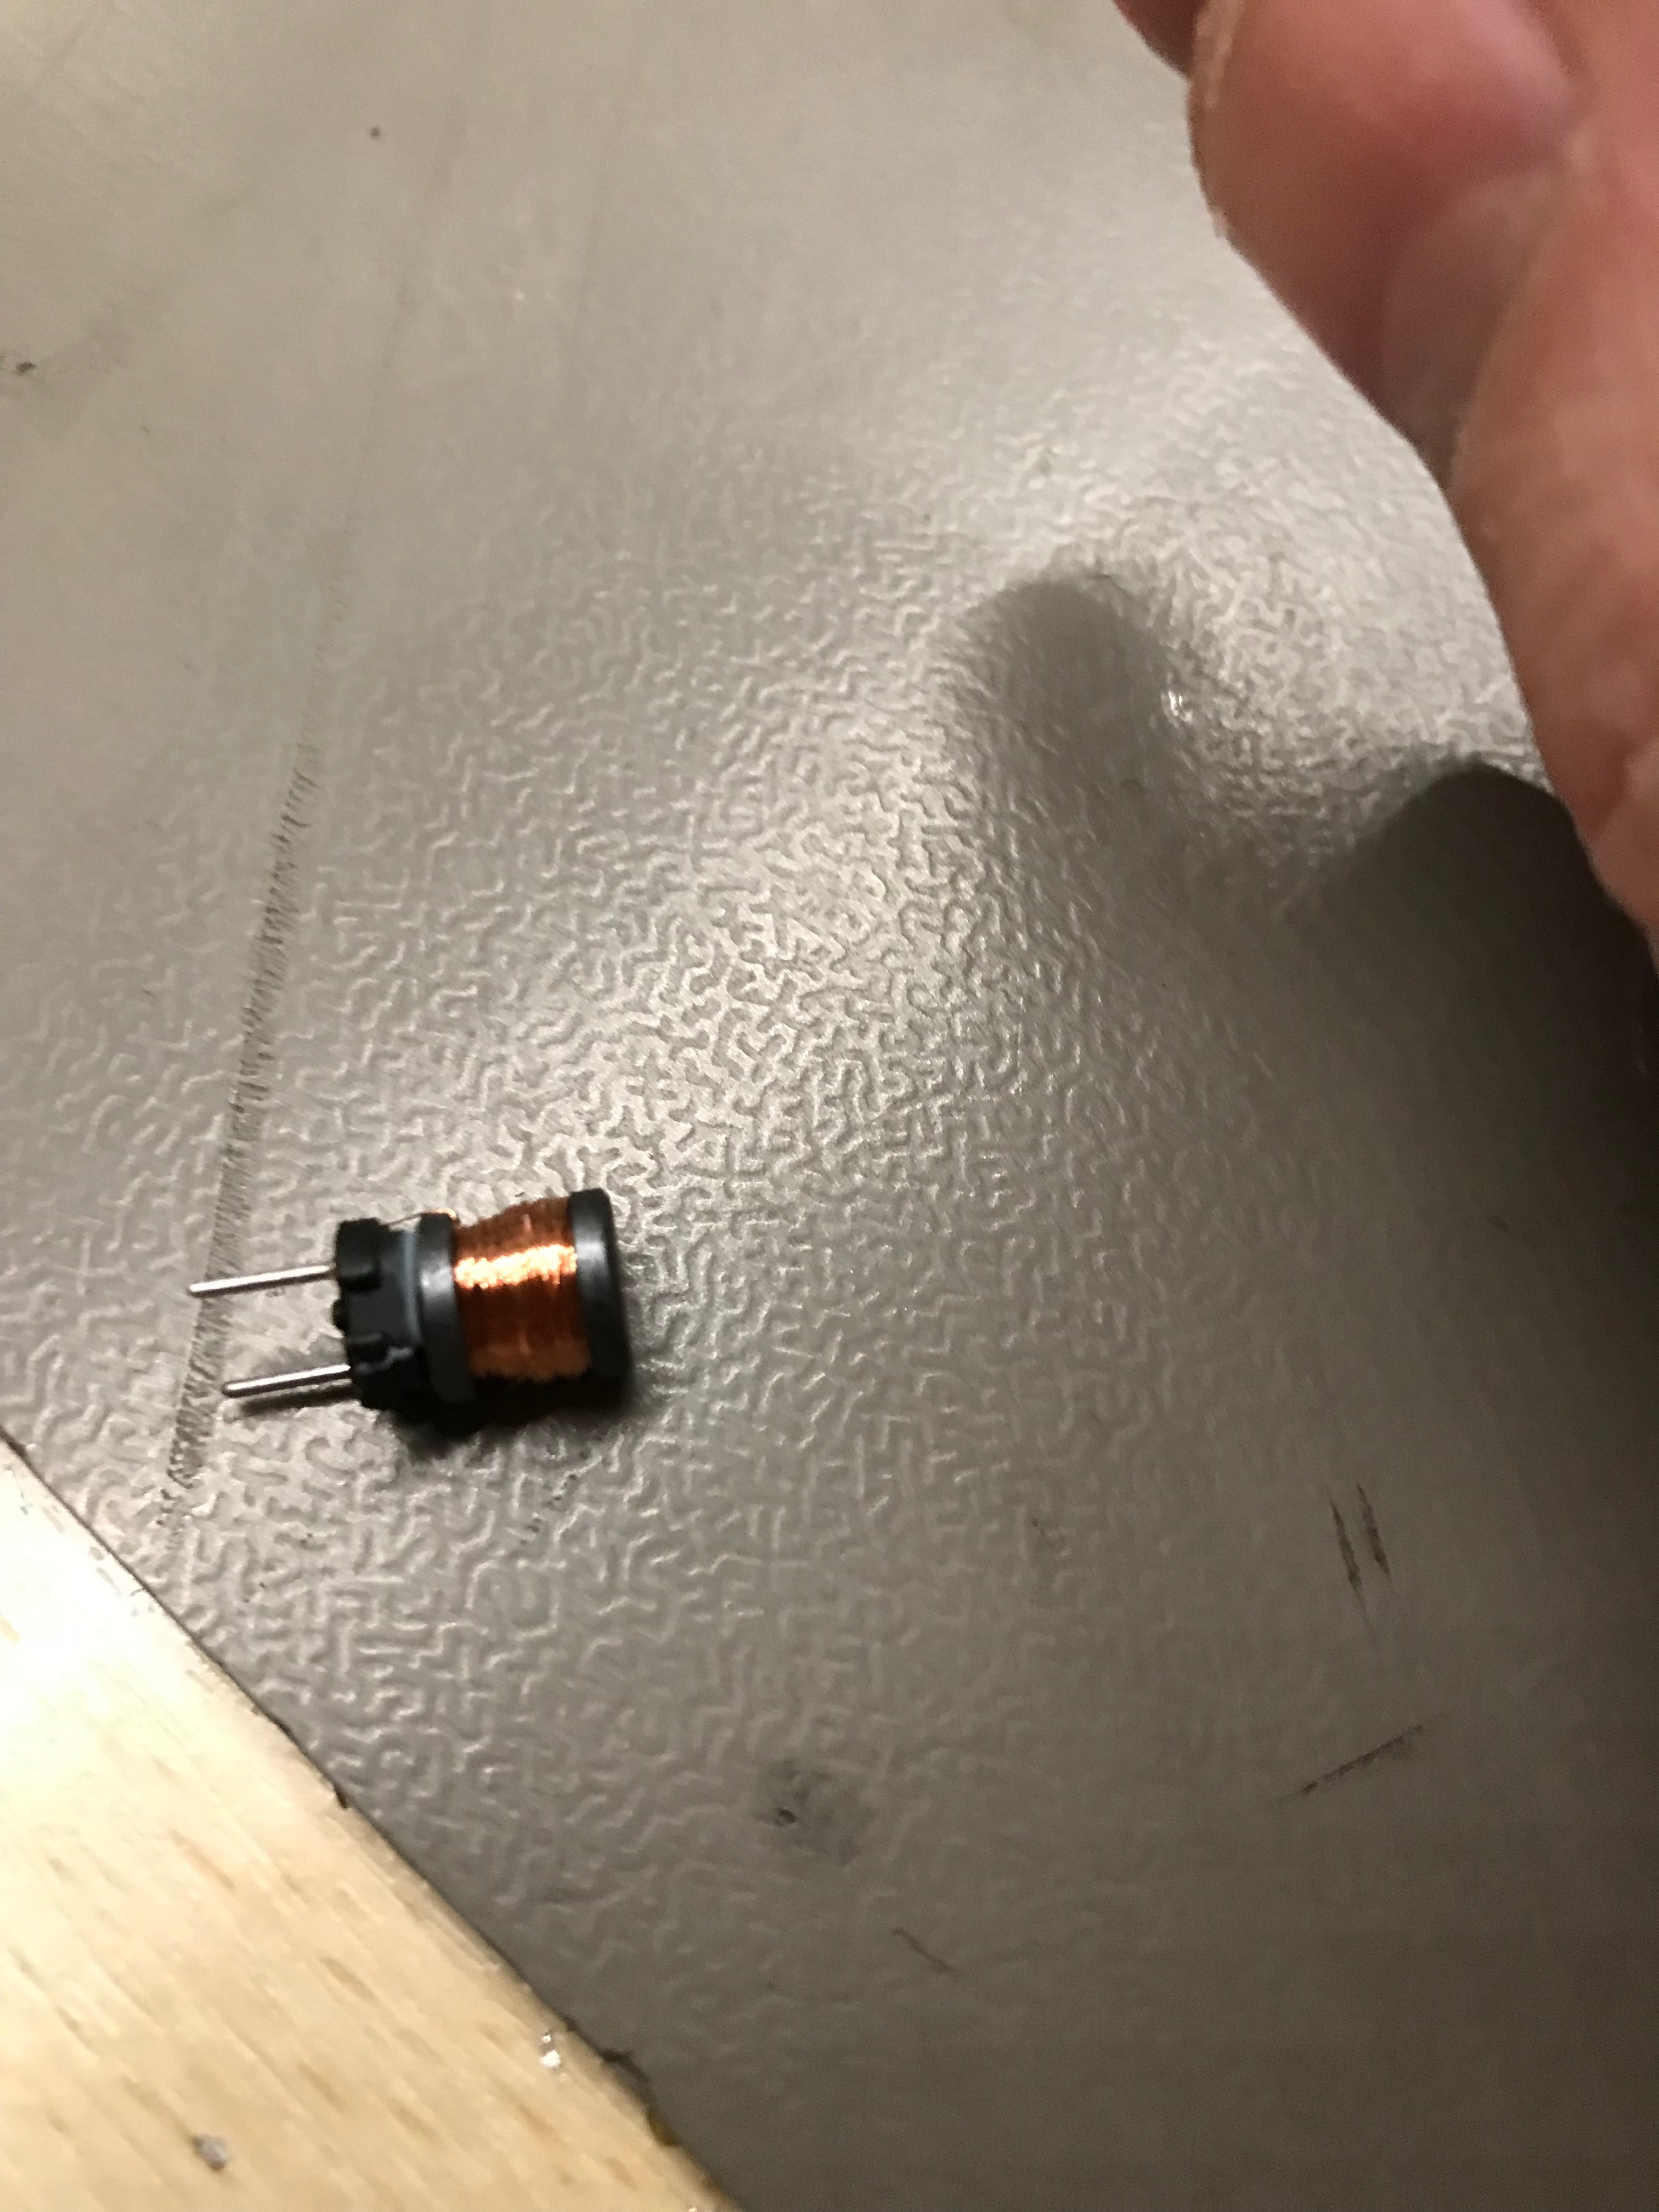
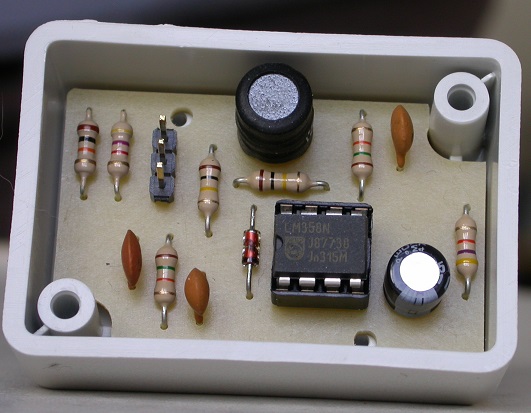
I cracked open a a twin of the inductor i’m using, pic attached.
Tomorrow is another day, just me, the meter, the circuit and Mr Rigol…
It’s super annoying this works so well on the bench.
I think that’s the best approach. If MartinR’s data is anything to go by (you too have a 3-phase meter?), then there’s about 150 characters there, at 7 bits and 1200 baud, the message should last the best part of 800 ms. If yours is a single-phase meter, I’d guess more like 300 ms.
[I picked up 2400 baud from post 11 - looking at MartinR’s sketch, it’s 1200. So my detector capacitor value is wrong.]
You should be able to distinguish a regular burst like that from noise. Until you have a reasonably clean signal at the output of the amplifier, there’s little point looking past there; and when you get there, there’s no point in looking at the Arduino until the detector is producing data-like output.
And it’s likely that there might be noise on the cables, if there is any mains carrier signalling leaking down the supply. I don’t know the specific frequencies used - I’d have expected higher than you’re using though, and I’d expect Ampy to know and stay clear of them! But your coil probably isn’t very sharply tuned, so it could be picking up over a fairly wide frequency band.
It’s 3phase. Yes, the baud is 1200, that was my silly error. I’ve been working with 1200 everywhere for the past few days. The filtering appears to work well on the bench, so the cap values may be close enough. … (or not!)
I’ve just been out again to the meter (without scope as it’s dark & cold - that’s tomorrows job) and I am 100% sure it’s outputting. I have been able to place the detector at a specific point and get stream of random data.
Tried inverting and removing the parity bit, and printing to the console. It’s all garbage. So, it is up to the scope to tell the tale tomorrow. I’m hoping as you suggested to wiley in another post, it’s some sort of ringing or other.
I will post scope traces tomorrow… I feel I’m close…
Just to point out that you inverted the comparator, thinking it was wrong. If the meter transmits its data by breaking the transmission of the 26 kHz carrier, the design (and the decoding) was right in the first place, and inverted logic will produce garbage data.
That sounds like your USB outlet isn’t capable of powering the Arduino.
I don’t think that should make much difference to the amplifier stage, though. The front end breadboard ought to work - the LM358 is specified down to 3 V, but the comparator voltages change, so my simulation says a bit more signal is needed for it to slice cleanly.
I was taking supposed 5v from the arduino. Anyway that’s all solved now… the circuit now gets 5v.
To prove I’m not crazy, I put it on the bench again. All working.
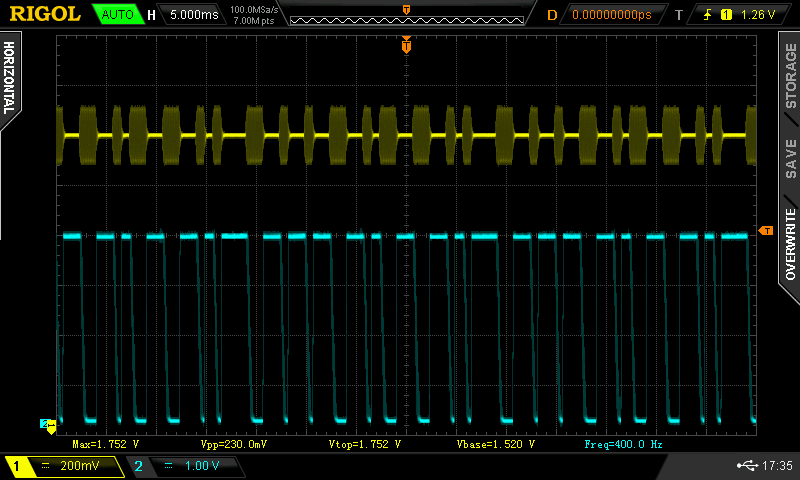
Find attached the traces.
This is a 26Khz ASK modulated wave going in.
ping6_pin7.png is the wave without any modulation, showing the amplification stage working.
postDiode.png is the rectified signal
modulated_pin7_output_pin1 is a Ask signal going in (printing 123 on serial port at 1200baud, on a 26Khz carrier)
As you can see the output is pretty much perfect, and the size of the input signal is only about 25mv pk-pk.
Judging by the time that today’s rain hit you, you’ll need to wait until tomorrow afternoon.
I’m afraid I’m running out of ideas. The reason for asking about the meter was, it’s not unknown for things like this to be not present in what appears to be an identical unit. But if you have the correct manual for your meter, and that says it does transmit the data, then we must assume that it does.
I should worry about that when you get something that looks like it out of the meter! It could be the detector capacitor that’s too big. Reduce it at the expense of ripple when the comparator is on the edge of saturation.
The rain stopped, so I interviewed the meter again.
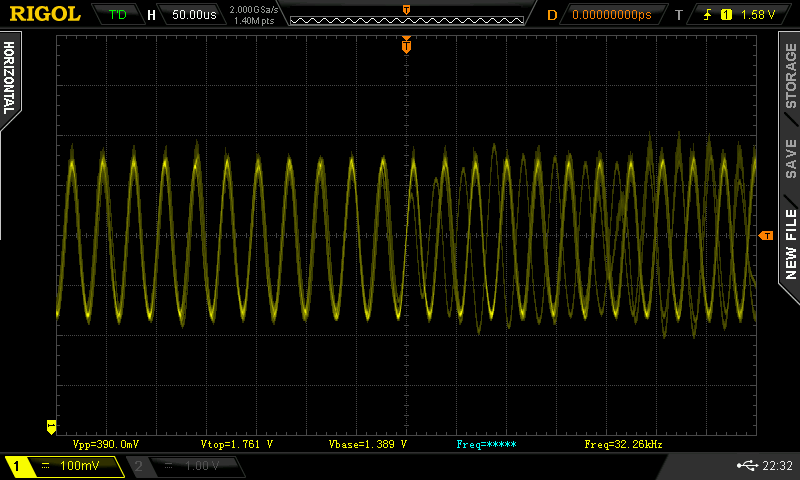
I am now 100% confident there is no inductive output on this meter, and the signal I picked up before was from the LCD display (a 32Khz waveform, attached). If the detector can pick this up, but no where anywhere else on the meter any signs of life, then it must not exist. Re-reading the meter documentation, it states the inductive serial port is optional. Grrrrr. Other spec sheets list it but do not mention optional.
Oh and looking at the picture in the original thread there is something written ‘REPORTER’ - just below the right screw. I’m betting that is the inductive serial port. Mine does not have that marking.
So it seems all this was in vien. Except it wasn’t.
Personally I learnt (and relearnt a lot). Having Rob explain to me the circuit, how opamps work, how the various LC components work and all the intricacies really educated me, and I hope others who stumble along this post. Above all it was super interesting.
I learnt how to use my new DSO scope (a leaving gift from work - thanks guys) and how to better use my trusty analog scope too. I learnt how to use my £43 sig gen to do AM modulation. Hell in the process of this experiment I even learnt to love doing molex connectors (previously done with long nose pliers until someone introduced be the Engineer PA-09 crimpers - what a tool!).
Rob, I’m deeply grateful for you spending the time to hold my hand and do the LT spice simulations.
I really hope this thread will help others as at least the circuit diagram is there and maybe give others some ideas.
Now, I need to start again and try to understand how I can get meaningful data out of the IR port…
I’m sorry it ended this way, but thank you for the kind words and I’m glad you got some benefit from the project, even though it wasn’t what you had hoped for.
I have the Ampy 5193A meter with “optional inductive data serial port”.
I will be having a careful look for the word ‘REPORTER’ just below the right screw, though I have a feeling I read this thread and did just that a couple of years ago. I can’t remember the outcome, but lack of progress on my part may mean the outcome was doubtful. I can’t be sure though. Mostly I think lack of my progress then was due to not being able to find enough information on a working build, hence the summary of everything I have found in the points above, given below which I think suggests a build is possible.
Hopefully this summary will be of benefit to others coming after me.
Please correct me if I make errors.
Here is my list of things to do
Check if your meter has the “REPORTER” stamp on it just below the right screw
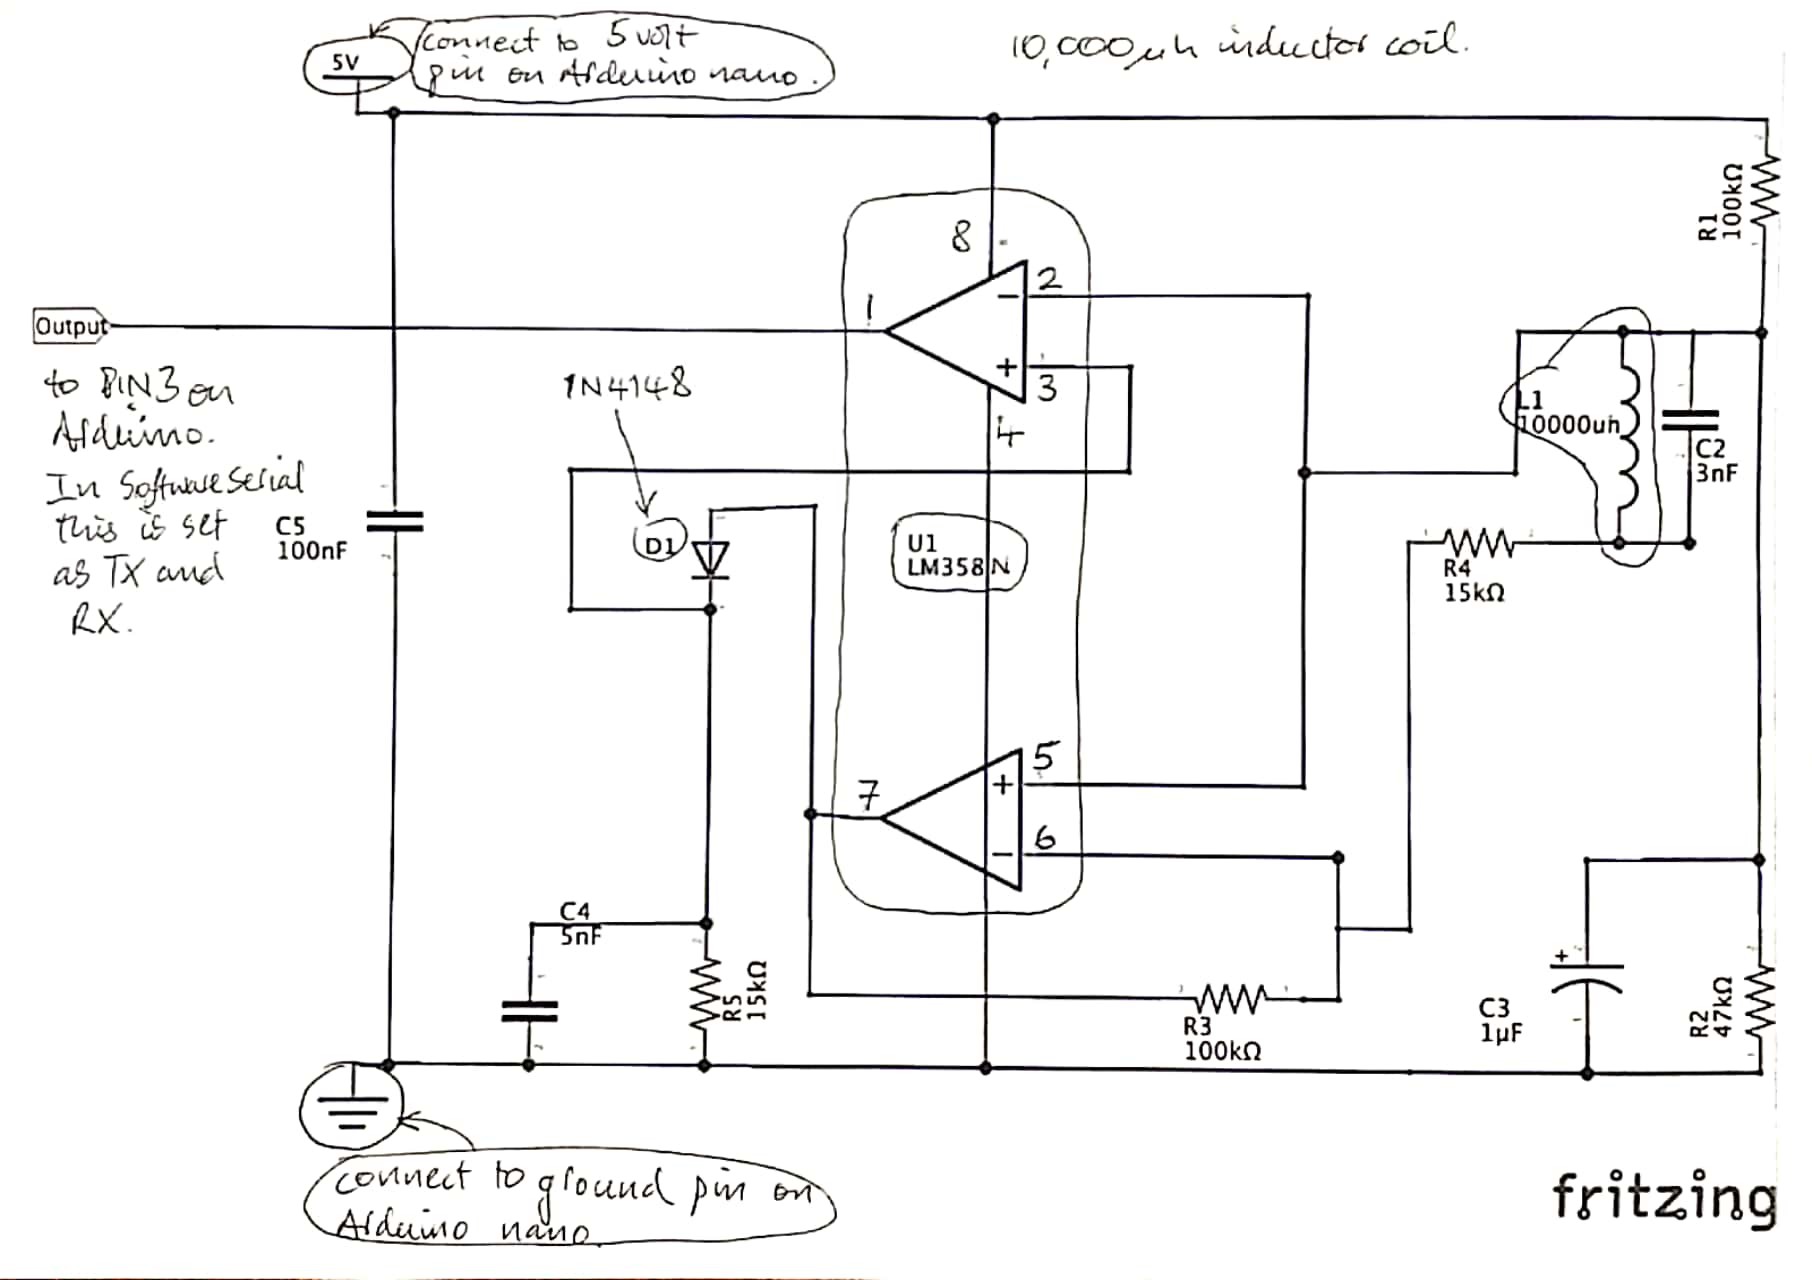
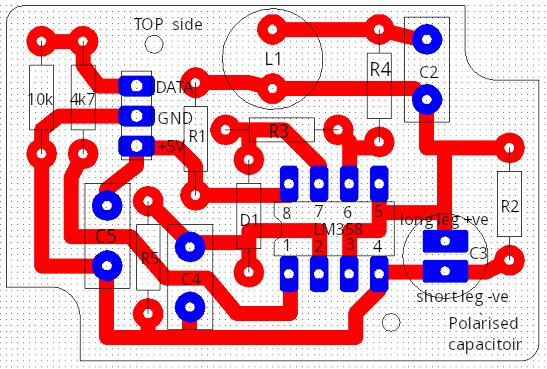
But then there is also this from “MartinR” in the original post which is shown below. I have annotated the PCB drawing below, using the original photo. I’ve forgotten all my electronics, but will have to figure out why MartinR has two extra resistors on the top left and the above drawing does not.
Note that as this thread in this post points out the connections to pins 2 & 3 can be swapped. This is why the above diagram shows them swapped compared to the below diagram.
Note also the two extra resistors, in the top right of "MartinR"s PCB design; one between the data line and ground (10k), and the other between the data output on the OpAmp, pin 1 and the data output port pin (4k7). Anyone any ideas why Alan didn’t have these and MartinR did, and are they necessary?
photos of my meter taken this morning (1/8/2021) clearly showing the word “Reporter”. I saw no dot or spot on the side indicating where the inductive serial port may be. Of course it may not have one. What it does have, on the front, as we see from the photos, is a optical Tx / Rx port on the front and a blinking red led (top right). The led blinks 1,000 times per kWh used and I built a circuit with an LED counter onboard to count these, but it failed becasue of the transparent perspex meter cover which caused too much light leakage from the sides, otherwise that would have been enough. I have a sneeking feeling that “reporter” for this meter may mean capiable of reporting using the Tx / Rx optical meter. We will see … The lack of a dot somewhere on the side makes me wander…
I’m going to sketch this out on kiCAD. I’ve used it a long time ago and as with these things the exausting hurdle is always in getting it installed and operable. Installing it is easy. But getting the libraries for the parts not so easy, until you have made all the configuration mistakes I have just made. If you are on Arch Linux like I am then here are the packages you should install
sudo pacman -S kicad kicad-library kicad-library-3d The last package is a fair size, so it may take a while to download. Without the kicad-library package you have no parts, so it is essential. How you do this on a pc who knows.
The kicad web pages for the libraries are here and here but it is much easiear to simply load up the default packages from the Arch repository as above.
If you mess up your initial set-up, as I did, you clear out the initial kicad config files with this one liner cd $HOME/.config/kicad/; ls -la; #rm fp*; #rm sym*; ls -la. Remove the #'s to get it to delete these config files.
Once you have kicad loaded and start creating a layout simply accept the default values for the already installed libraries.
I will post the design files after they are done, though I will proof it on vero board first (still no idea if the meter has an induction serial port, but I will find out)
I’m afraid I disagree. As someone who had to deal with too much spam that got in with the old forum software, I’m glad this software has mechanisms to limit the amount of spam. It means we can spend more time helping the people who need help and less time dealing with those whose only aim is to cause mayhem. If you’ve read the FAQ, you’d have seen that all you need to do is ask.
Asserting that the limit is daft helps nobody. And it’s not a hard limit - it will self-adjust as the system learns that you’re a responsible poster and not a spammer.