I think we can live without the daily option for now, if that makes life easier.
Also, while I think of it, the date selector seems to be stuck on 05/03/2023, rather than being today’s date?
I think we can live without the daily option for now, if that makes life easier.
Also, while I think of it, the date selector seems to be stuck on 05/03/2023, rather than being today’s date?
Done ![]()
Note: I’ve only made this available for periods less than 120 days in length as it uses quite a bit of server processing power to calculate these daily averages. It’s not doing any caching of the calculation so recalculates from whatever the base feed interval is every time… you may need to zoom in to a period to see the temperature data…
Should we remove it? or leave as is?
So it is, will take a look at that
Fixed this one.
Maybe it’s best to remove the daily aggregation, as it’s not nearly as useful as I thought it would be. Keep things simple, eh?
Sure will do that.
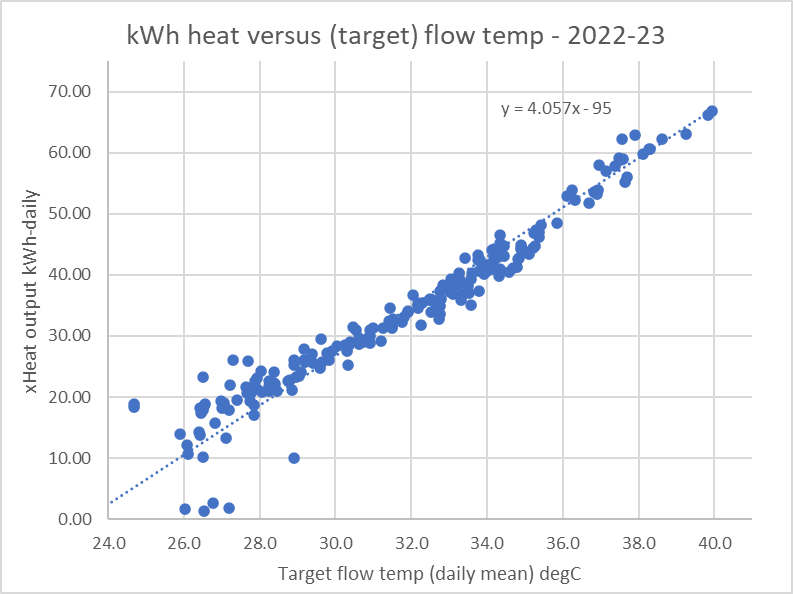
Hi - very impressed with all the work on heatpump monitor, and I like the graphs in particular. Adding to your (no doubt) long list of ‘nice to haves’ could you add the design flow temperature as a ‘colour coding’ on the graphs. Since this will influence the sizing of radiators you might guess that this would be a significant impact. I guess fairly obvious but it would be useful to see.
Thanks @JackHolly good idea, I’ve added it to the issue list: Comparisons of performance vs design flow temperature · Issue #25 · openenergymonitor/heatpumpmonitor.org · GitHub
I’ve moved the grid profiles and aggregation posts to a separate thread here so as not to have too many different topics in parallel: https://community.openenergymonitor.org/t/heatpumpmonitor-org-grid-profiles-and-aggregation
And another thread for other heat pump trials: HeatpumpMonitor.org: Other studies and comparisons
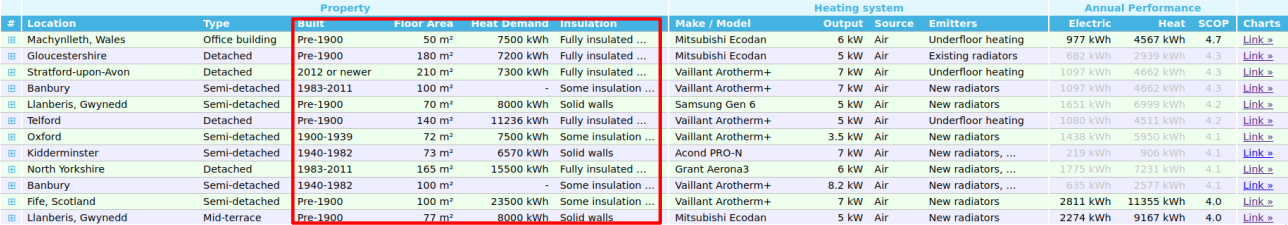
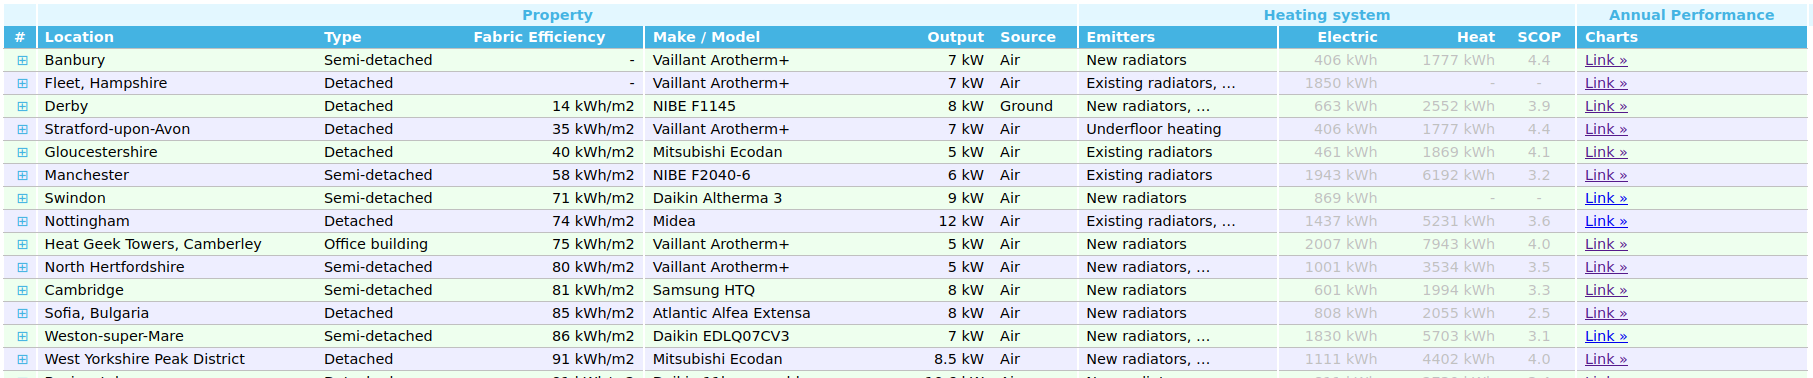
Wondering if it might be worth replacing these columns on the front page with a single fabric efficiency figure expressed in kWh heat demand/m2?
Which would look like this:
Does that remove too much useful information from the list? those columns would be accessible via the expand for further info button…
is it a worthwhile change?
I guess in the context of a prospective heat pump purchaser casually looking at the dashboard and hoping to find a ‘match’ for their own property, a single figure for Fabric Efficiency is probably more difficult to relate to than the existing, more descriptive columns.
Having said that, for a more ‘technical’ audience, I do like the normalised efficiency metric…
Thanks @dMb I’ve added an option to show this view for now with a checkbox at the bottom of the page, I’ve also included kwh/m2 electric for interest.
This is really useful - thanks!
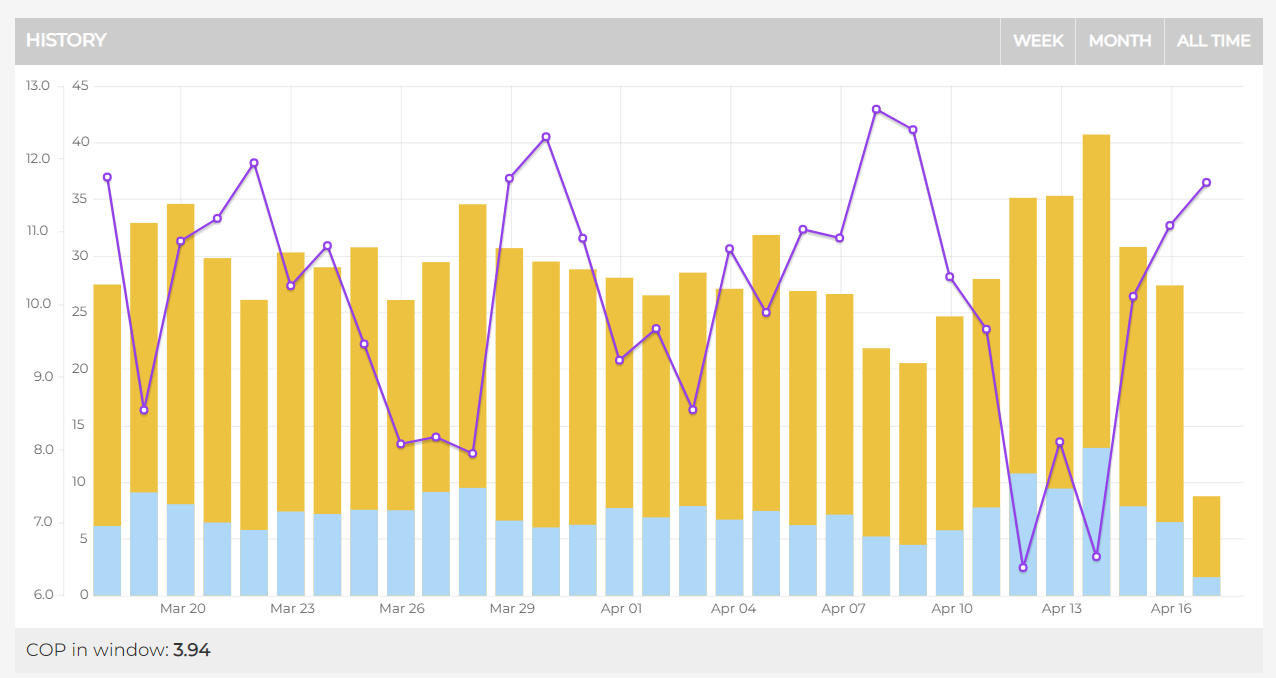
I’ve just turned my heat pump off at the isolator switch because I’ve not needed any heating since 3rd April and DHW is consistently being covered by the diversion of excess solar PV generation. I’ll turn it back on in Autumn.
My NIBE F1145 GSHP consistently draws 1.1 kWh per day (about 45 W) when in ‘standby’ (with no pumps running) so that’s money and carbon I don’t want to be wasting. This explains why my system’s 30-day COP is so bad but my daily cost is so good.
I want to ensure I don’t mess up the long-term stats on HeatpumpMonitor though:
The Heat Meter and Electricity Meter are still reporting ‘real’ readings so that’s all good - they’re just showing no electricity consumption and no heat output.
A potential issue is the temperature readings - those are sourced from NIBE Uplink and since the heat pump is switched off it’s not sending any updates. The way I report the data to emoncms means I’m effectively sending the last ‘real’ reading (from 09:00 today) repeatedly - and will continue to do that all summer.
Is that worth worrying about though? If the heat pump isn’t running do the temperature readings actually matter?
hi all… my first post in this thread.
I’ve a samsung 16kw gen6, self installed (thanks glyn hudson for your video, I did watch as part of my planning). I’m monitoring it via modbus into esphome then into home assistant. I’m pushing the data as feeds into an instance of emoncms running on a debian VM in azure. emoncms heatpump app is running and shows my data.
at the moment my emoncms’s http server is locked down so only I can get to it from my static IP at home, I’m not going to unlock this to the world until I have a handle on the “make public” part?
I’m a bit puzzled about how the “make app public” button works and what is actually required from the point of view of open ports, web server configuration etc? I couldn’t find docs about this part, can someone perhaps explain? I only want to make the performance data as shown by the app public, not my entire emoncms front end, login page etc.
Also couple of feedback points about the install docs which I followed here:
https://docs.openenergymonitor.org/emonsd/install.html
I tried Ubuntu 18LTS, Ubuntu 20LTS, and debian 11 azure market place images. All failed with PHP not found errors. I’m no dev , far from it, but I was able to deduce that it was looking for PHP8.1 and couldn’t find it and had no way to get it. I was eventually able to get it working (after multiple iterations, easy in azure by just blatting the vm and starting again) by using debian 11, and adding the repository for PHP8.1 according to this: https://computingforgeeks.com/how-to-install-php-on-debian-linux-2/, installing PHP8.1 manually , then letting the emoncms scripts do their thing. perhaps something about PHP8.1 should be added to the emoncms install document and/or script?
cheers
Ian