Introducing HeatpumpMonitor.org - a public dashboard of heat pump performance

After faffing with open office calc this morning trying to create those graphs, I thought I would have a go at adding a graph interface to the site directly. Bit of a quick go at it but here it is so far: https://heatpumpmonitor.org/graph.html

I haven’t linked to it from the other pages yet, it would be nice to have a tooltip that provides all the data for that particular heat pump, I haven’t figured how to do that yet. I’m using plotly rather than flot. Im more familiar with flot but Plotly has some nice features such as better axis labelling and option to use colour scales for the plot.

5 Likes

Tooltips are working…

Not really that strong…

1 Like

good point!

1 Like

COP correlation with return temperature is a bit stronger than flow temperature:

2 Likes

I thought it might be interesting to compare our results so far with those from the Energy Saving Trust ‘The Heat is On’ Phase 2 Trials. Their detailed analysis is available here: https://assets.publishing.service.gov.uk/government/uploads/system/uploads/attachment_data/file/225825/analysis_data_second_phase_est_heat_pump_field_trials.pdf

One of the things that their work and report is very good at is defining and collecting data on different system boundaries. It’s something I’ve been aware of for some time having read their report years ago but it’s something we haven’t been very clear on yet on heatpumpmonitor.org.

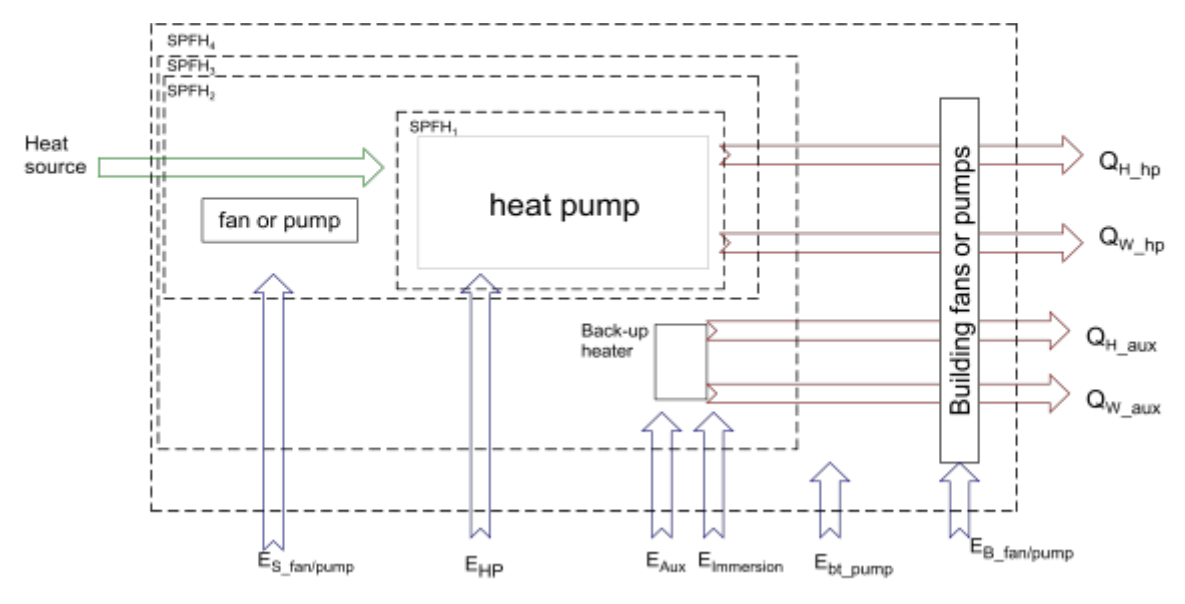
There’s a useful diagram in the report that defines the H1,H2,H3 & H4 boundary (the accompanying discussion is also useful and worth reading). There’s also a further system efficiency boundary that measures the heat output at the domestic hot water outlets rather than the heat input to the tank.

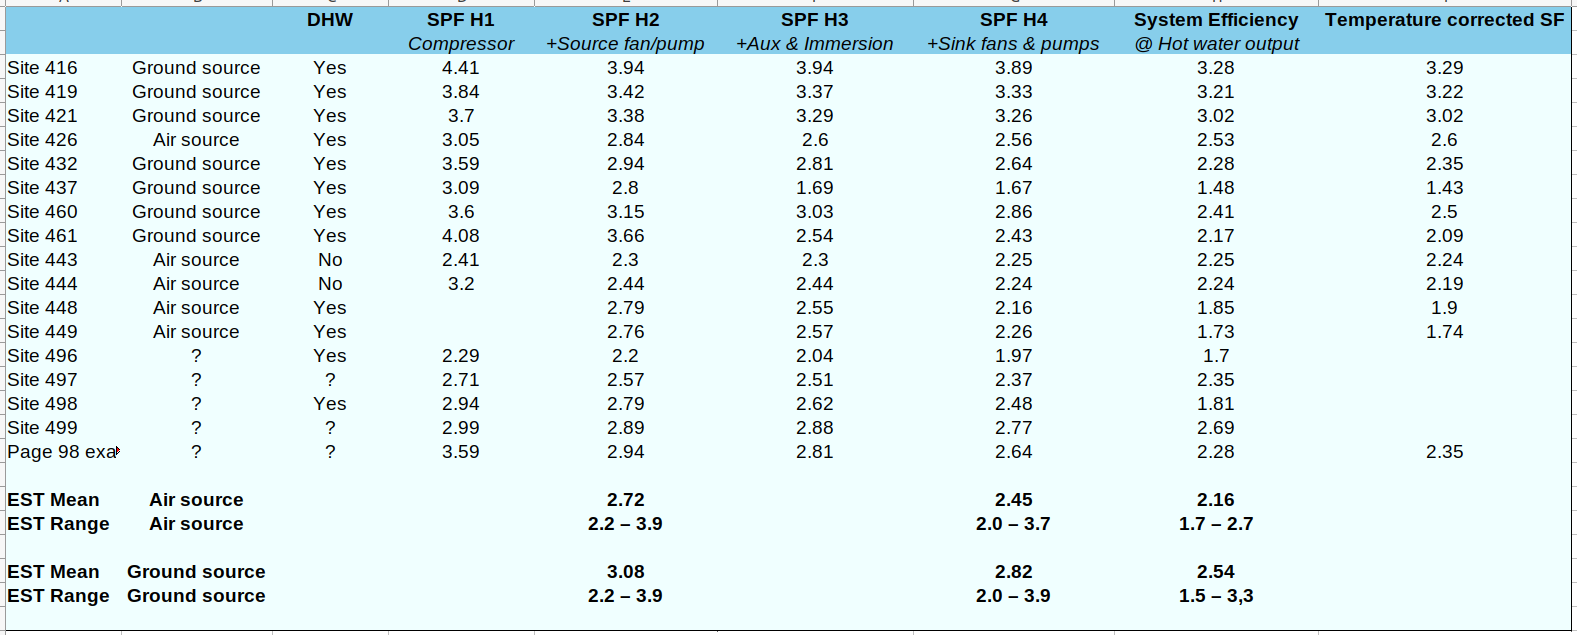
Trawling through that report, I extracted the following table of values for the subset of heat pumps they discuss in the report. Does anyone know if the original data can be downloaded somewhere in full?

The table shows how the SPF figures change with different system boundaries and the results are quite interesting! The drops from H1 to H2 for some of the ground source systems and difference between H1 and H4 can be surprisingly high!

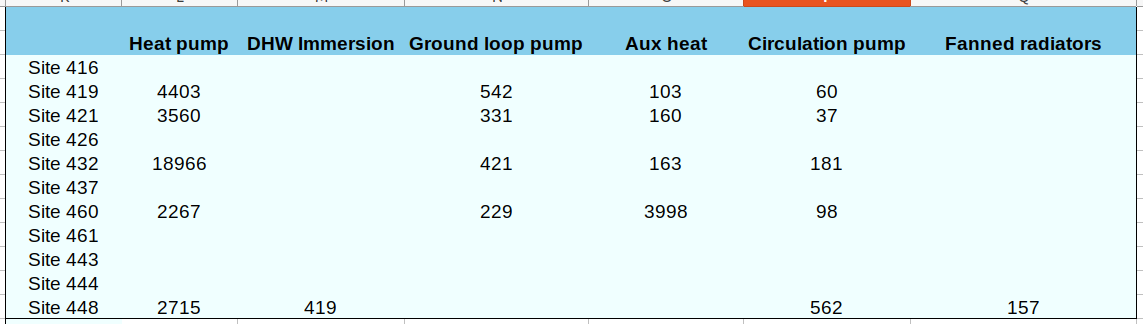
They also share breakdowns of the electricity consumption of some of the sites:

I’ve been monitoring my own system to the SPF H4 boundary with the results including the immersion heater used for legionella protection listed on my monthly summary blog page e.g: https://trystanlea.org.uk/heatpump2021. The results on https://emoncms.org/midterrace/ include everything except the immersion heater - but then I so seldomly use the immersion heater that there’s not that much difference, in 2021 the difference was 4.06 without the immersion and 4.04 with the immersion (correct H4 boundary). Still, I really need to add the immersion heater as a feed option in the My Heatpump app.

Still… my SPF H4 is significantly better than all air source and ground source heat pumps on the subset above :slight_smile: and most of the air source heat pumps on heatpumpmonitor.org have better, if not significantly better SPF H2 values than the SPF H2 values in the trial.

It would be great to be clear about the system boundaries of the data on heatpumpmonitor.org.

A slightly tricky one is how to deal with solar PV divert to an immersion heater? Should that be included in the system boundary of the heat pump? It seems like an unfair penalty for something that makes total sense economically especially if you dont have a battery to be used as a buffer for running the heat pump to do DHW in the summer…

5 Likes

This is a different dataset my chum pointed me to, but I haven’t dug into it yet.

Renewable Heat Premium Payment Scheme: Heat Pump Monitoring: Cleaned Data, 2013-2015

1 Like

Those Phase 2 trials were April 2009 - April 2010 and heat pump technology has advanced a lot in the intervening years. I regard my GSHP, installed in 2015 as ‘old school’ because it doesn’t have an inverter drive for the compressor and is only ever On or Off - but that was standard for GSHPs in 2015. The use of older technology in those pre-2009 systems will account for at least some of the differences in performance.

Thanks @MyForest ! there is so much data available for that study! including a 1GB+ download!
This detailed analysis report by UCL that was part of the study is really interesting, I’ve only skim read the head line results so far: https://doc.ukdataservice.ac.uk/doc/8151/mrdoc/pdf/8151_decc_rhpp_detailed_analysis_report.pdf

The summary of results are given on table 1:

and a comparison with the EST trial in table 2:

That’s a pretty decent sample size and such poor results even for the H2 boundary! :thinking:

A quick look at the mean for the 23 heat pumps on our heatpumpmonitor.org page, suggests at least a SPF H2 boundary mean of 3.56 (with a range of 2.6 to 4.7). Median of 3.6.

We dont have a full year of data yet for most heat pumps and Id expect a reduction in COP over the summer given higher standby and higher proportion of DHW, so it will be interesting to see where the figures come out at.

2 Likes

Yes, Im not totally convinced yet that it’s better technology though happy to be proven otherwise. The RHPP trial a couple of years later seems to have worse H4 boundary performance for the ASHPs, though better H5 boundary…

I wonder if most of the difference between what we are seeing and these trials, is that we are a selection of highly engaged users? Taking care to understand and drive the heat pumps in such a way as to get higher performance?

I wonder if there are any more recent trials? say 2017-2019?

1 Like

Looking at the RHPP trial ASHP H2 Histogram, there are a few heatpumps getting SPF H2 4+ and a few more around 3.4-3.5

1 Like

Perhaps something to be added to the dashboard - a “How much do you tune your system” 1-5 scale perhaps.

This seems to be borne out by the dashboard - at first sight it looks like those engaged in tuning get better SCOP (which is not unreasonable).

Perhaps also an installation rating “How would you rate your installation” - subjective but will probably give an idea if the issue is the system itself or how it has been installed/configured.

2 Likes

Yes that’s a good idea.

Found another trial carried out by Mitsubishi themselves, published 2013 and audited by the EST that achieved an average SPF H4 of 2.9 across 23 sites, though I cant find much more detail on it apart from this press release: https://www.aspenrenewables.co.uk/file_upload/ecodan-trials.pdf

This report for/from RECC published in 2021 seems to give a good overview of the different trials: https://www.recc.org.uk/pdf/performance-data-research-focused.pdf There seems to be another more recent trial by Ofgem, based on RHI / MMSP data, I think the date is ~ 2018/2019 :

The Ofgem dataset results do not all conform to a specific boundary. Most are likely H2 but some may well extend further e.g to include the circulation pump and indoor controls, Im not sure about the immersion heater. Looks like an average of ~2.7 for ASHP’s.

1 Like

I think for me, my main motivation for heatpumpmonitor.org is to try and work out what would it take to shift the mean into the 3.5-4.0 range at least for the H2 boundary and perhaps the 3.3-3.8 for the H4 boundary? I calculated using my 2020 data that if I used my immersion heater a more normal amount e.g once per week for legionella protection that would have dropped my SPF H4 that year from 3.91 to 3.86.

I guess the other side of this is as others have pointed out, there’s also a risk of getting too fixated at trying to get the highest SPF’s/COP’s at the expense of other goals such as using less electric or using electric at cheaper times of the day, or making use of PV divert directly etc…

1 Like

Surely that goes hand in hand - higher COP means less primary consumption no matter where it comes from?

I did a theoretical calculation for our house that suggests that if i was to zone upstairs and downstairs separately that could save electric overall even though there’s a small reduction in COP due to needing higher flow temperatures to compensate… I haven’t tried it in practice to confirm but only talking small % points…

2 Likes

The other scenario is that it might make sense if you have underfloor to charge it up at a higher flow temperature overnight at a time that’s better for the grid. That might even use less primary energy at a lower COP due potential for higher % from wind vs gas generation at peak times…

2 Likes

I’d certainly be highly sceptical that technology advances account for all the differences between that 2009-10 trial and what we’re seeing today, but inverter drive for the compressor motor was surely a game changer (since it lowers the average flow temperature, which we know improves CoP). Not sure if we have any ASHPs that are non-inverter on HeatpumpMonitor currently (do we even record that?)

3 Likes

I built a deeper slab for just this theory. I don’t think the theory holds up in practice. I find it still loses heat too rapidly and the better solution is to manage the room temp within small differences in temperature.

4 Likes

https://usmart.io/org/esc/discovery/discovery-view-detail/5325ef18-9cd1-493c-beae-e278d8998400

Nearly 750 heat pumps were installed as part of the BEIS Electrification of Heat project. You can see from the above dataset that there is a variety of different systems installed, each of these will have MMSP monitoring. Fingers crossed that this data becomes available for analysis.

2 Likes