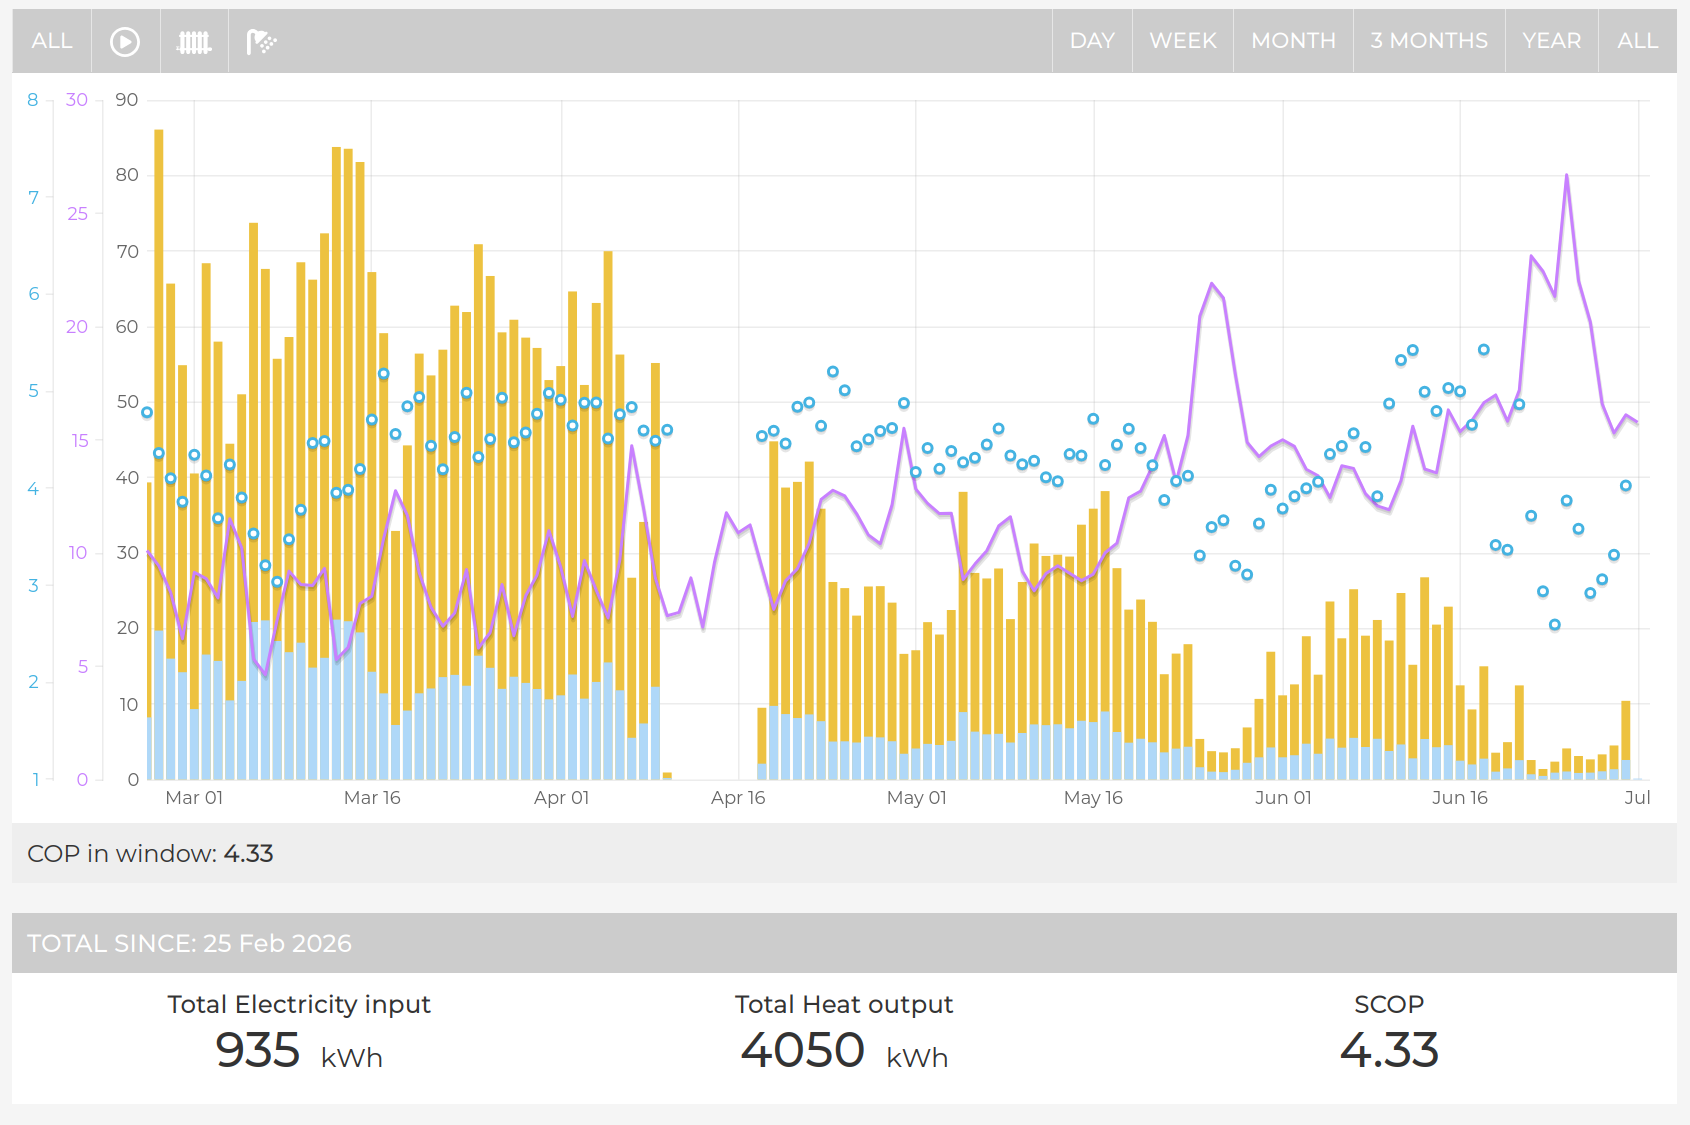
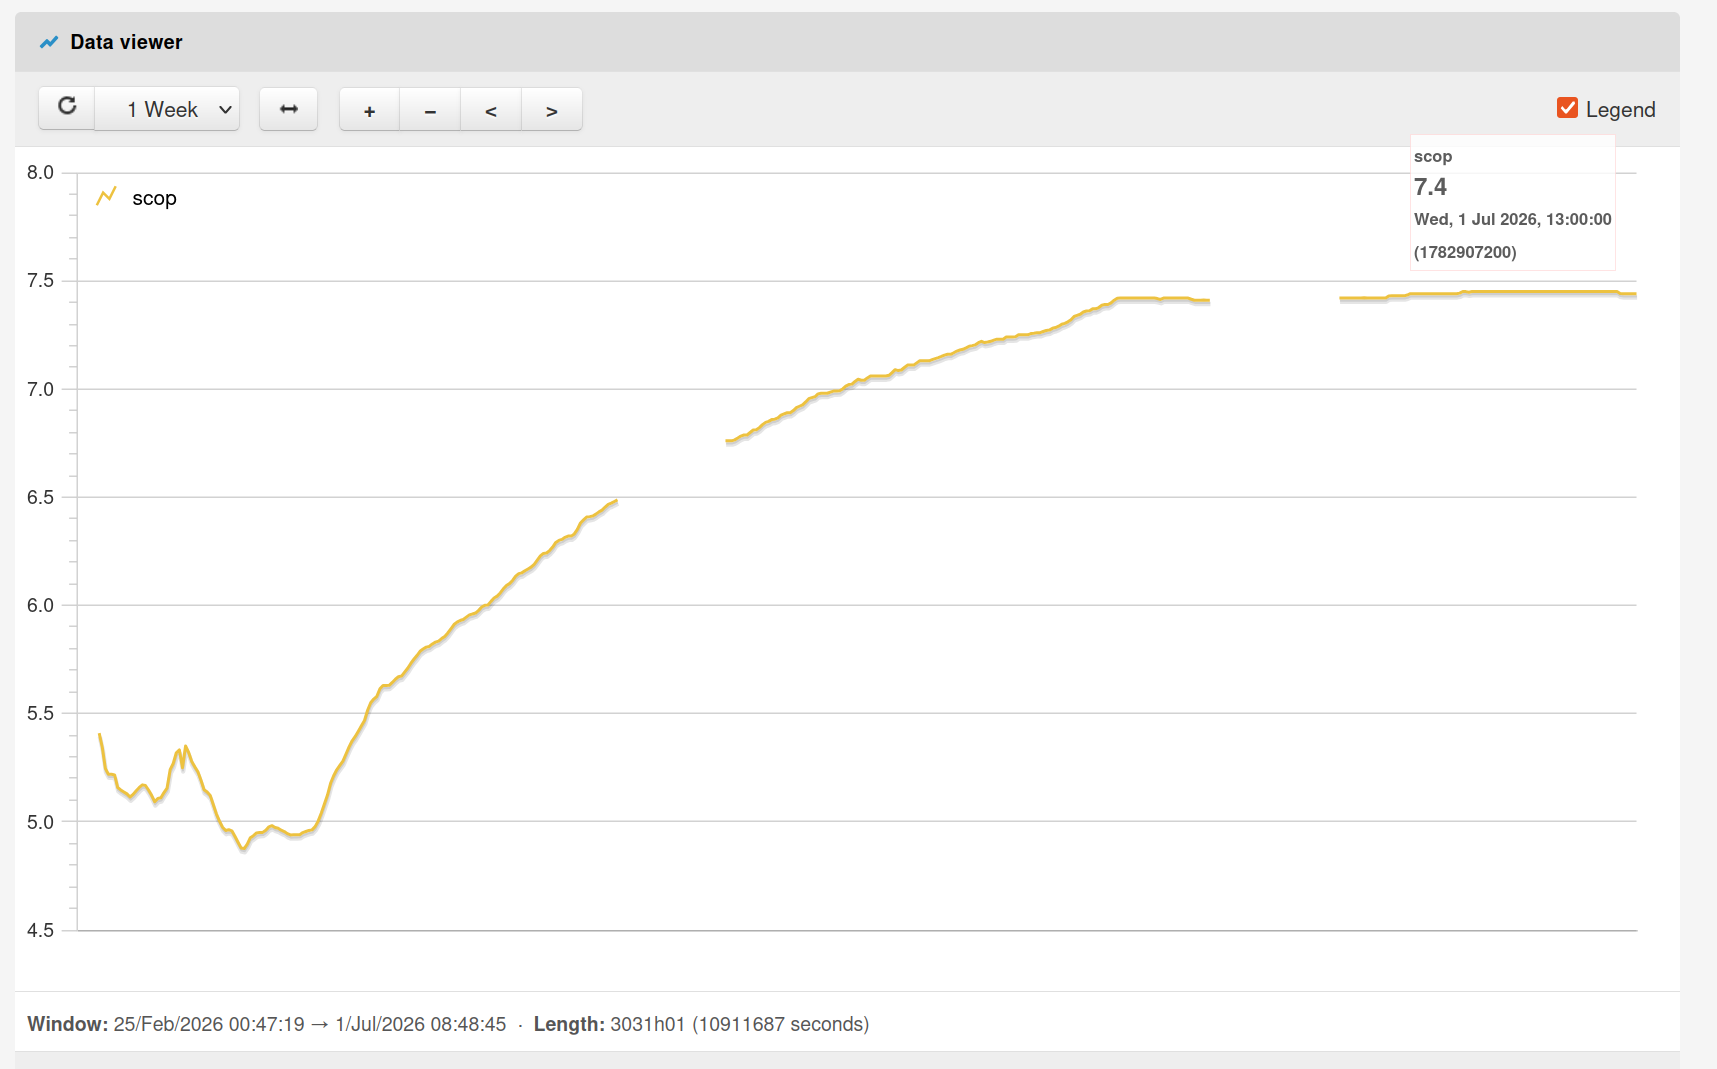
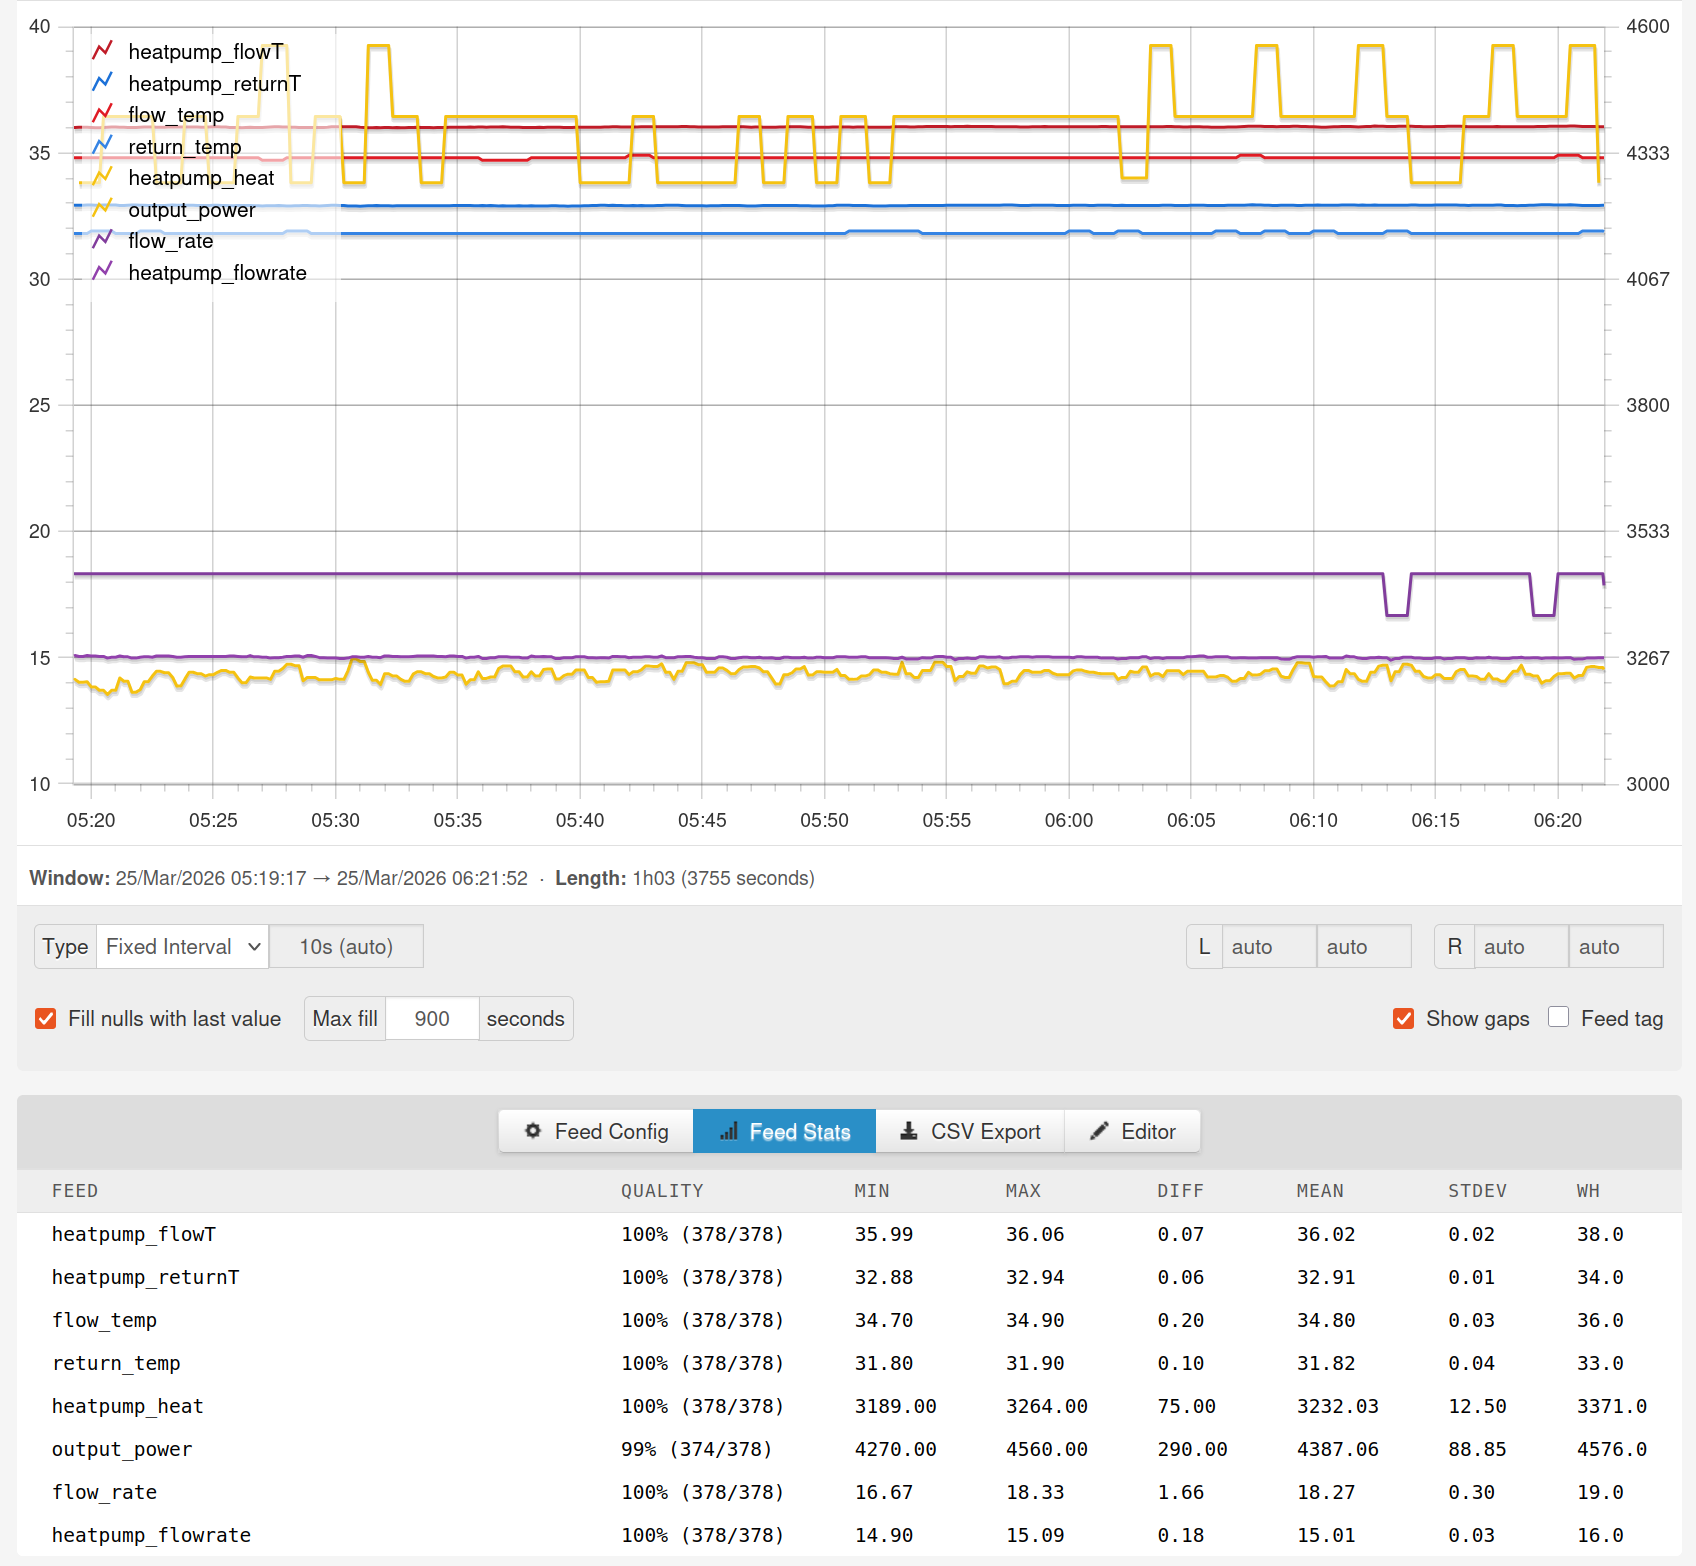
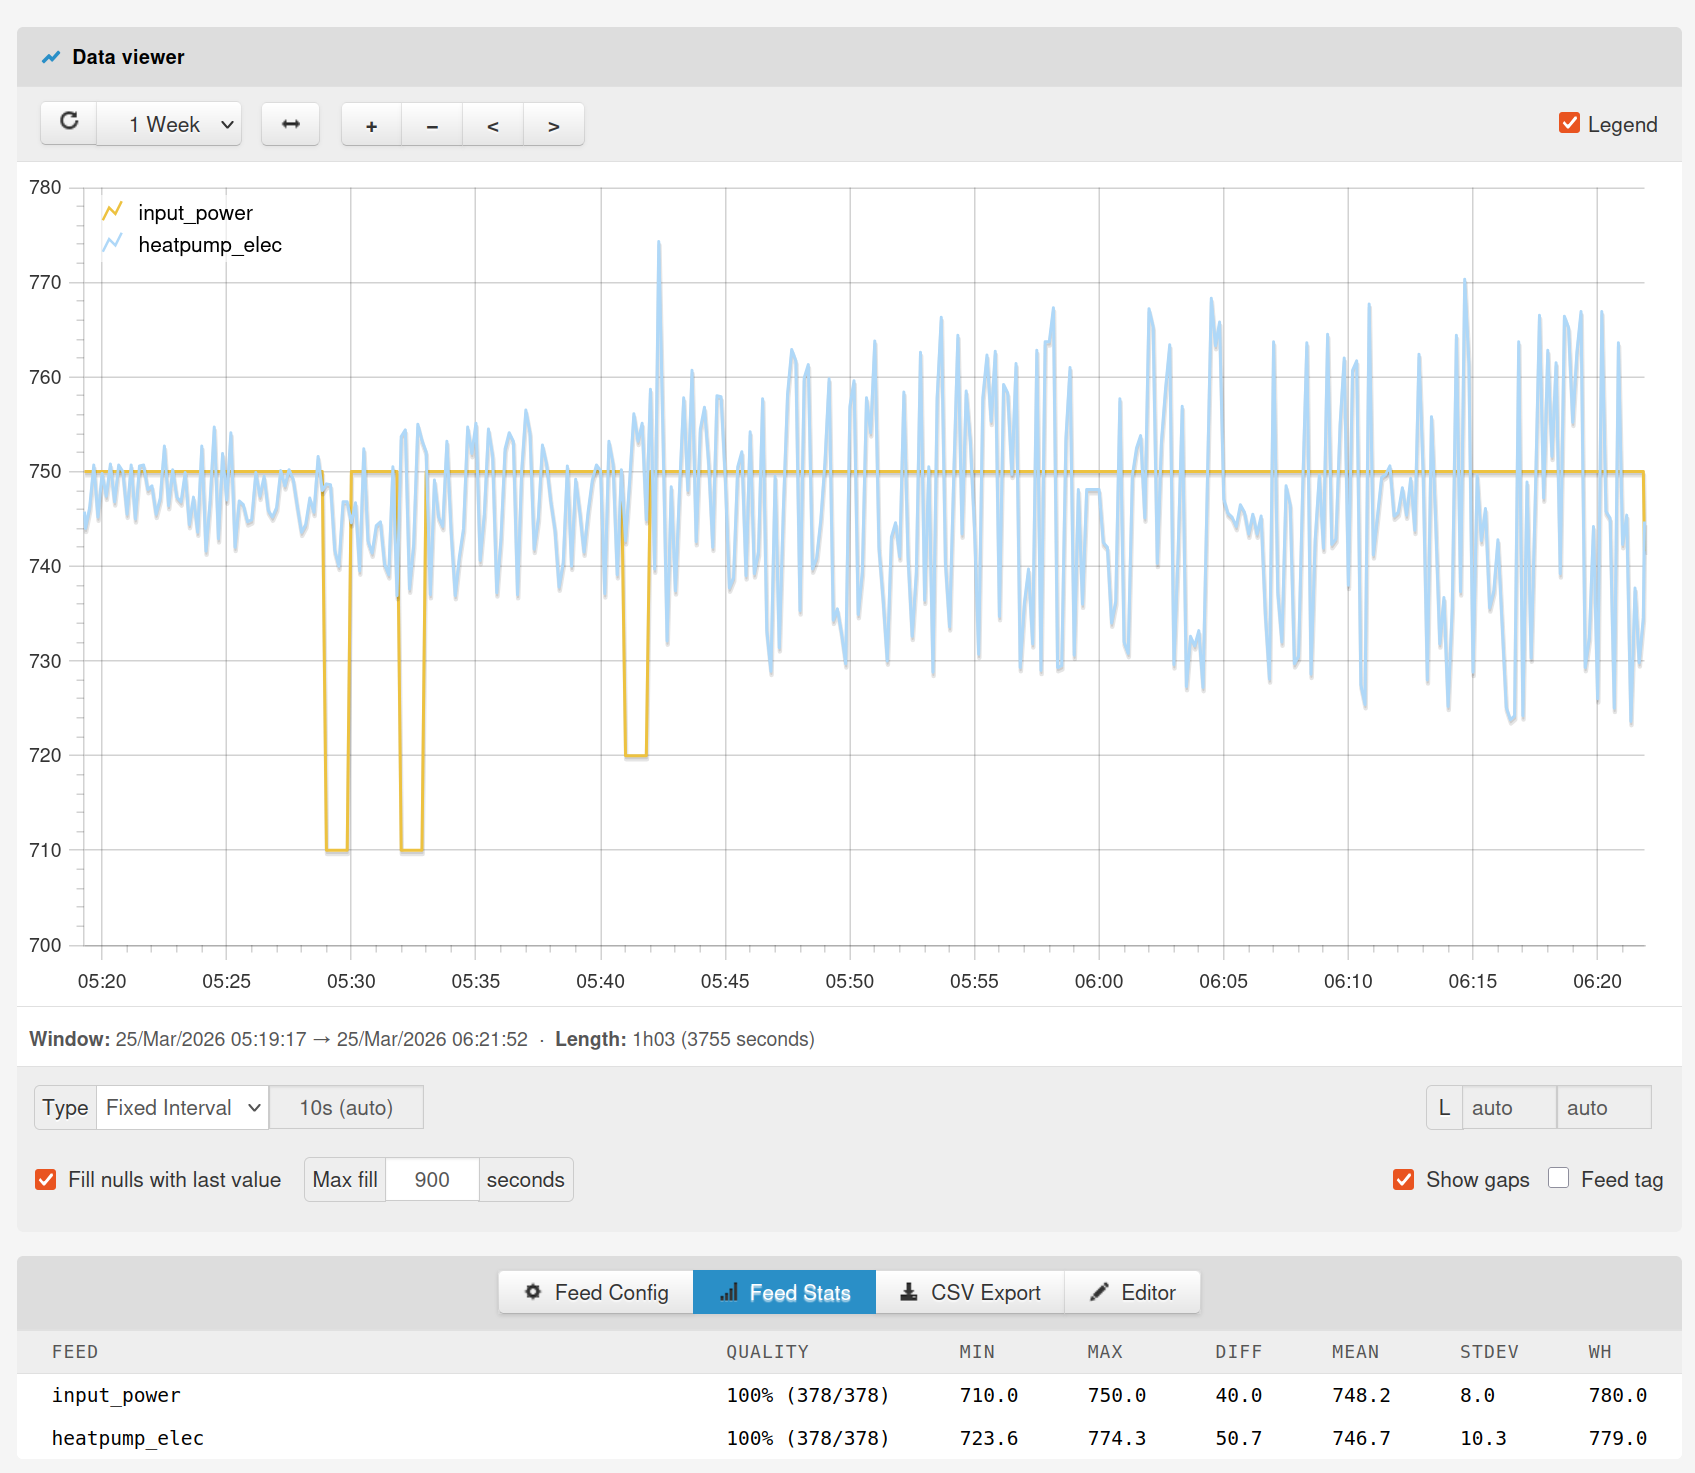
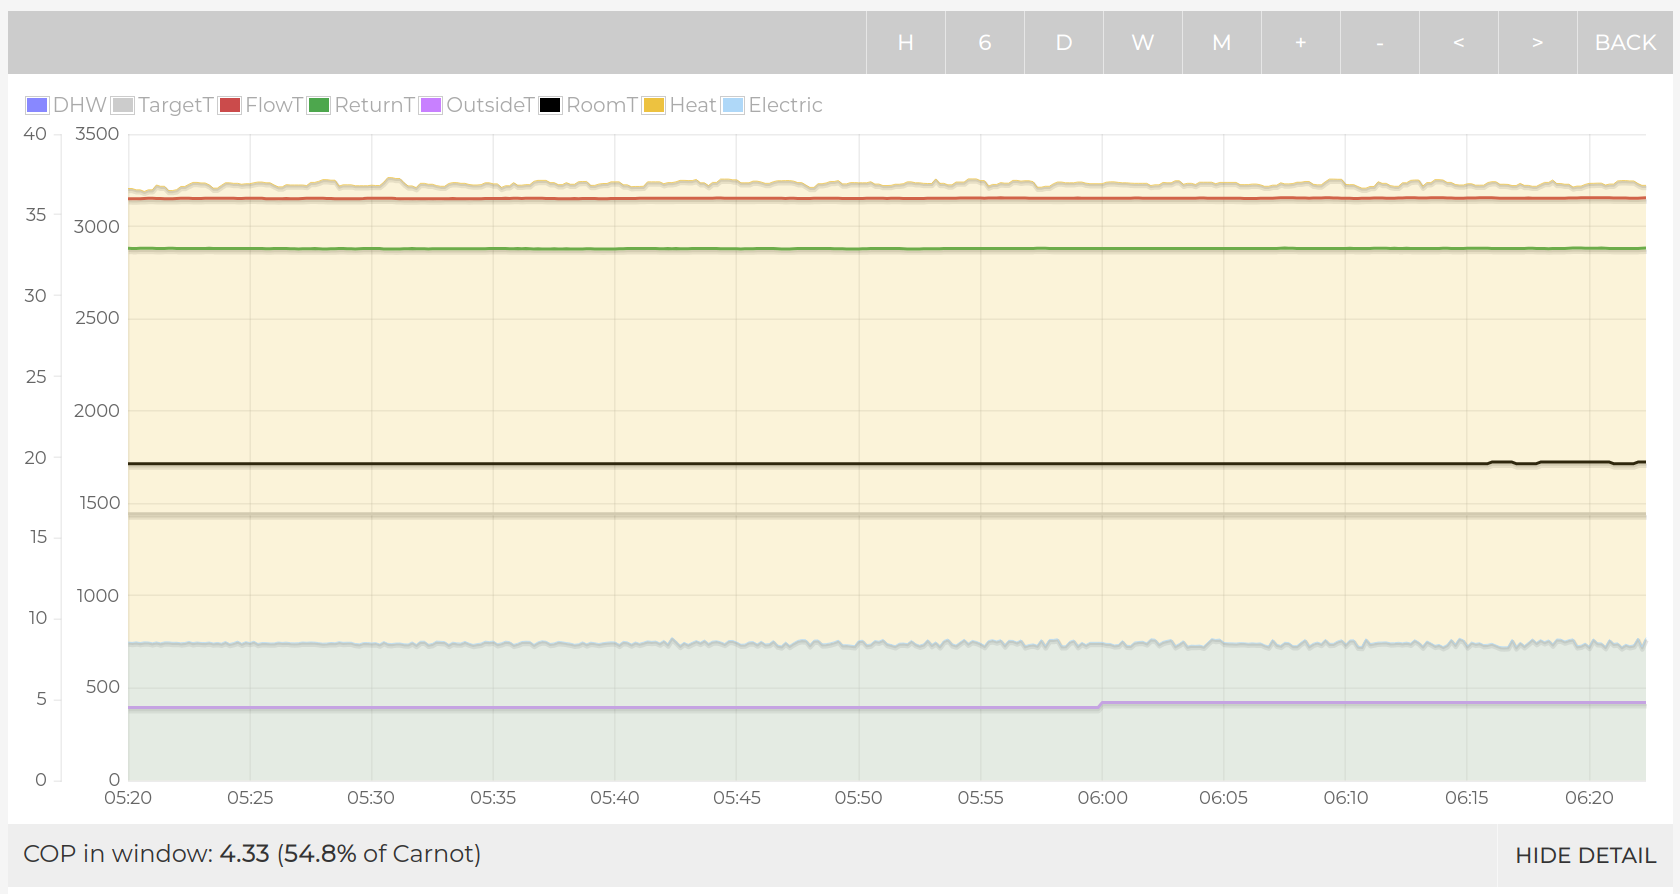
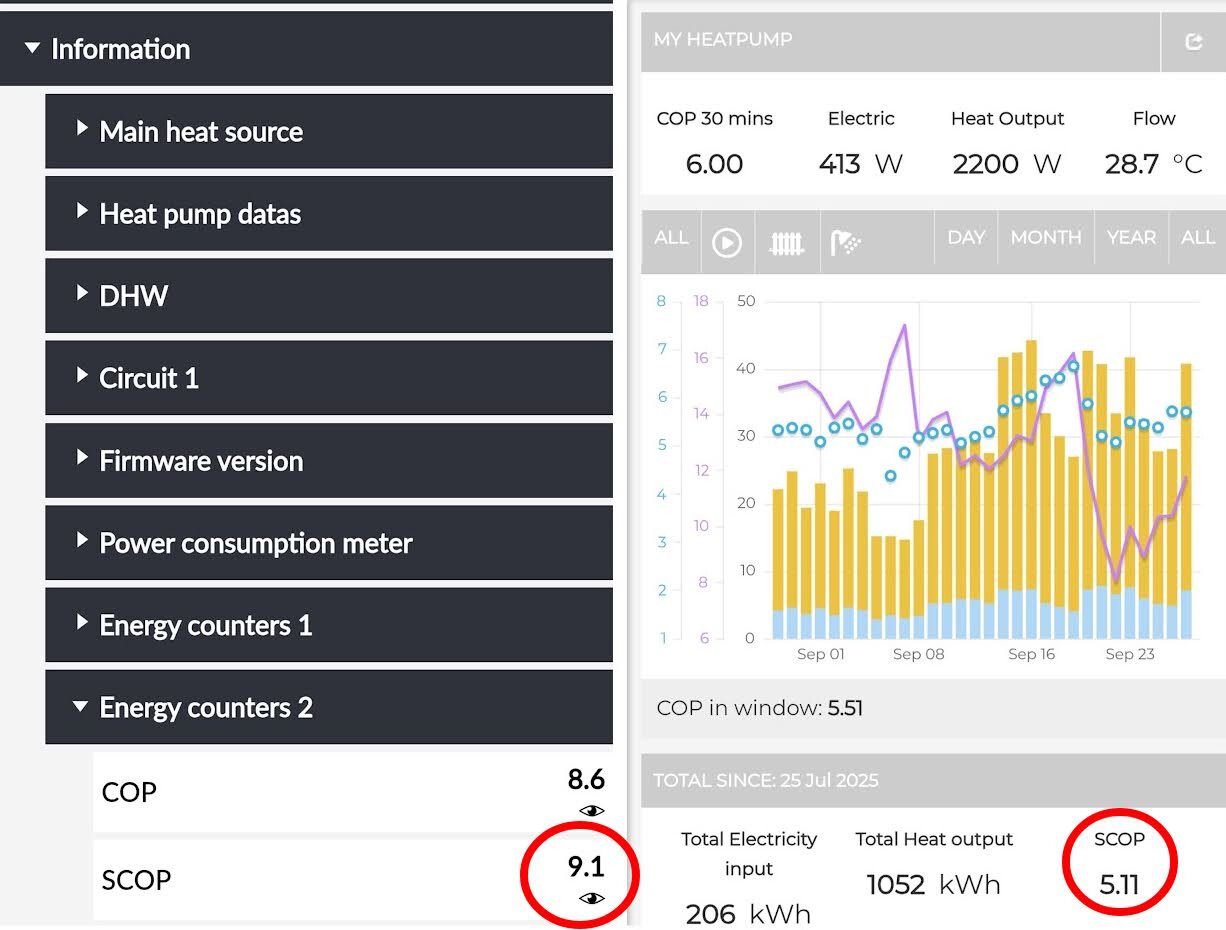
The Econet API reported a COP of 6.3 over the 5:20-6:20am period selected above, even though it’s heat output / electrical input measurements suggest: 4387÷746.7 = 5.9. Perhaps it’s doing a running average or something. The MID metering COP for the same period is 4.33.
Cross checking the % of ideal Carnot using the MyHeatpump app gives 54.8% for the MID metered performance, which is towards the higher end of the range we would expect (but within the expected / realistic range). A COP of 6.3 would be 80% of carnot which is clearly too high.
I think @glyn.hudson spotted that Grant may have removed the COP/SCOP metrics from their app and so they may well be well aware of this accuracy issue, but it’s an another interesting data point on the variability in the quality of built in metering - and as I’ve said before - I do want the quality of built in metering to improve as I think higher accuracy built in metering is the right way to scale heat pump monitoring longer term - even though that would reduce the need for our product
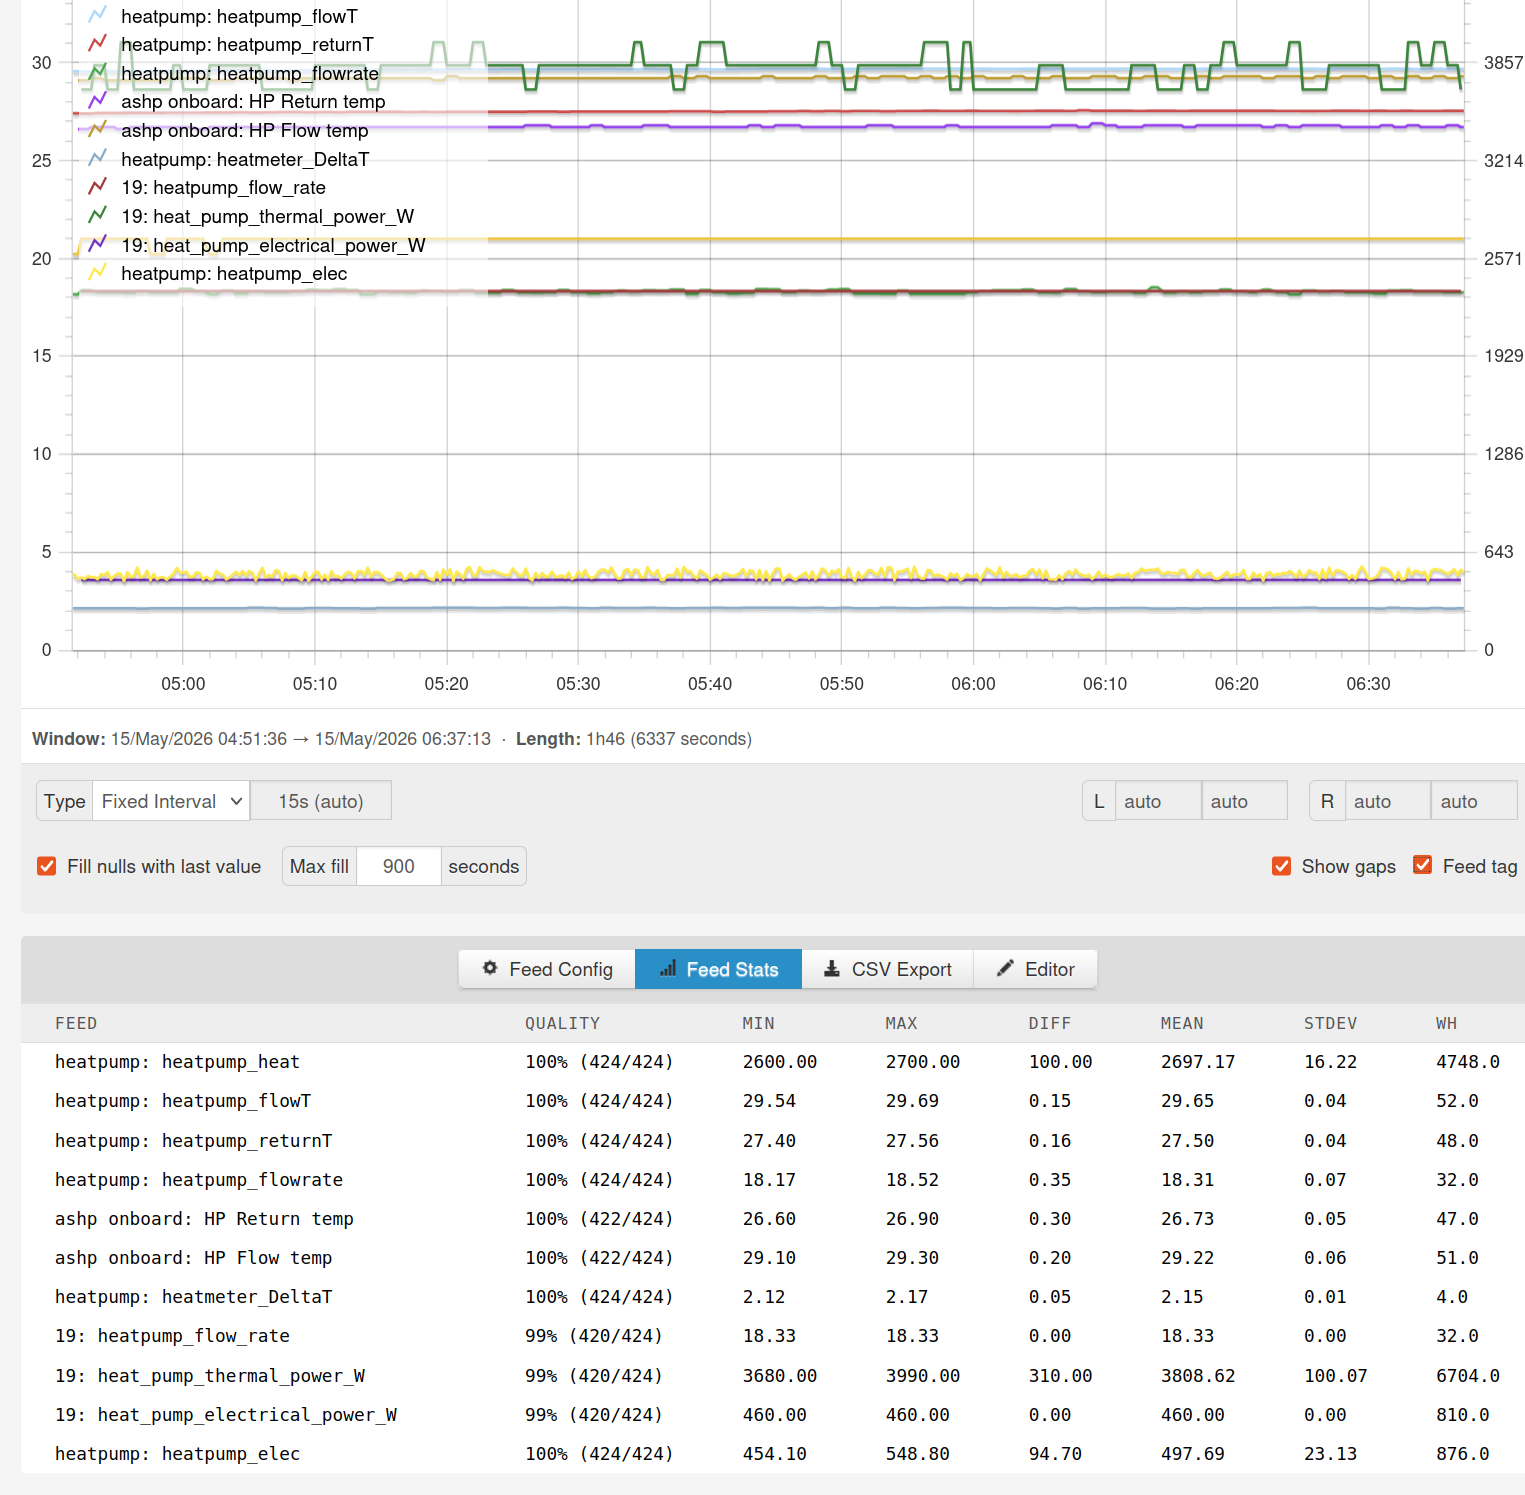
It’s interesting here that the flow rates are very similar but it’s now the DT and again the specific heat that’s off the mark.
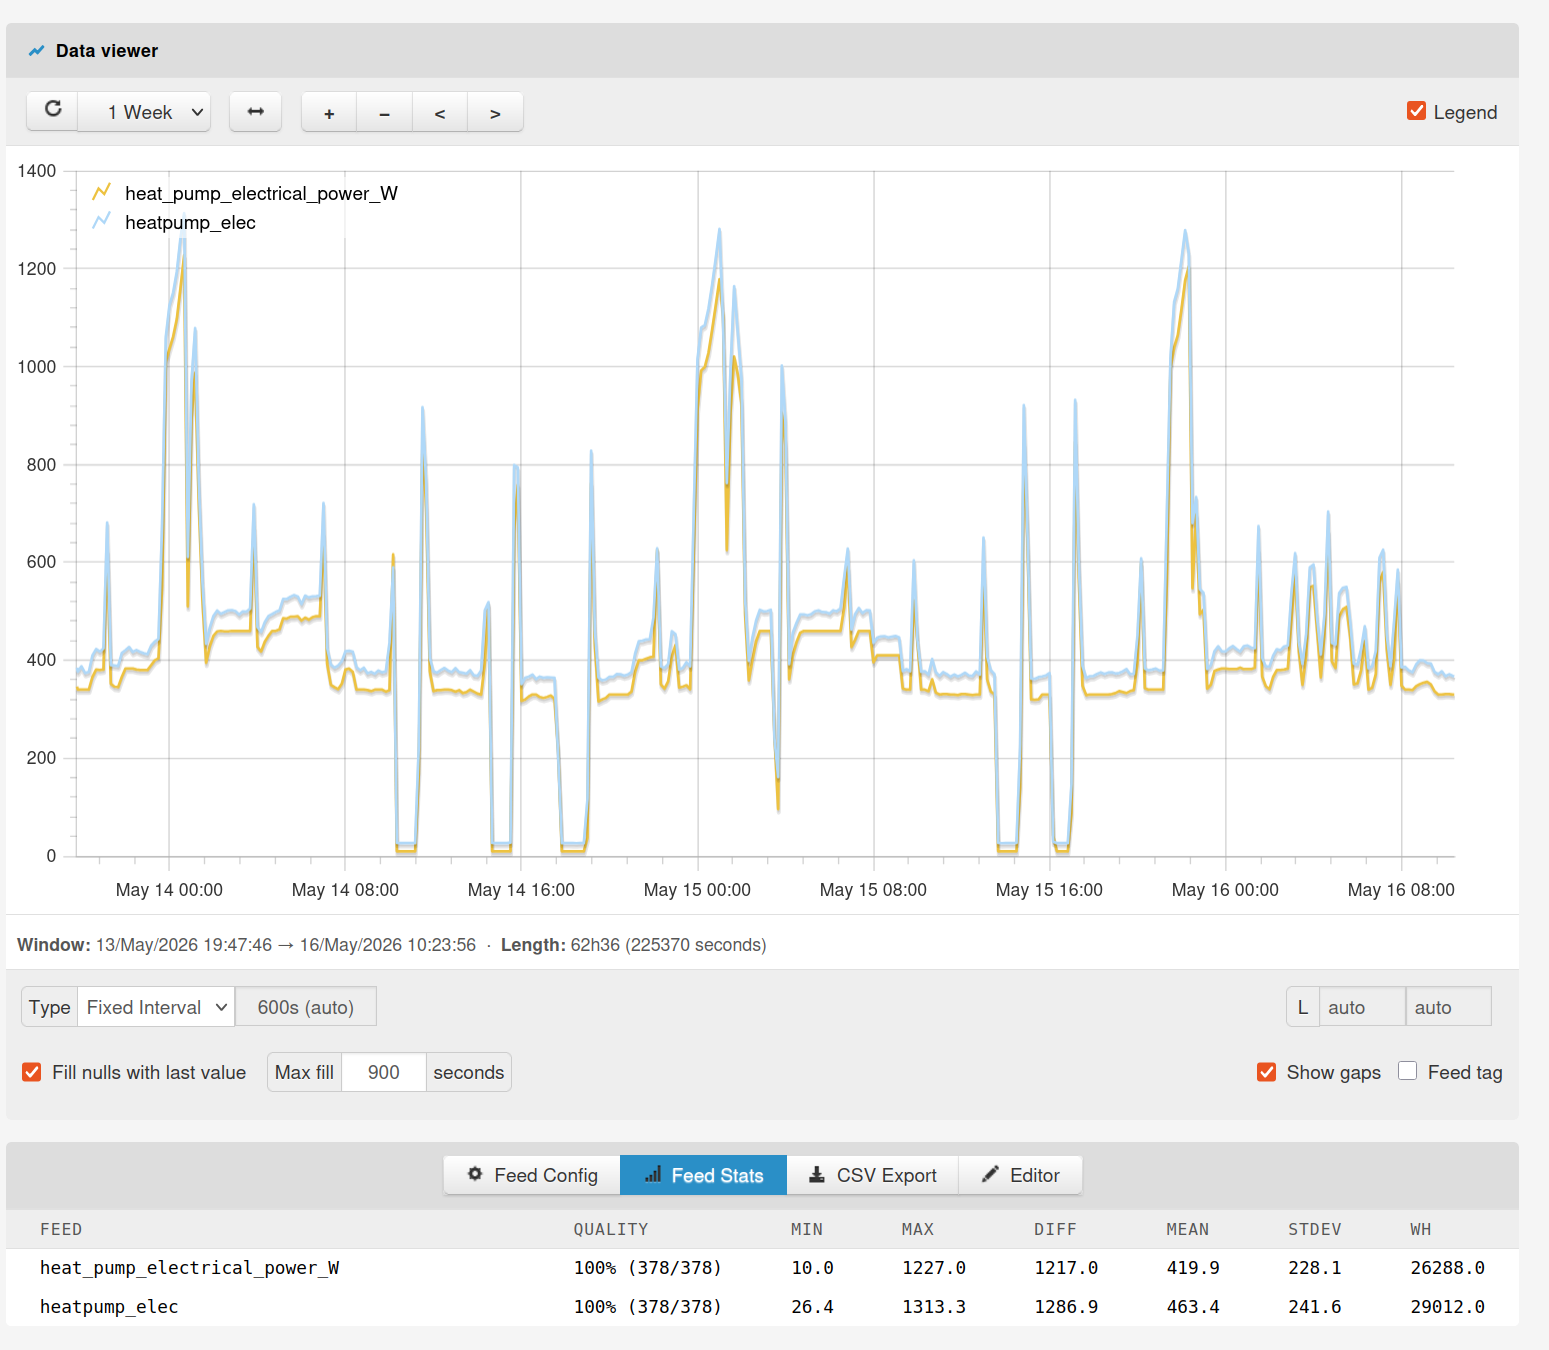
On Glyn’s system the electrical measurement has also got a greater difference, e.g in the same window above SDM120 498W, grant in-built: 460W (7.6% less). Zooming out over a longer period of time the grant is reporting 9.4% less electric consumption in this window:
Unfortunately I don’t have an Open Energy Montior setup, but I can provide a data point for your survey.
My 9 kW Grant R290 was installed with an electricity meter attached, so it has been counting the kWh since installation. I have some semi-regular readings, about once per month.
I have also been recording the power consumption reported by the heat pump using Home Assistant, and integrating that to get a measure of daily energy.
I can compare the differences in the electricity meter readings against the HA data.