First it’s great to see a company who are responsible for installation and long term after care of a very large number of heat pump installs share this kind of dashboard overview publicly. The industry needs results like this to show that results are improving vs the large scale trials such as the Electrification of Heat.
Most of the data for the above dashboard will I’m sure be based on the internal monitoring on the Cosy units themselves, Do we have any comparative data from MID metering to compare with on-board reported results?
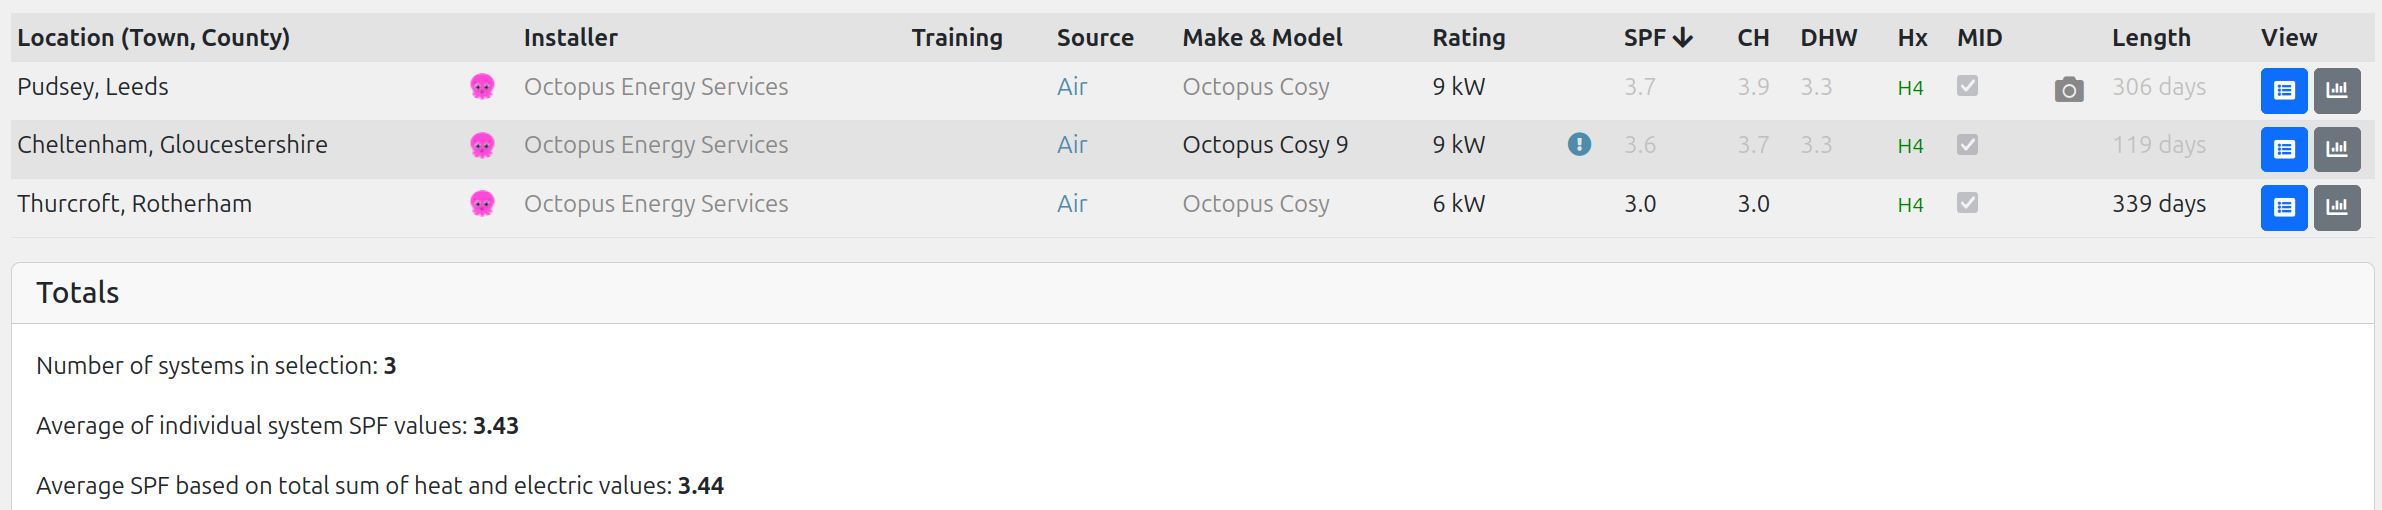
I see we have 9 Cosy systems on the site so far, all getting decent performance:
The performance of the Cheltenham one is lower than in reality due to air errors in the heat meter, the actual performance without air errors is likely to be closer to ~3.8. That would raise the MID metered average of those 3 systems to 3.5.
Does anyone have figures on inbuilt monitoring results vs MID metering?
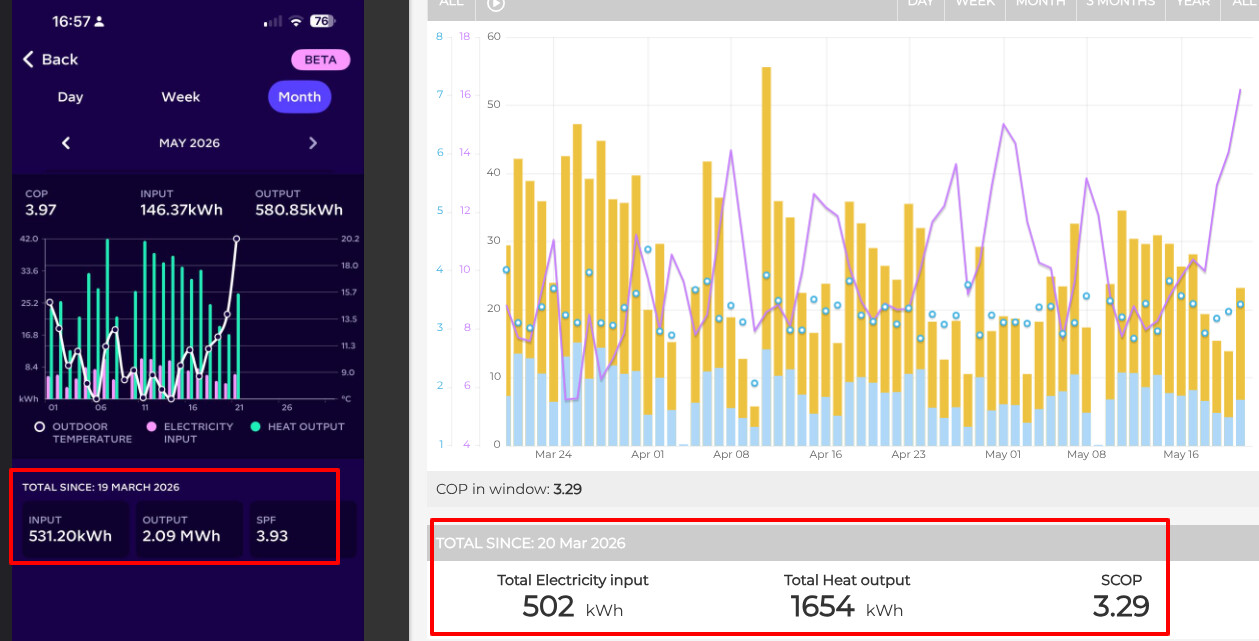
I can do, do you know if the octopus API exposes the data?
If not I’ll get some time and do it manually. My gut feeling is that the octopus app under reports performance slightly.
They leave a lot of performance on the table as well. I think they are being a bit smart showing a variable tarrif cost basis against gas, they should separate out what cost saving is comming from the tarrif compared to the actual efficiency.cost saving. Looking at the data I think it’s clear that MCS oversizing is also contributing, especially with the heavy ramp up the cosy seems to do each cycle.
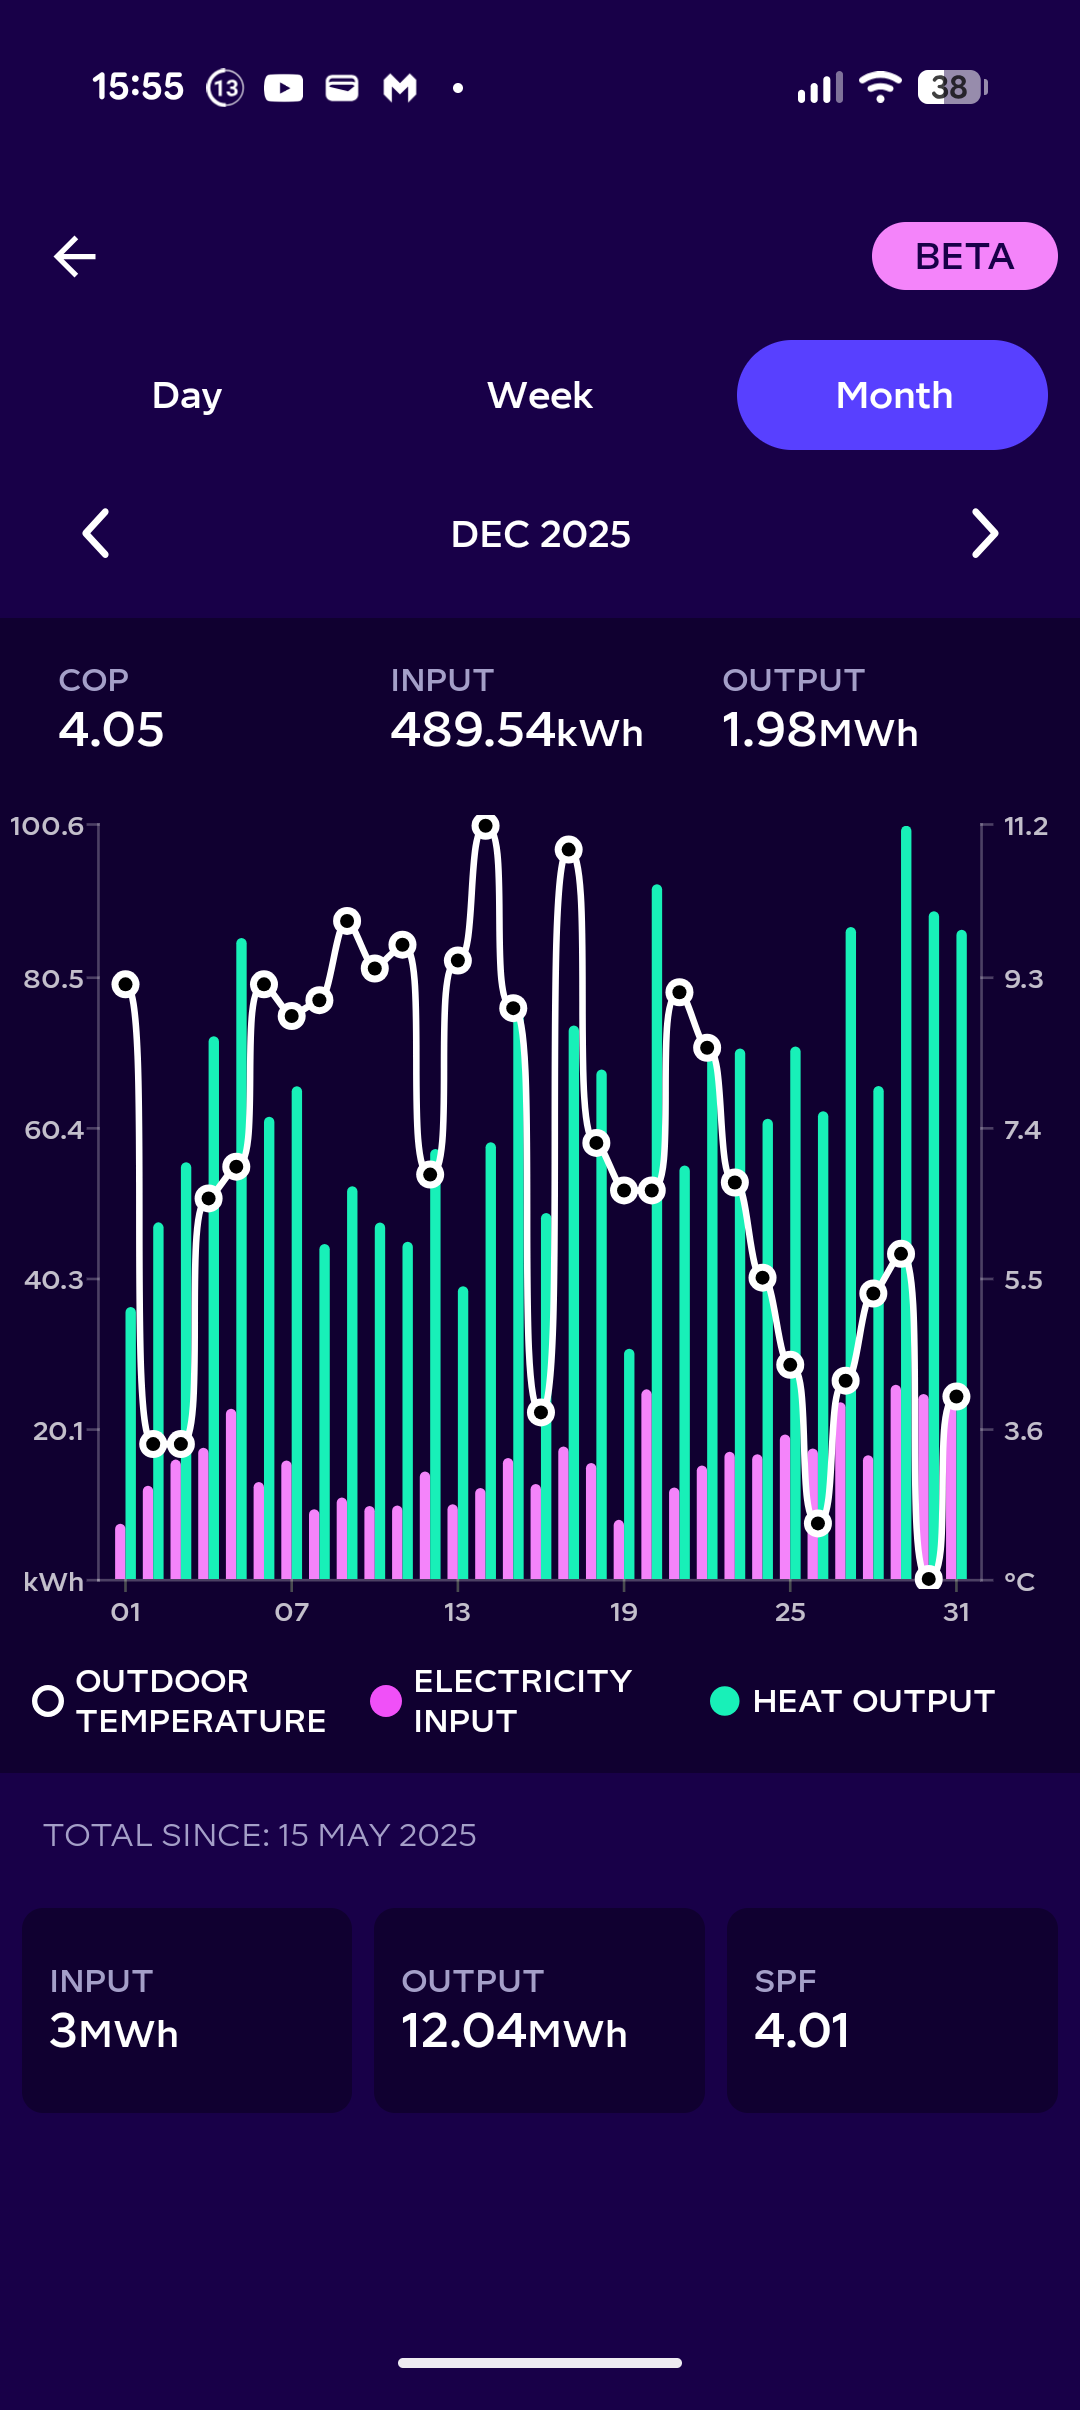
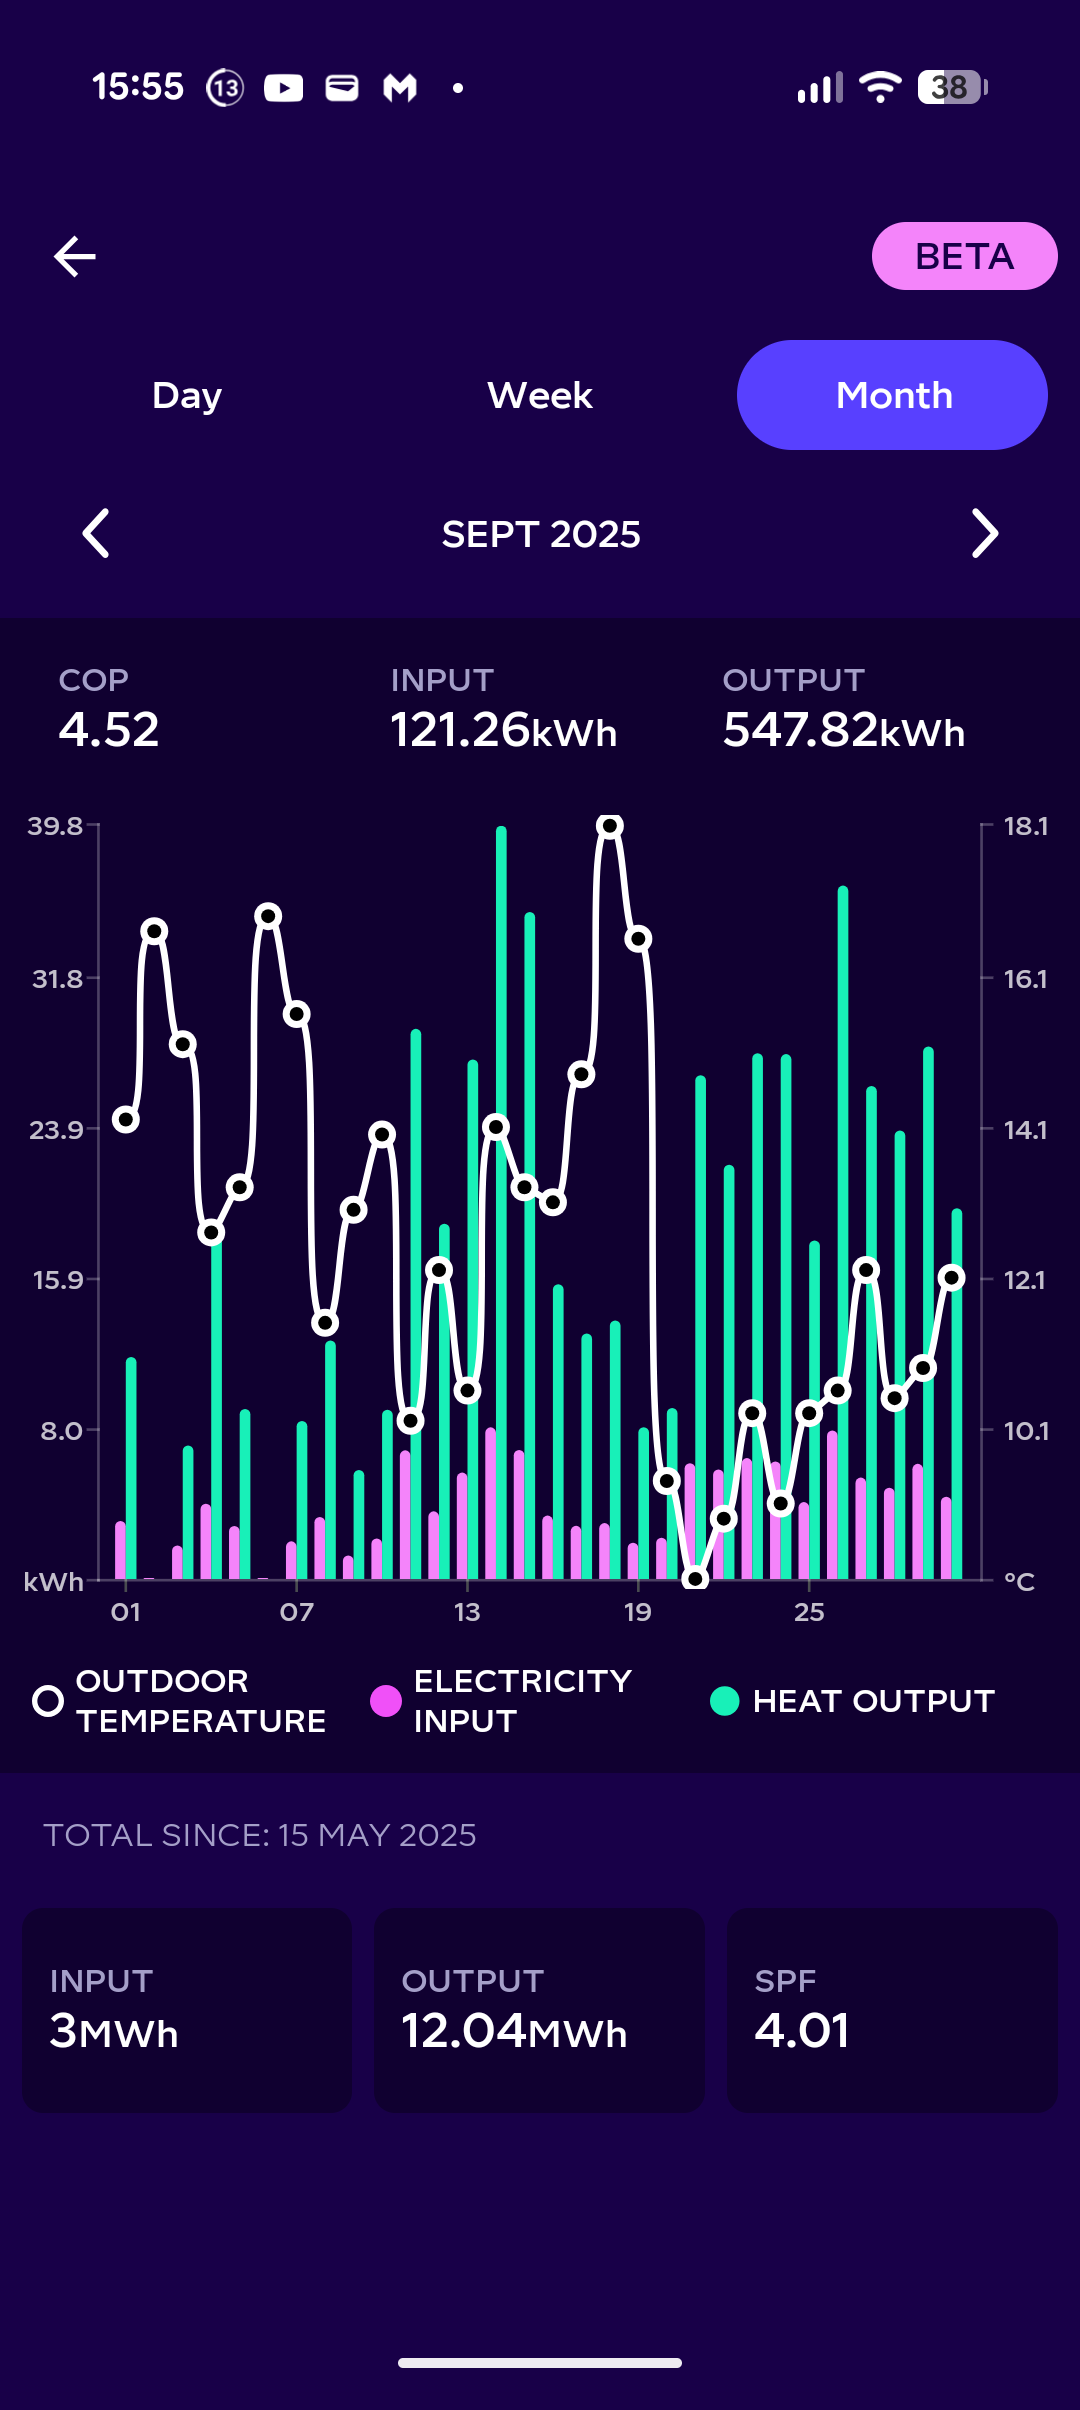
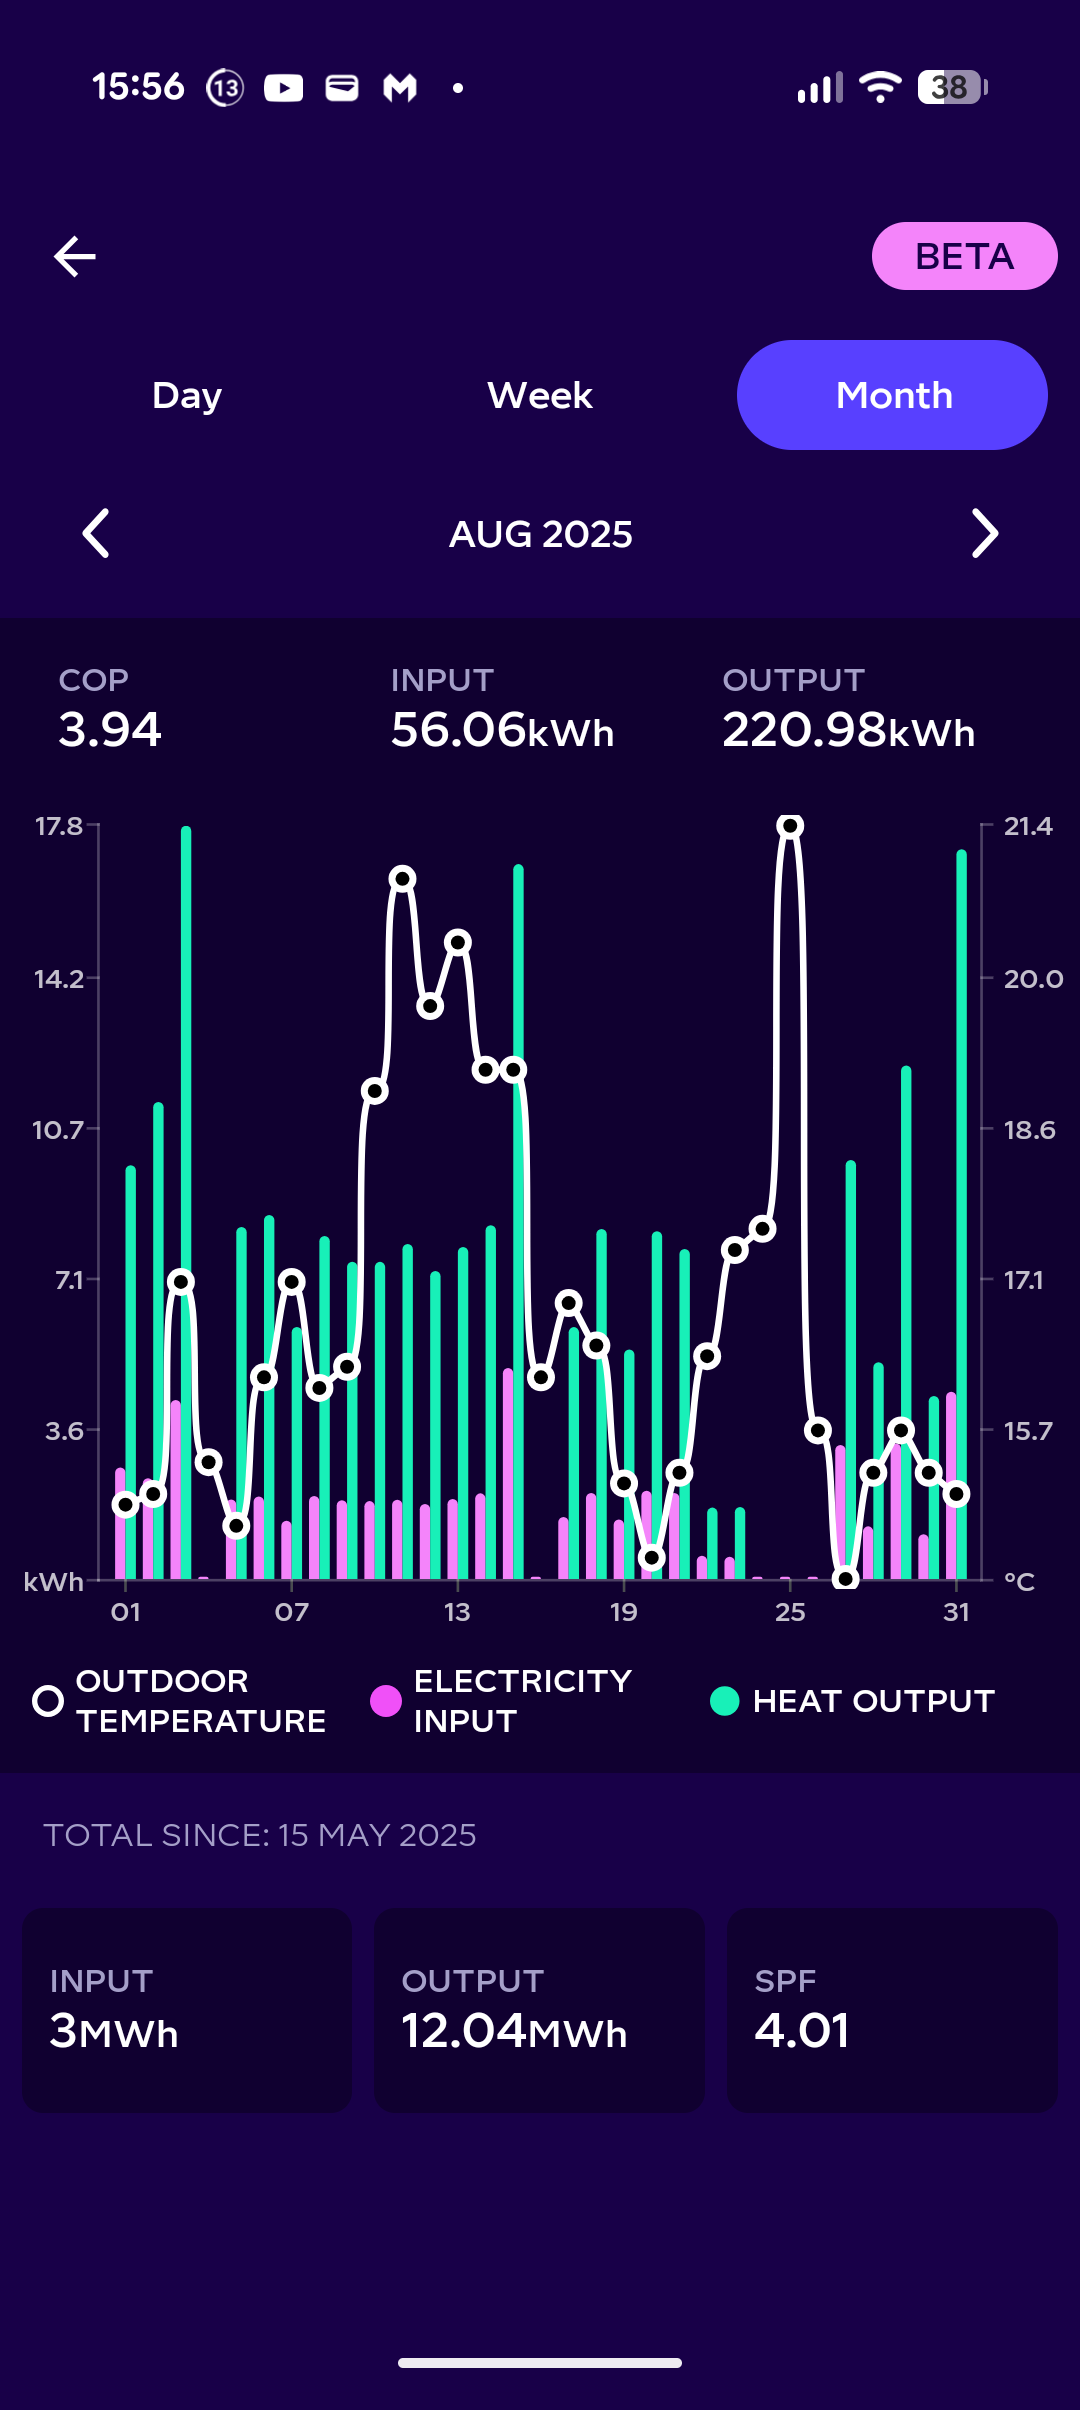
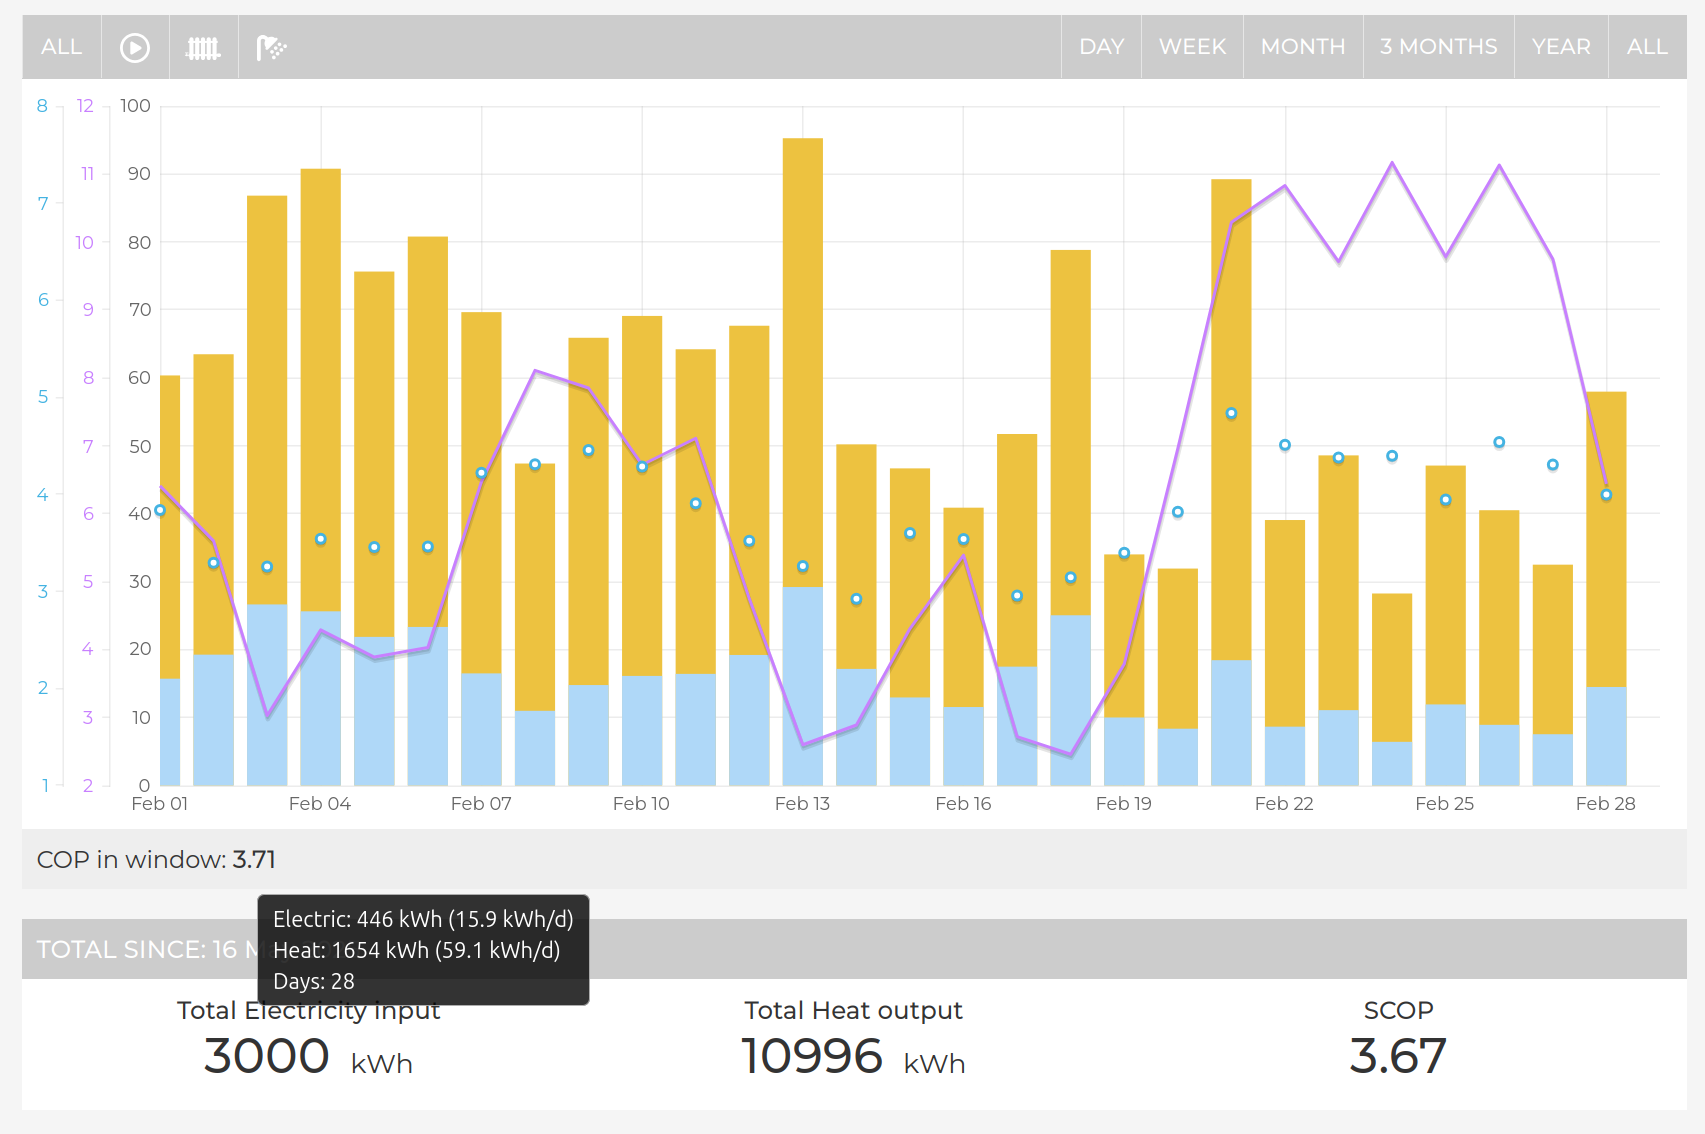
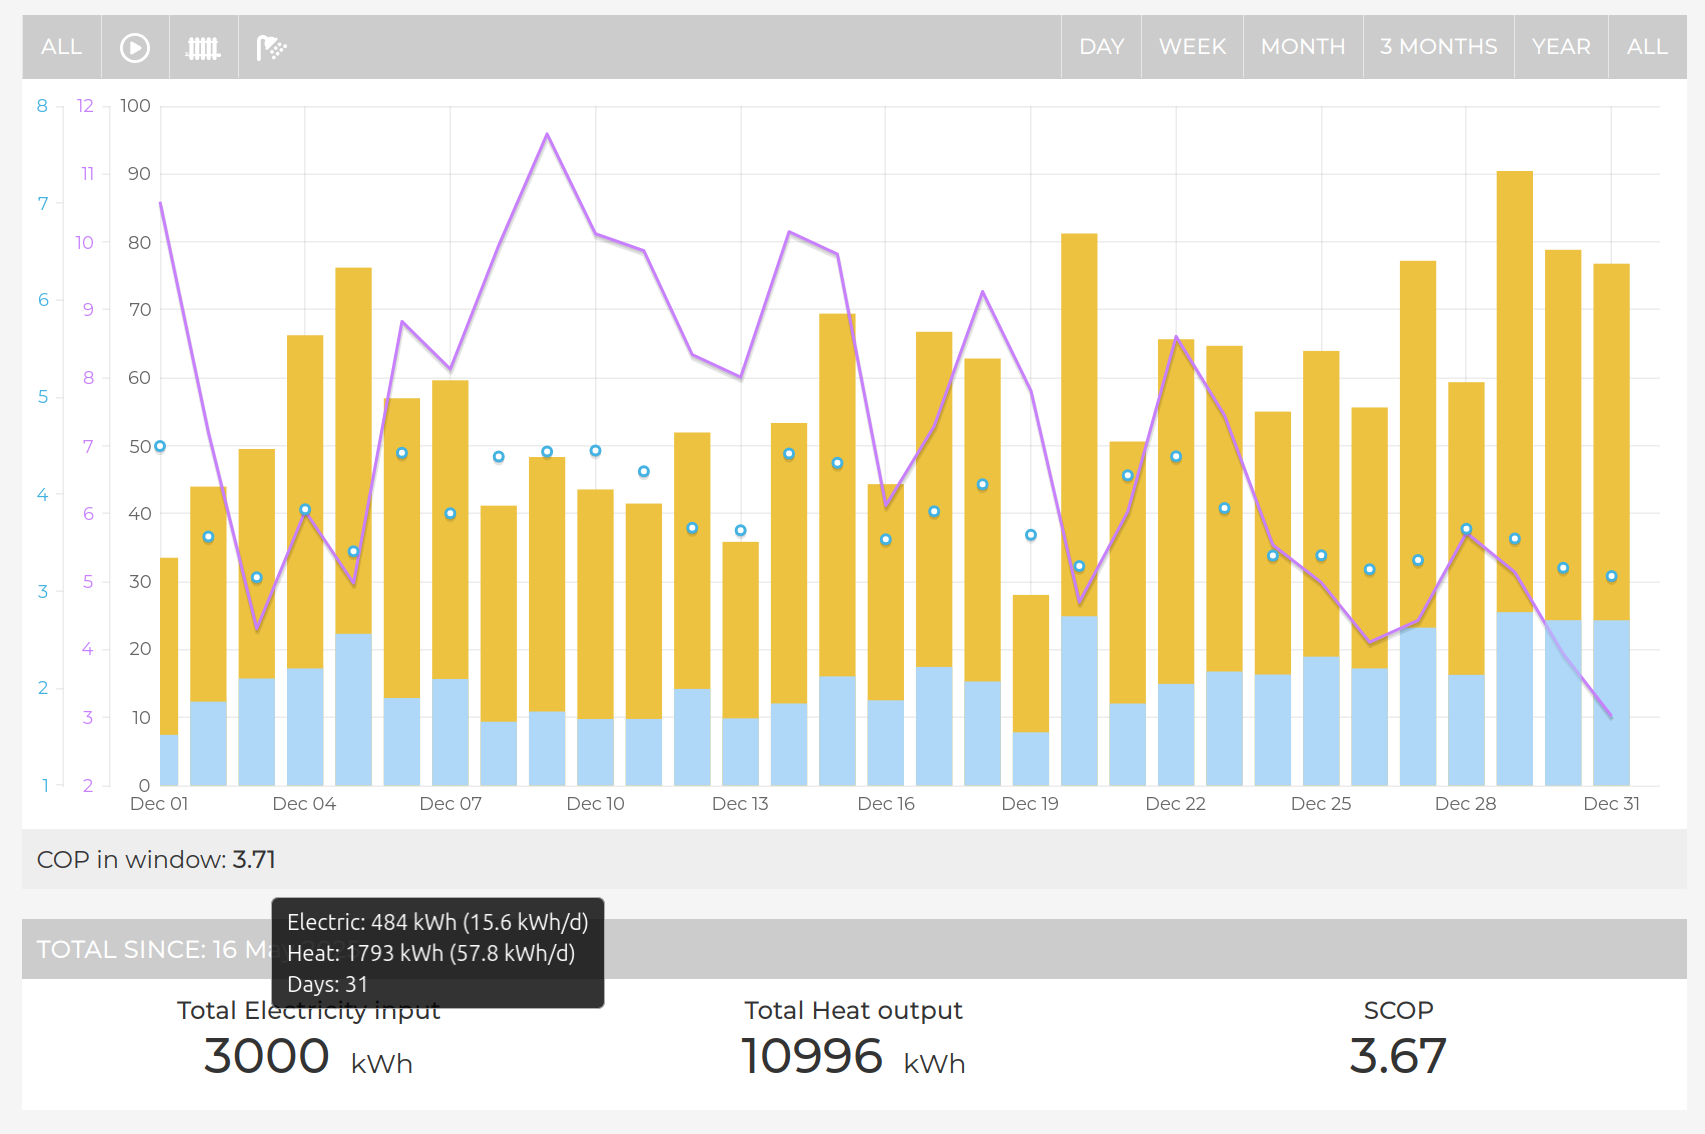
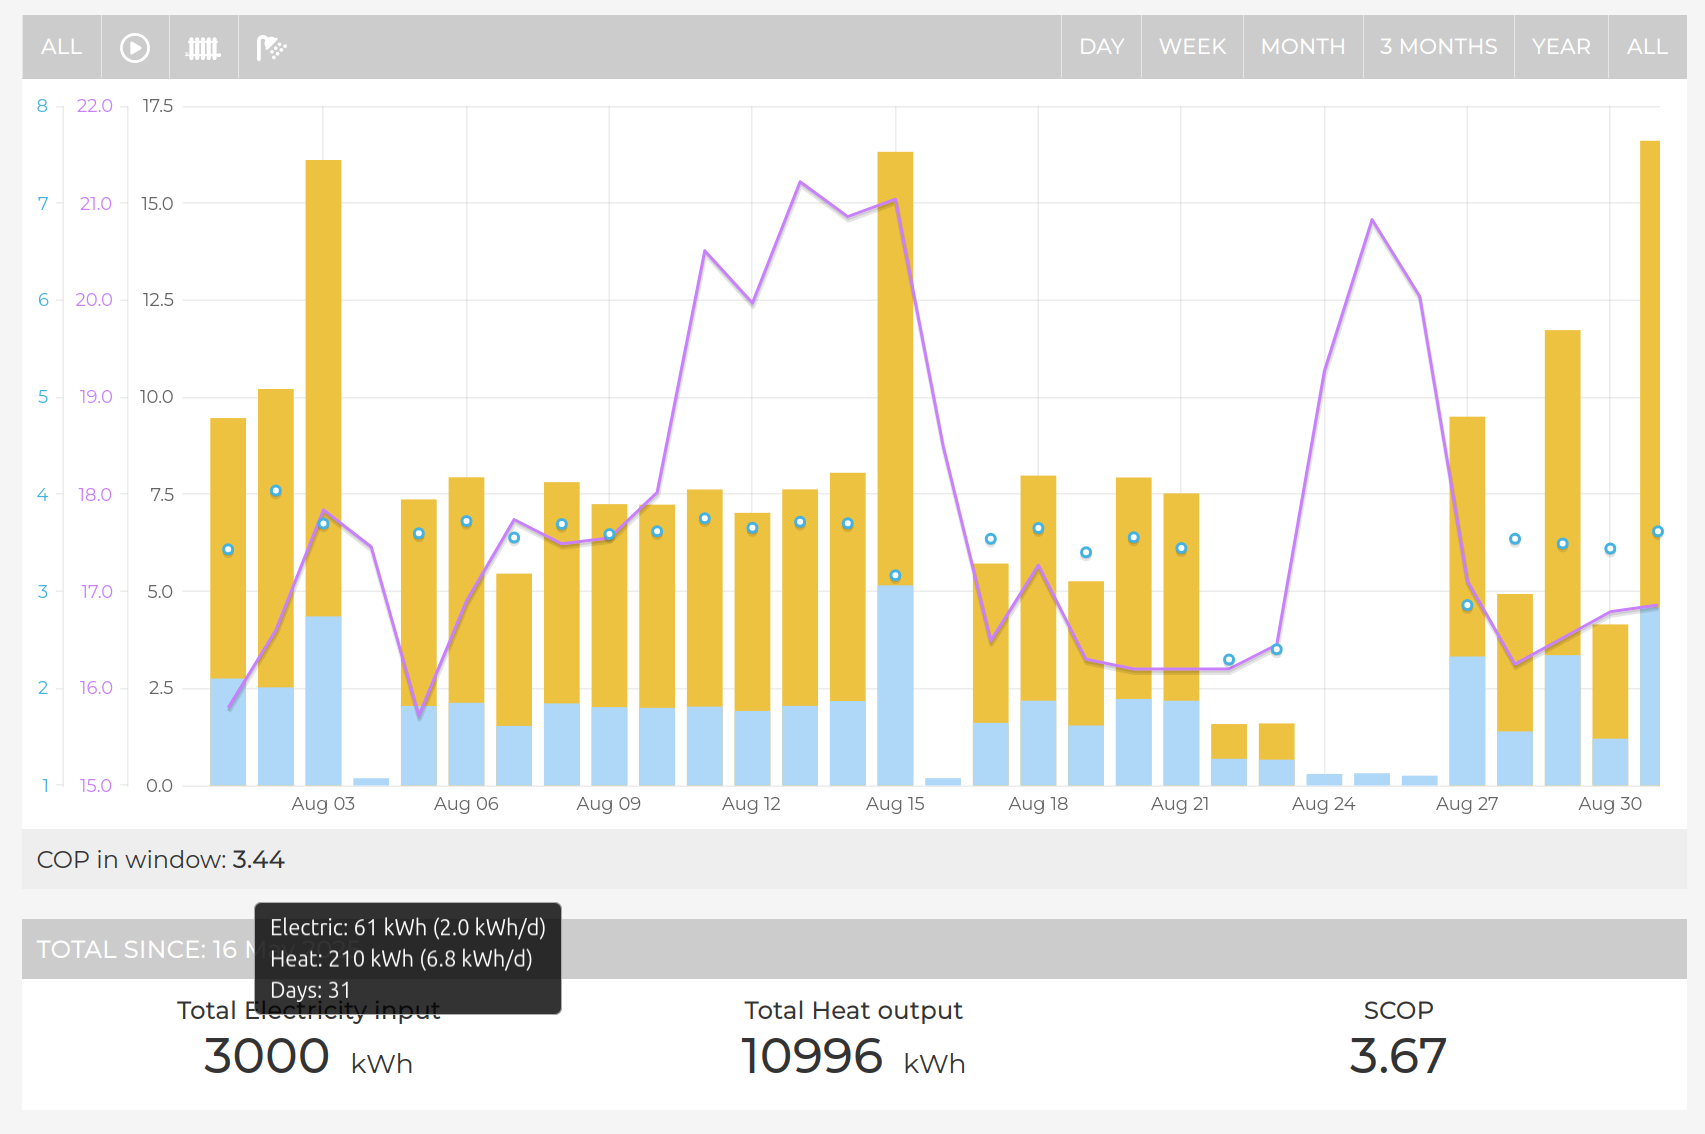
I didn’t include anything before August, since in August they released a firmware update that significantly increased hot water COP.
If you look at my system it’s very hard to get it into steady state, I think the 9 might be a little oversized for my house (my entire house is south facing and huge amounts of glazing), so if anything that is a glowing endorsement that even when it’s chucking it produces good COP.
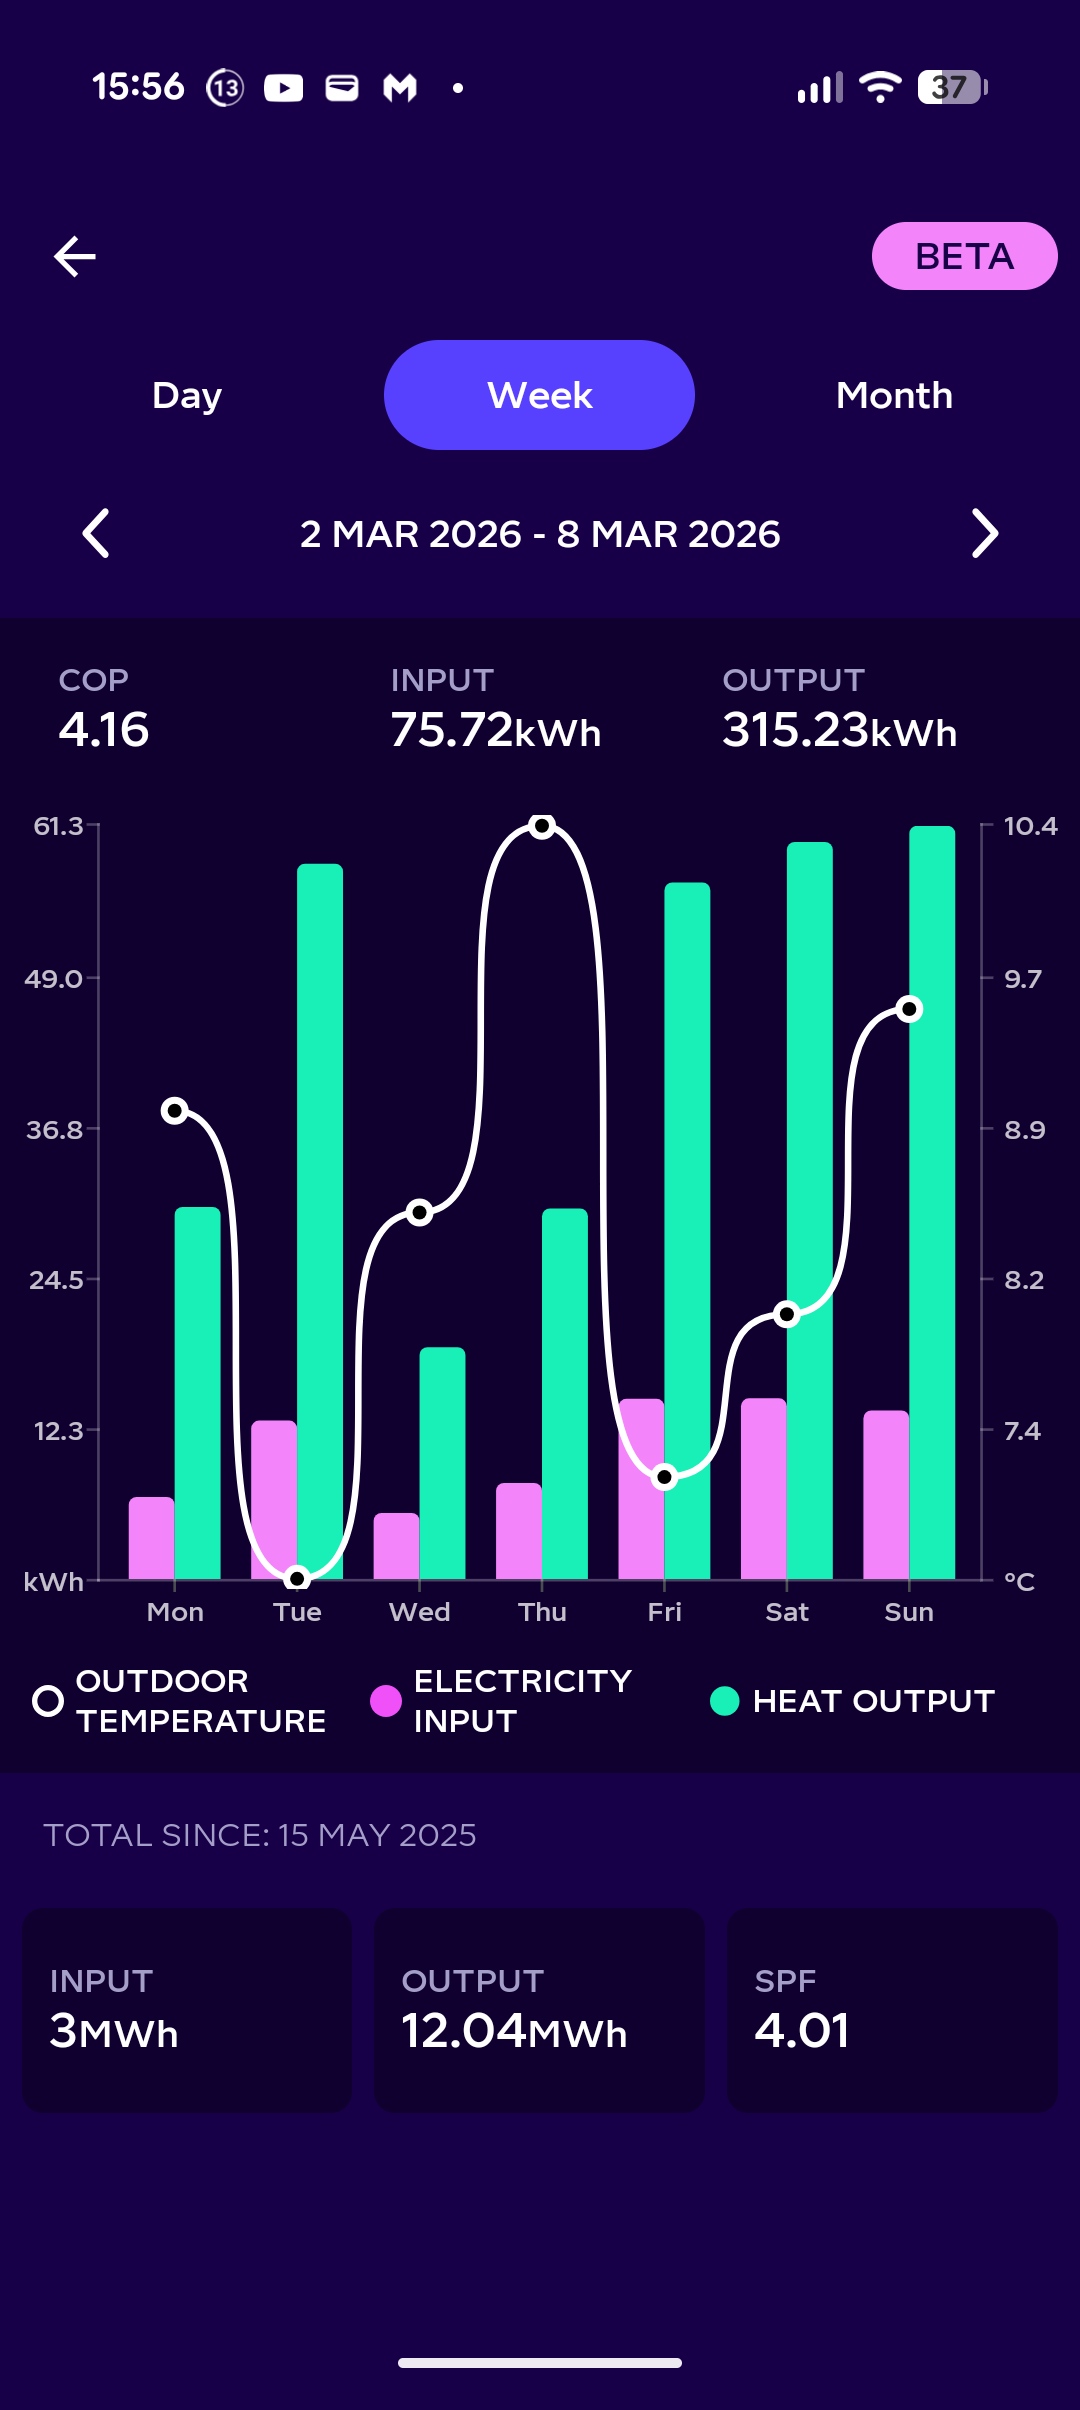
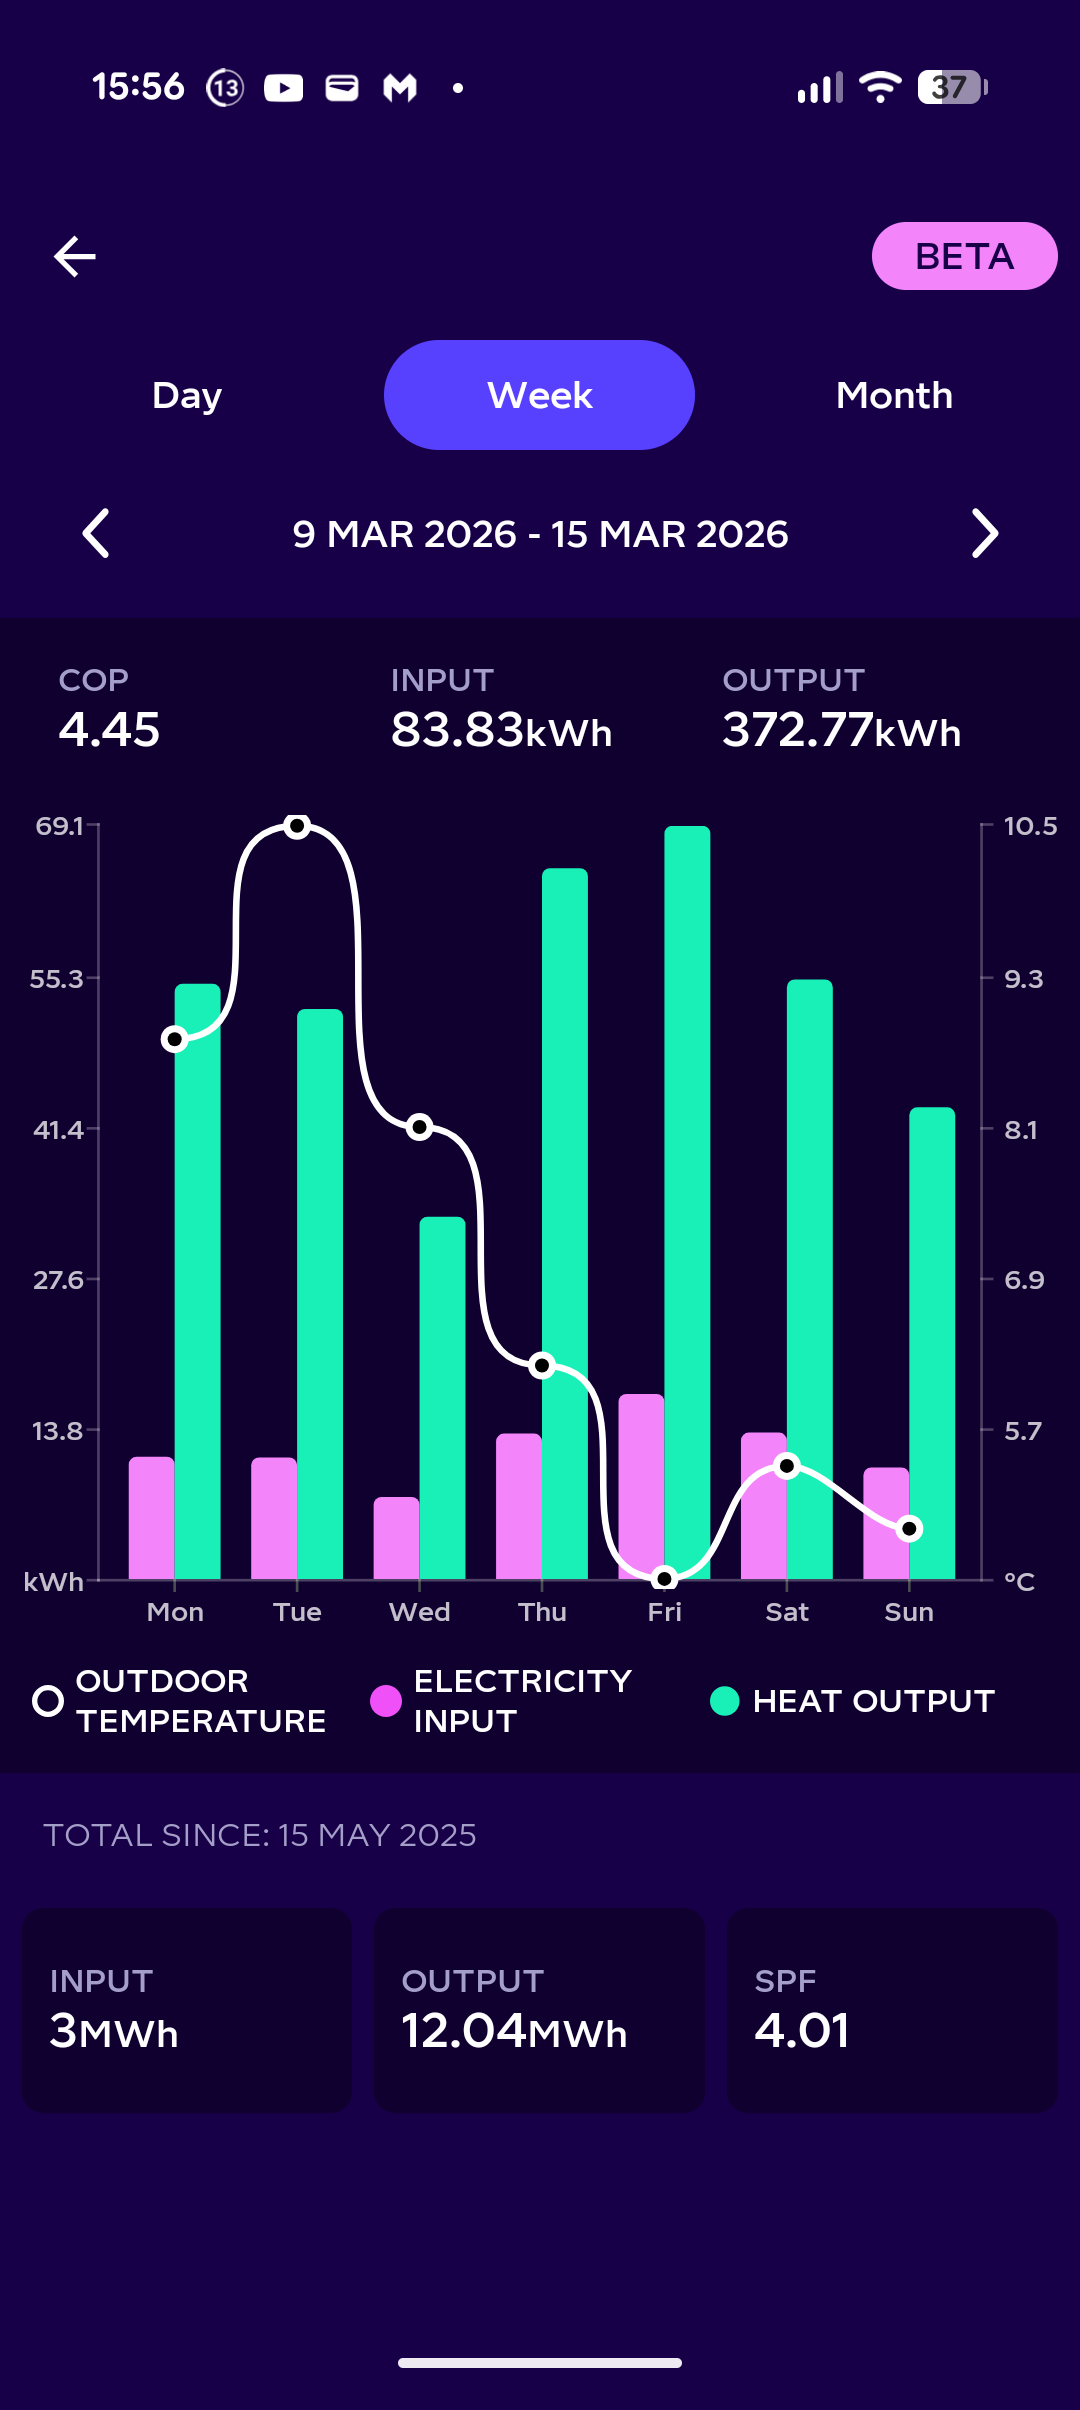
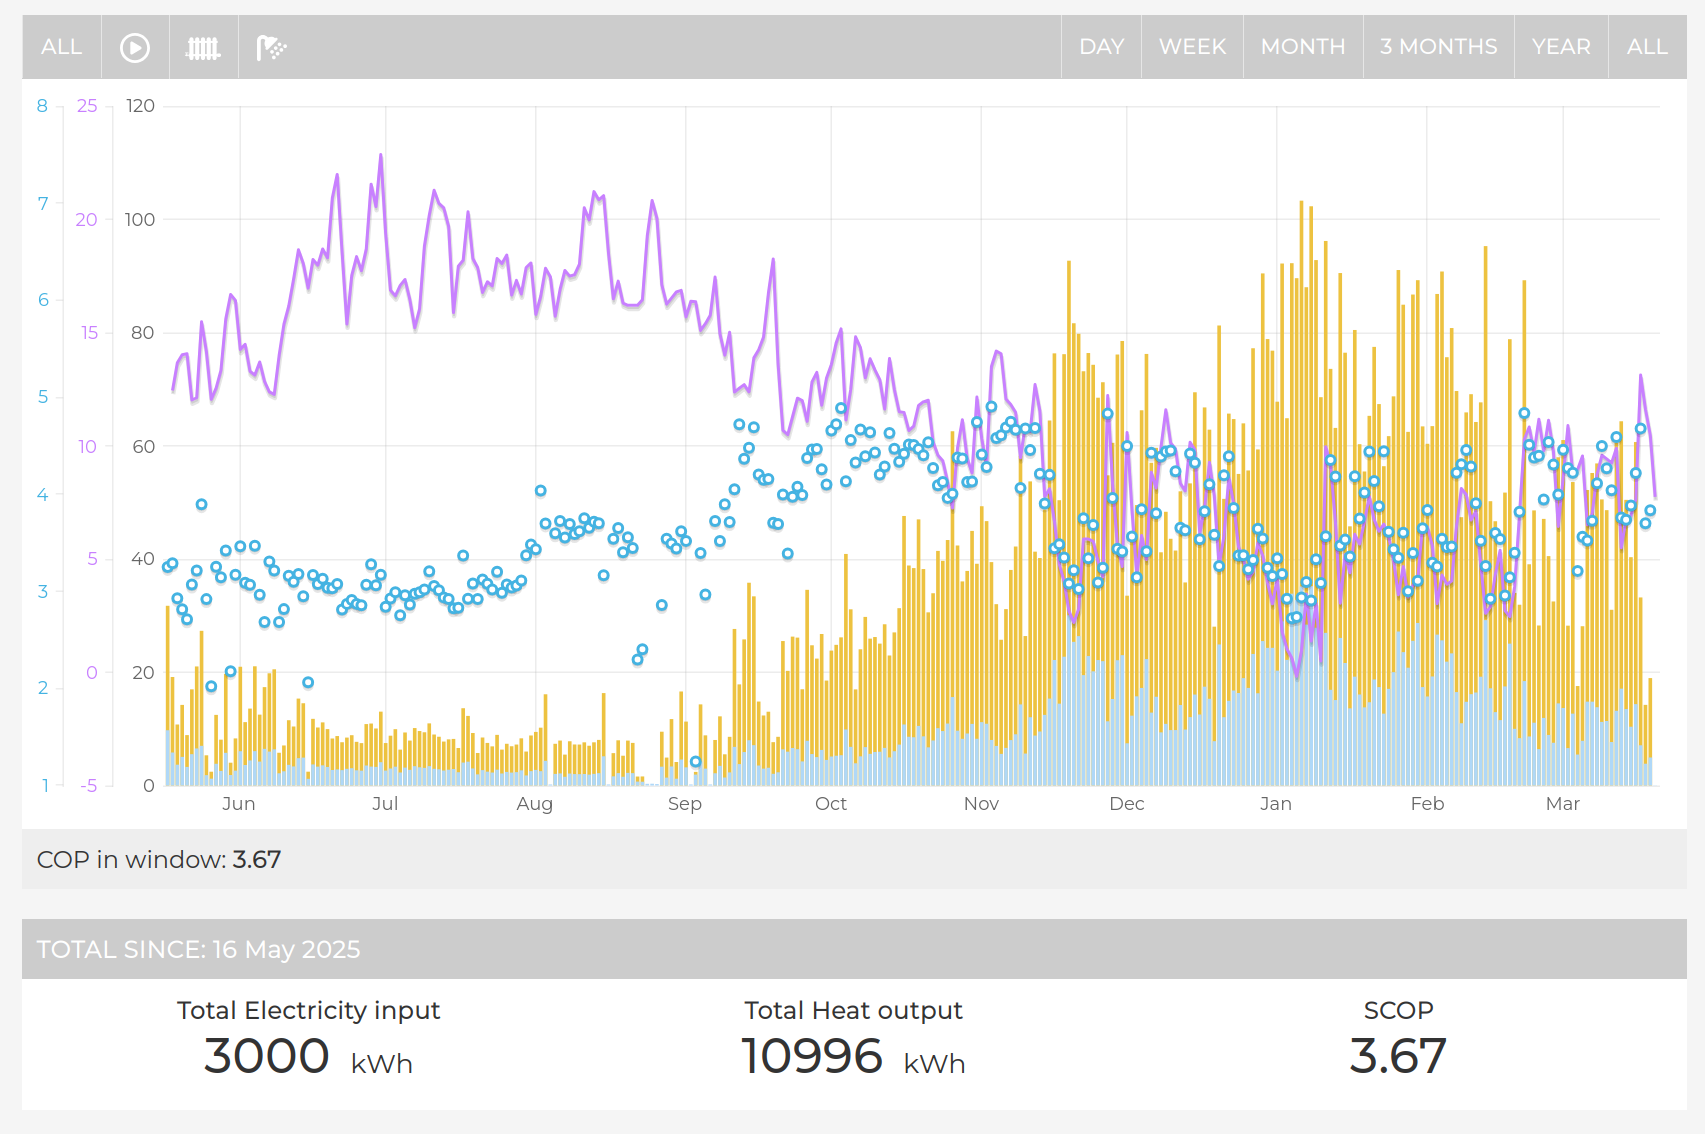
Thanks, interesting! so it looks like it does have a running total that has the same electrical consumption as your system is showing on HeatpumpMonitor, the SPF on heatpumpmonitor is a bit lower than on the app 3.67 vs 4.01 and it looks like the main difference is the heat meter, still a 10% difference is pretty good for internal monitoring!
I’m expecting a big jump in SCOP once I get some new June to Aug data into that year, the August update really was very important for how it ramps hot water.
As far as I can tell it doesn’t have any summer mode either, where it knows it can run a hot water call over a longer duration to improve cop.
I havne’t got MID monitoring on my Cosy 6 but I can say the electrical usage measured by the Cosy is wrong. Don’t know if it just a 1st gen Cosy 6 issue but it only recorded apparent power and not active power, so when you get it to modulate down the COP figure drops off massively. I calculate my own COP using their heat output figure and my own kW reading, and I am regularly seeing a COP over 5 when the outdoor temp is above 8 degrees.
I would get the MID monitoring but the cost of it plus installation is a bit much for me.
This is an over reporting of 15% error on the COP reading
It looks like the electric usage is correctly reported (87kWh), but the heat delivered is being significantly over reported 335kWh (onboard) vs 290kWh (MID)