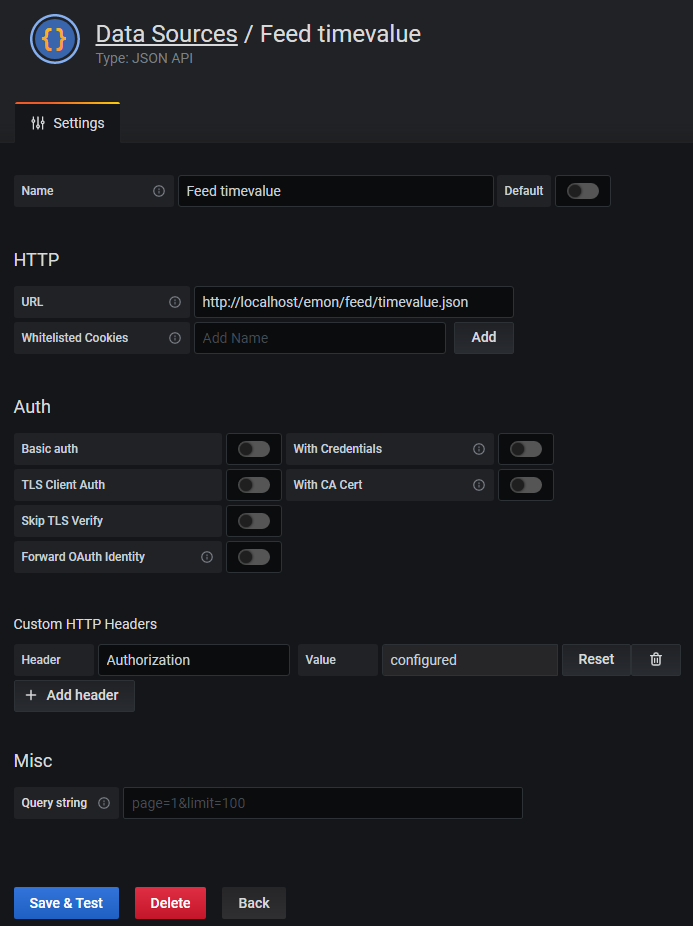
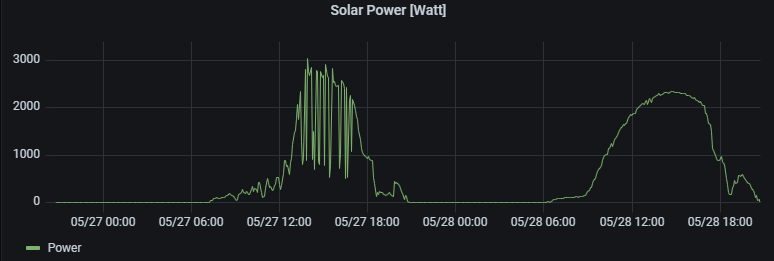
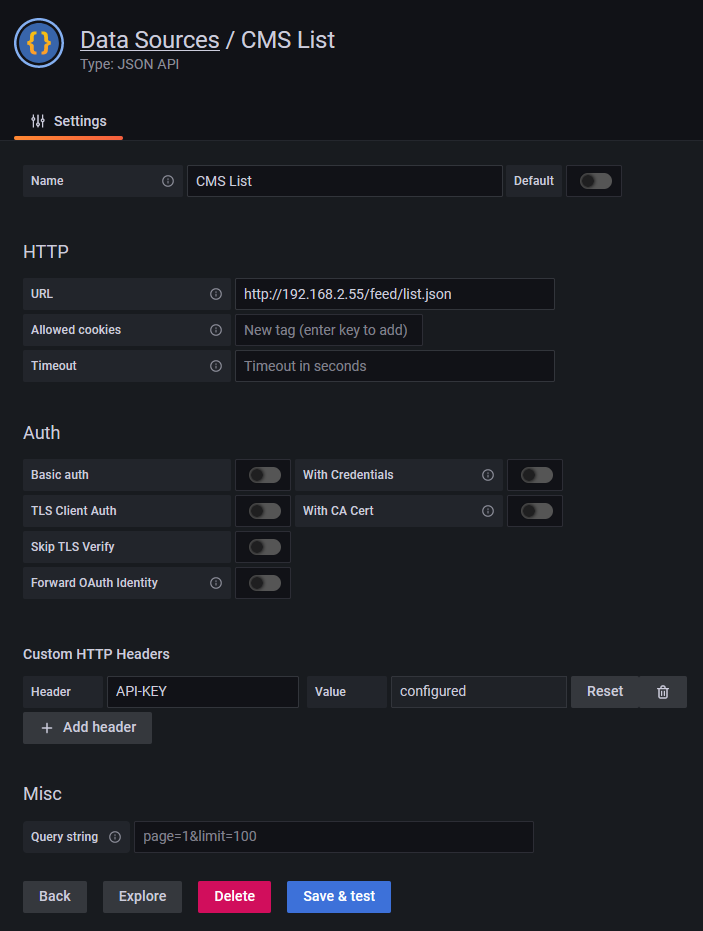
Hello all, I’m here to share with you how configure grafana to direct access to emoncms data. For this you need to use MARCUSOLSSON-JSON-DATASOURCE with this configuration:
Hallo Oleg
many thanks for sharing this. I tried to replicate what you did with for “timevalue” data but unfortunately without success. I can read the “timevalue” data via Postman from EMONCMS. but Grafana does not seem to get any data. I do not get any errors either.
Do you maybe have a more detailed description what you did to:
get the Bearer APIKEY - I must assume this is something different then the “normal” API read api-key shown in the EMONCMS GUI?
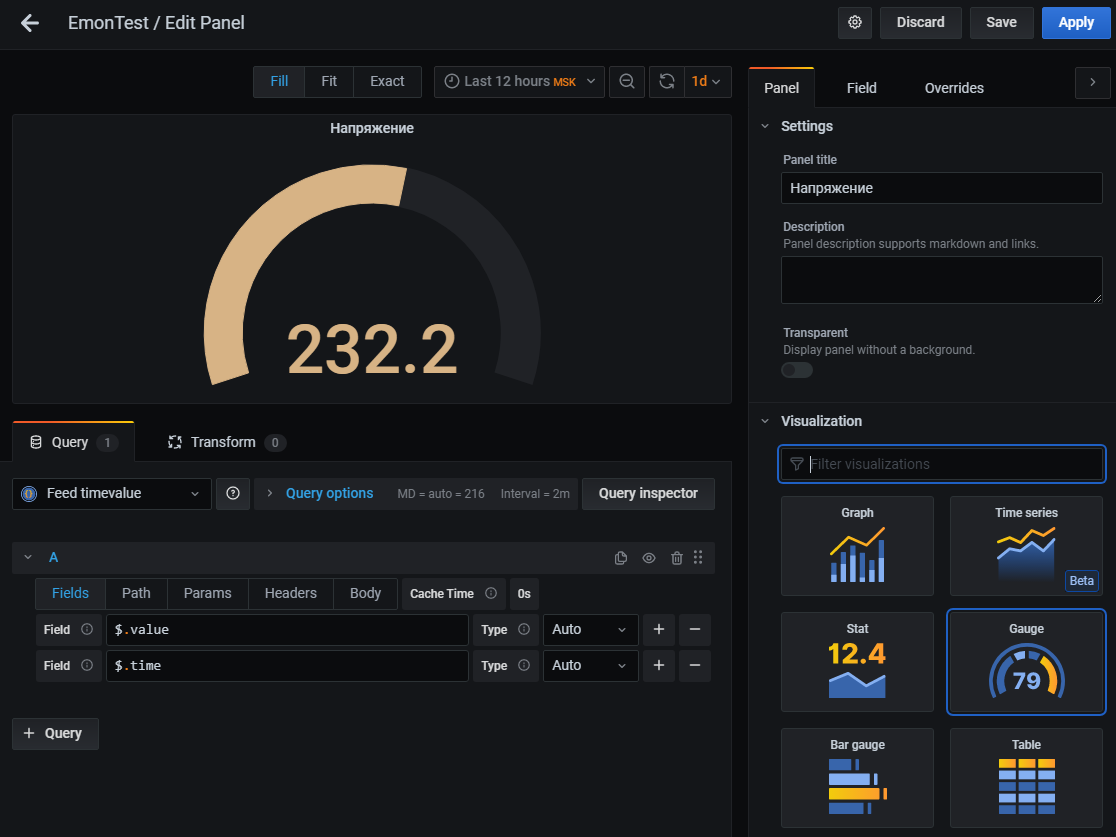
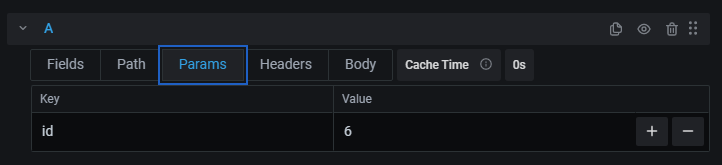
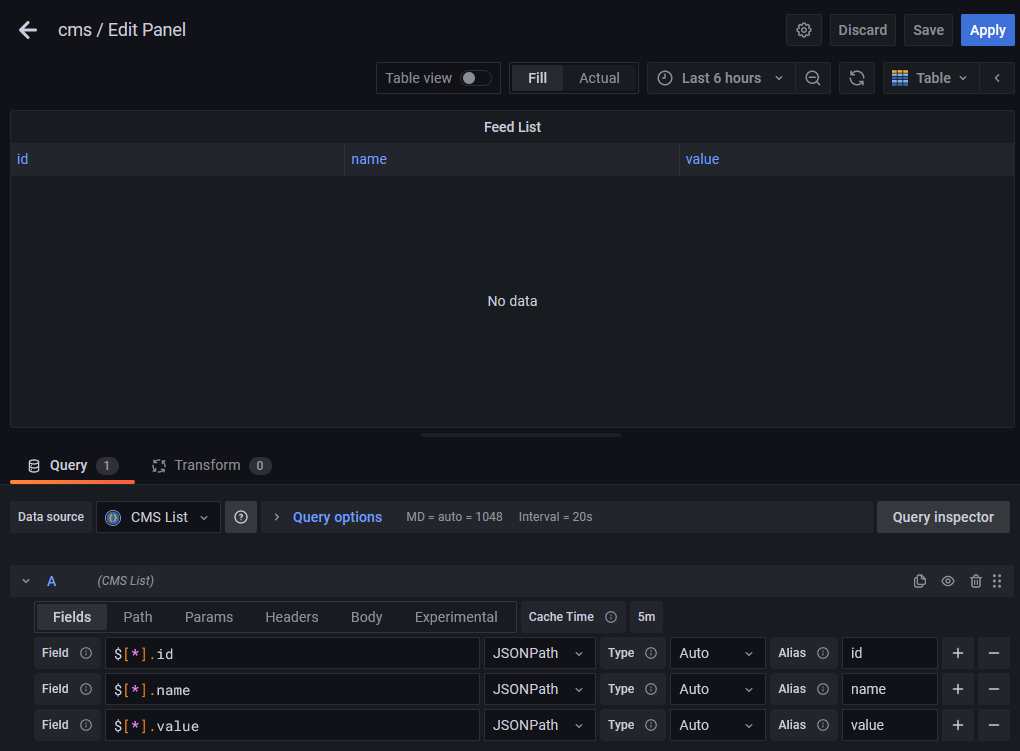
add a panel - e.g. did you add anything other tabs then “Fields” and “Params” - especially in the “Path” tab to define the data to be pulled?
I did not correctly read/understand the comment about the “Authorization” Header value: Bearer APIKEY
APIKEY needs to be replaced by the Read API Key numeric value which you find in EMONCMS under “My Account”. I guess this is pretty straight forward it you know what you are doing
The EMONCMS API descriptions helped me to better understand what this stands for.
Other than that I just followed Oleg’s description.
Really great how everything works together - EMON is just a perfect system
Hello all,
I am trying to replicate what Oleg did, unsuccessfully.
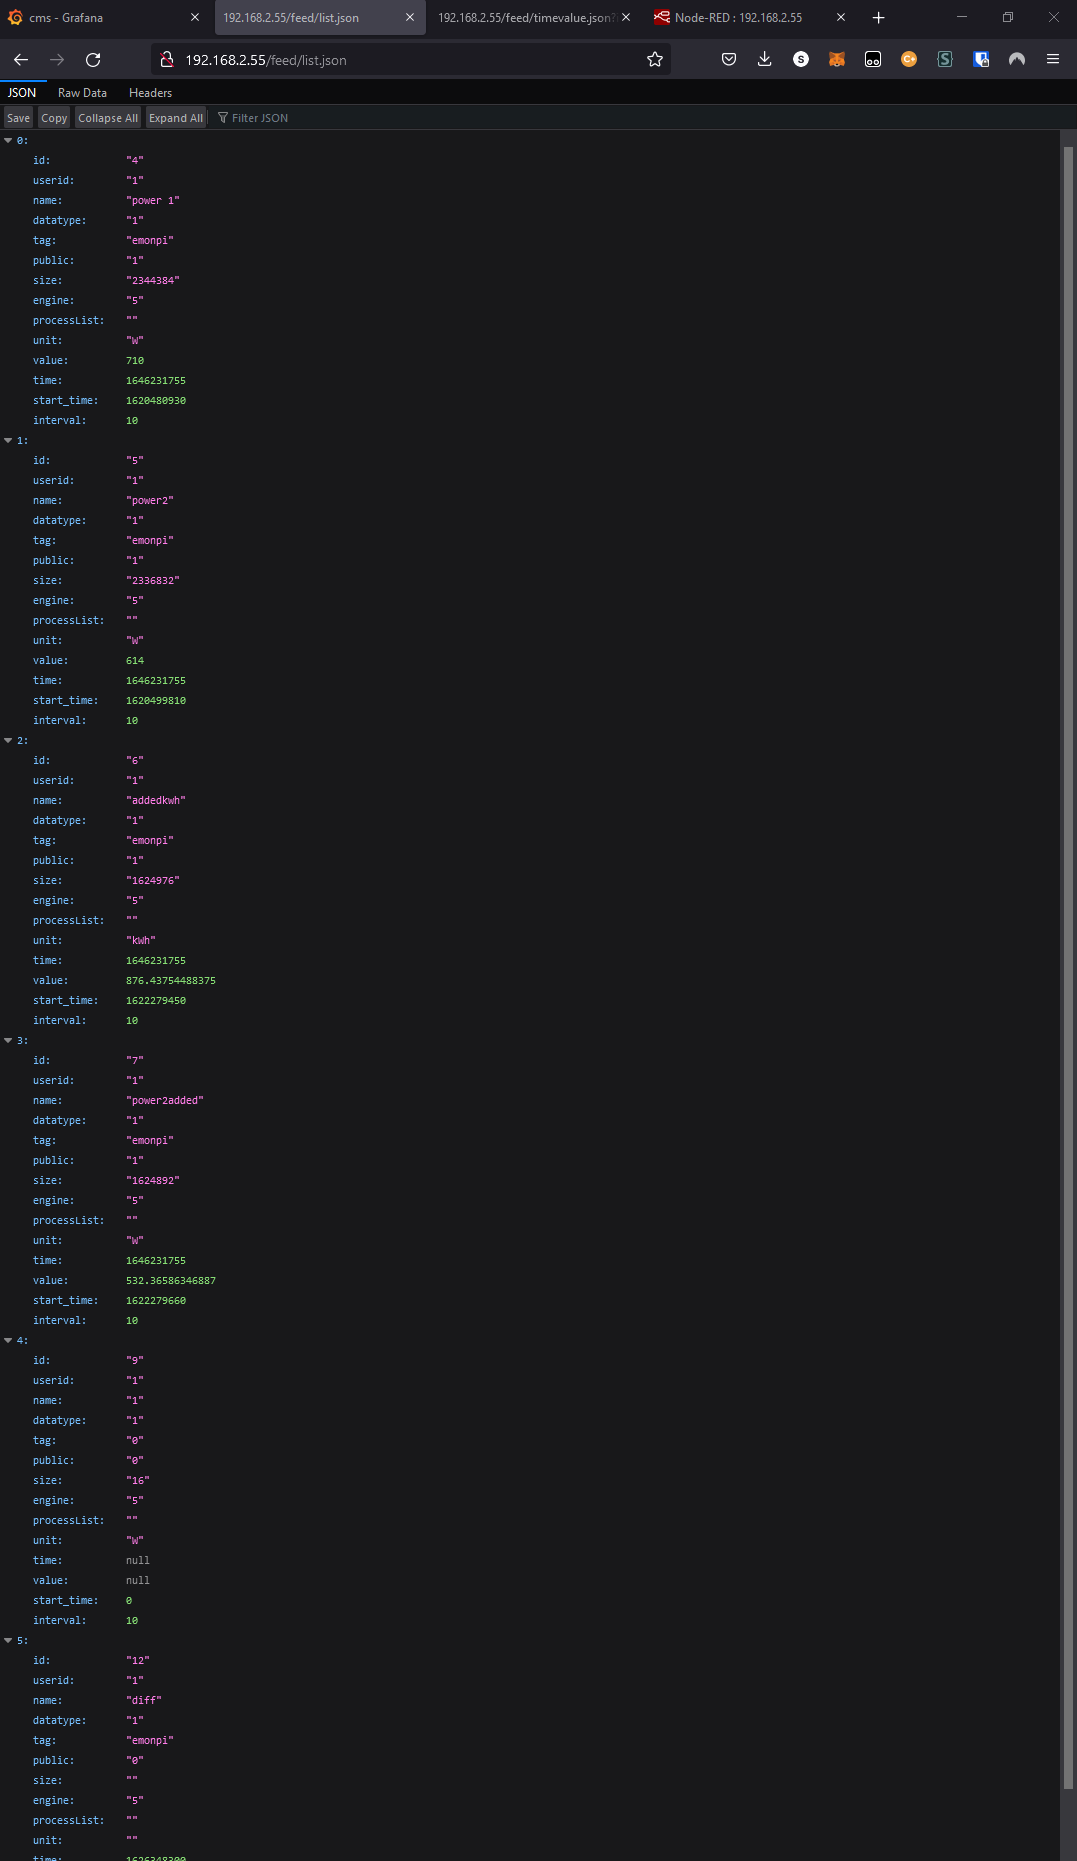
Timevalue, current value nor list are showing any data.
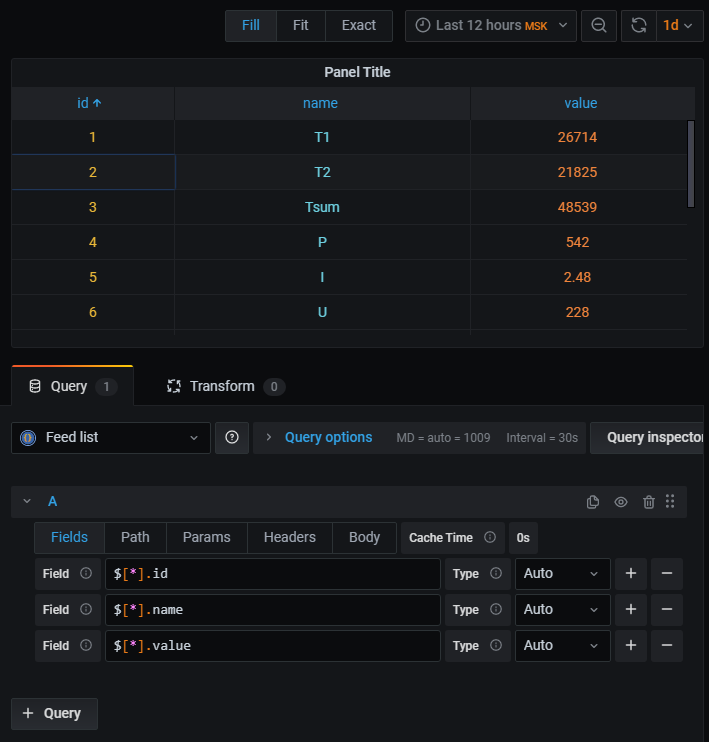
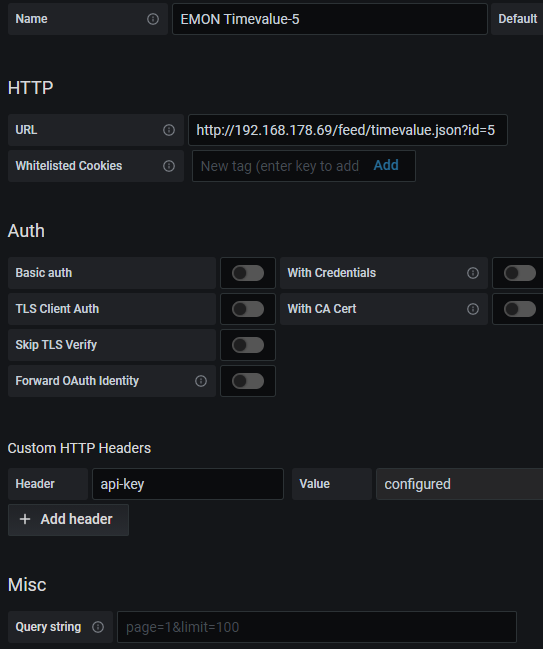
I am able to create the data sources. Below 3 screenshots:
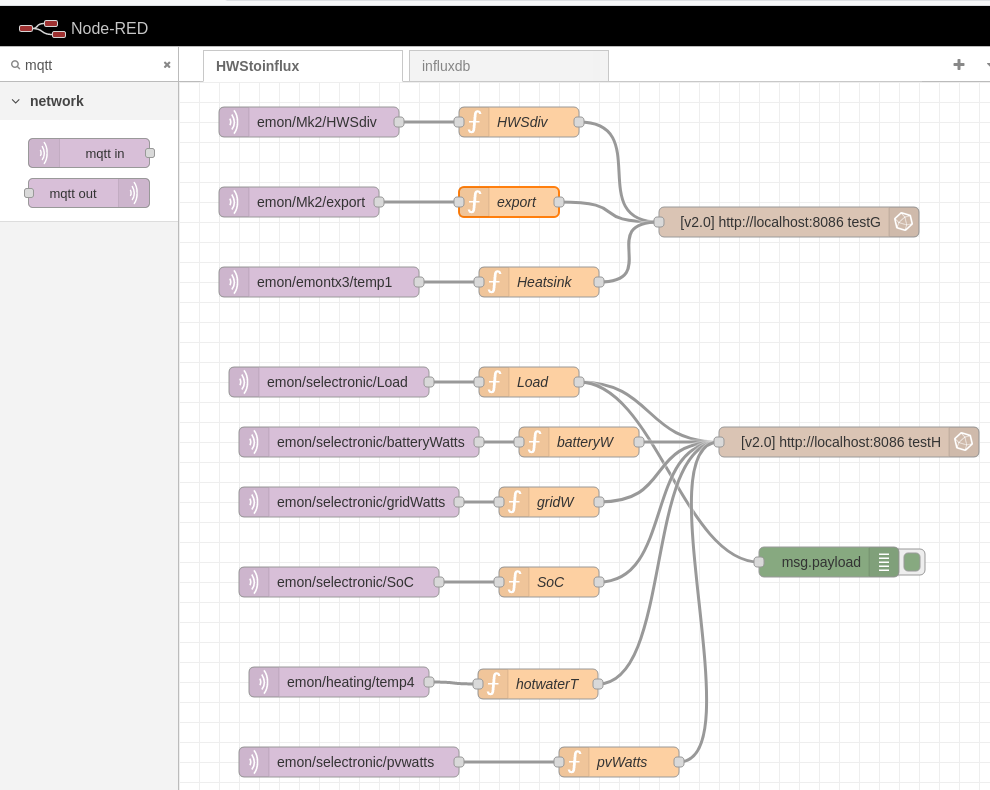
I didn’t have any success trying to load the data using JSON directlly but have got it to work via mqtt and node-red, using the influxdb node..
Briefly - in node-red - I pickup the data using mqtt in and pass it to the influxdb node via a simple function. The influxdb node then sends the data to influxdb that can analyse/plot or be used by Grafana.
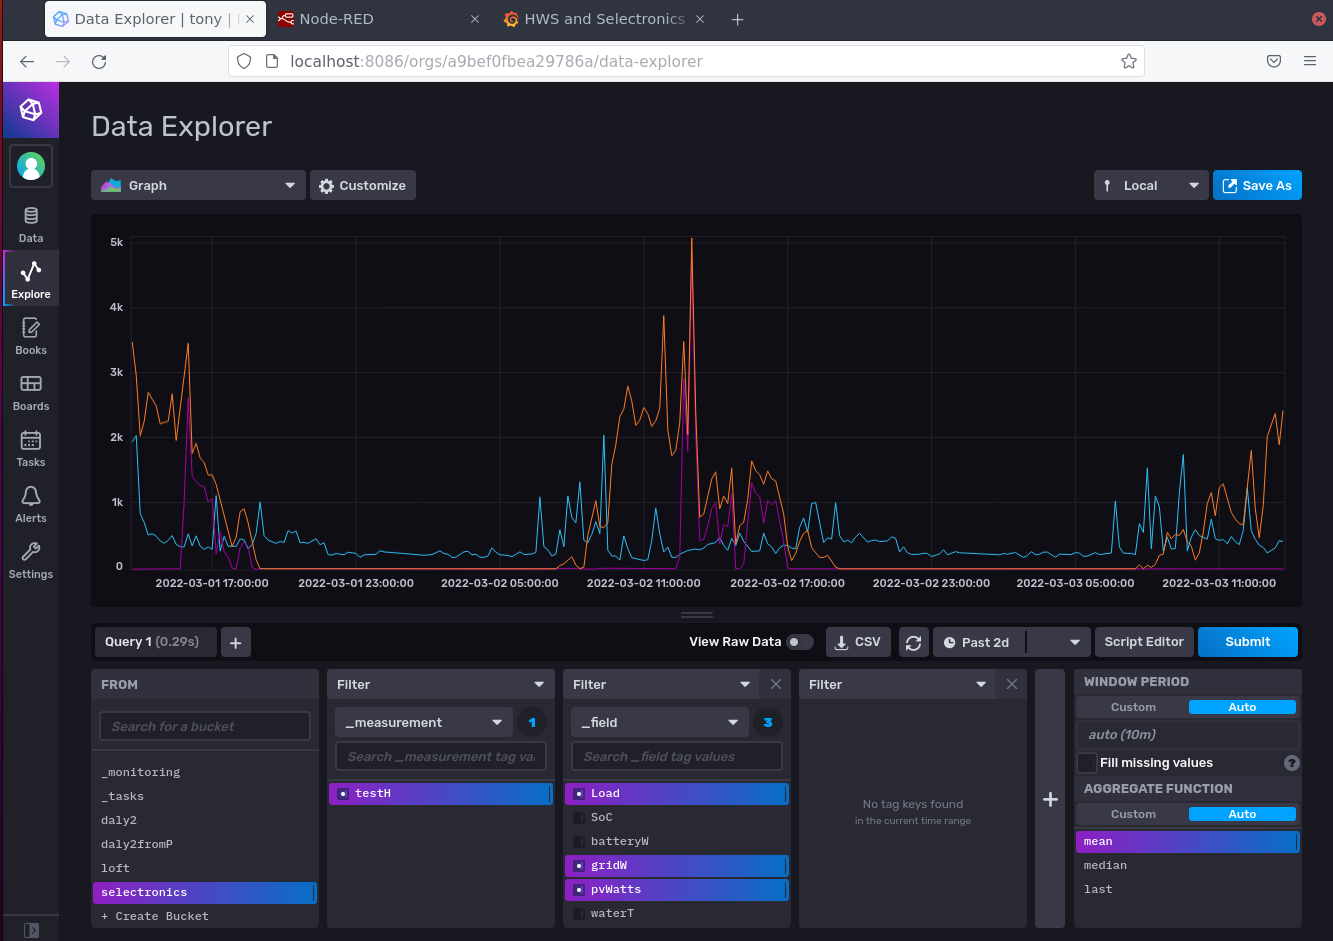
I found using influxdb was useful because once you see data coming in, it is straightforward to send the data to Grafana. However finding the right combination of tokens etc in both programs was frustrating - especially as they seemed different in every new version.
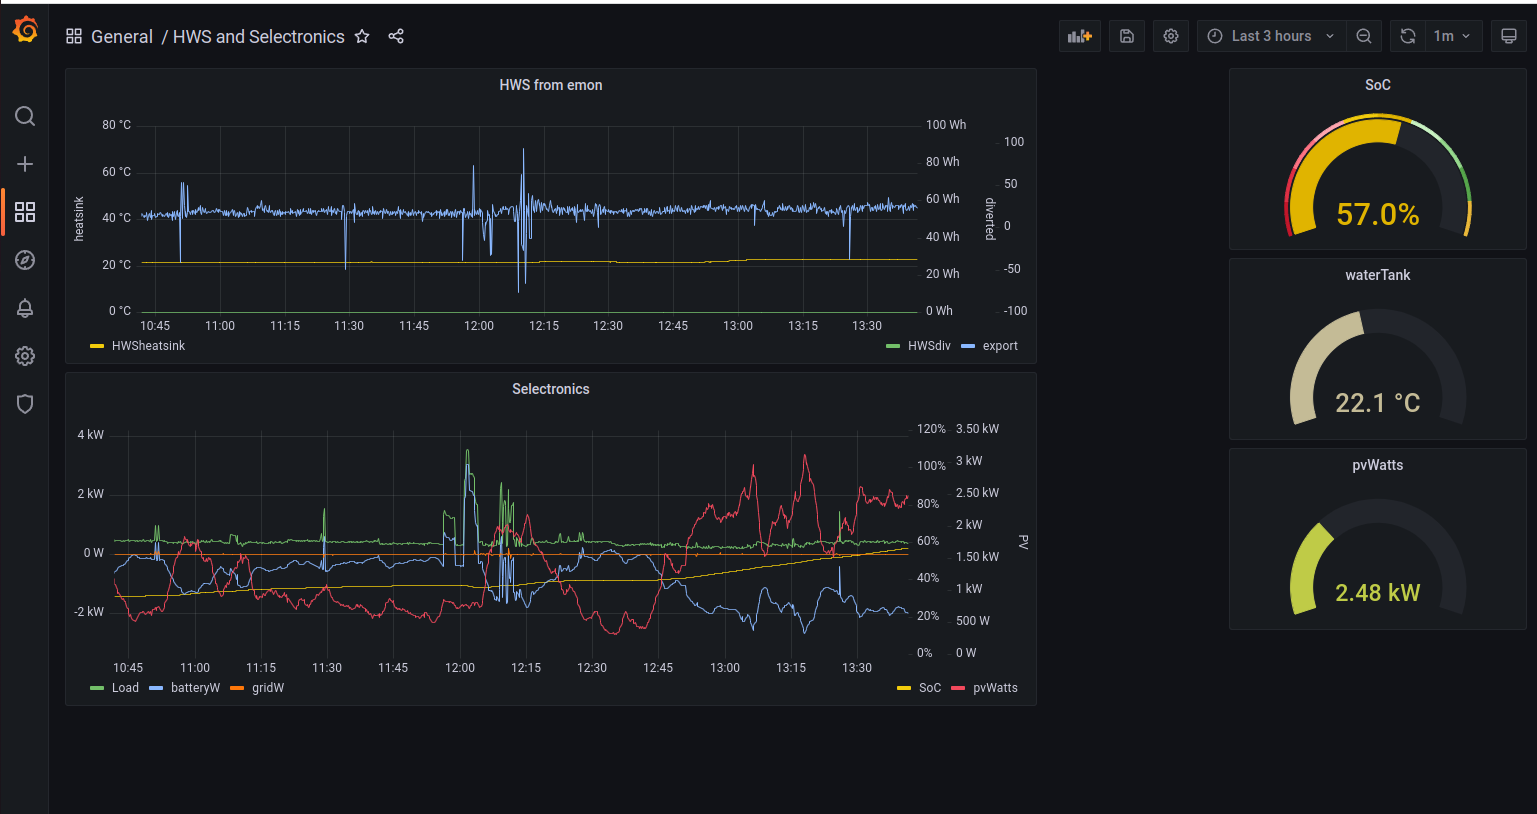
Once Grafana was able to connect to influx (running on another rPi) then plotting the data was mostly straightforward using cut and paste flux commands.
But it’s been running now a few weeks and seems stable and informative.
Here are some screenshots.
From Node-red:
My Node-red implementation is not optimised in that I am using a separate input for each MQTT topic and then summing them all into influxdb. I think there is a batch input, but I’ve not had any problems without it.
I also have another influx database for a 16 cell battery and use Grafana for that as well - after some struggles getting the batteryy BMS to provide data to a python script…
I have exactly the same problem. Grafana reports ‘JSON API: Not Acceptable’ when saving and testing the connection. Has anyone found a solution to this ?
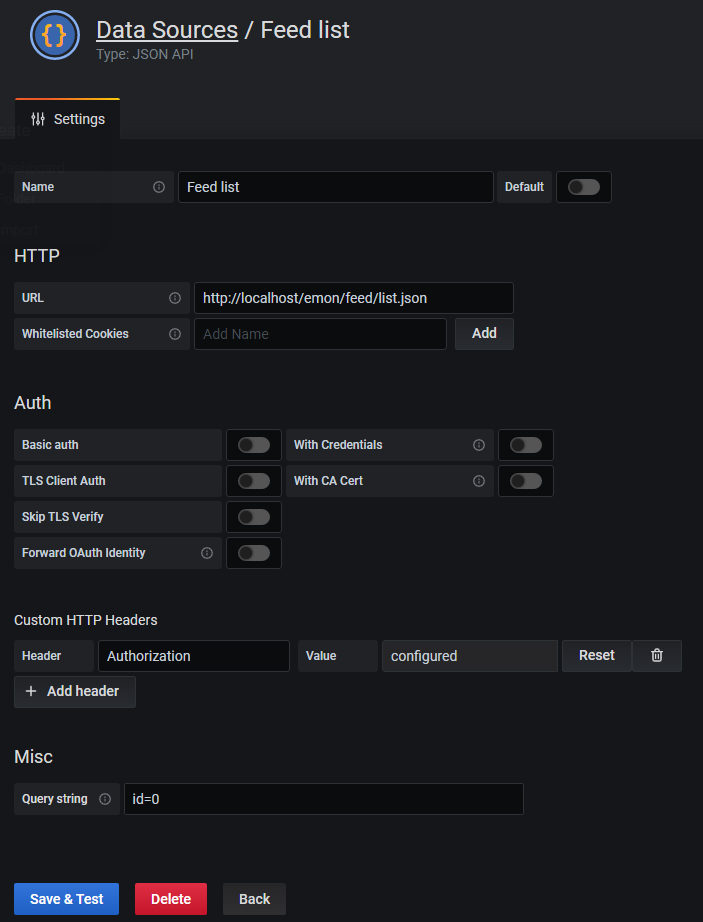
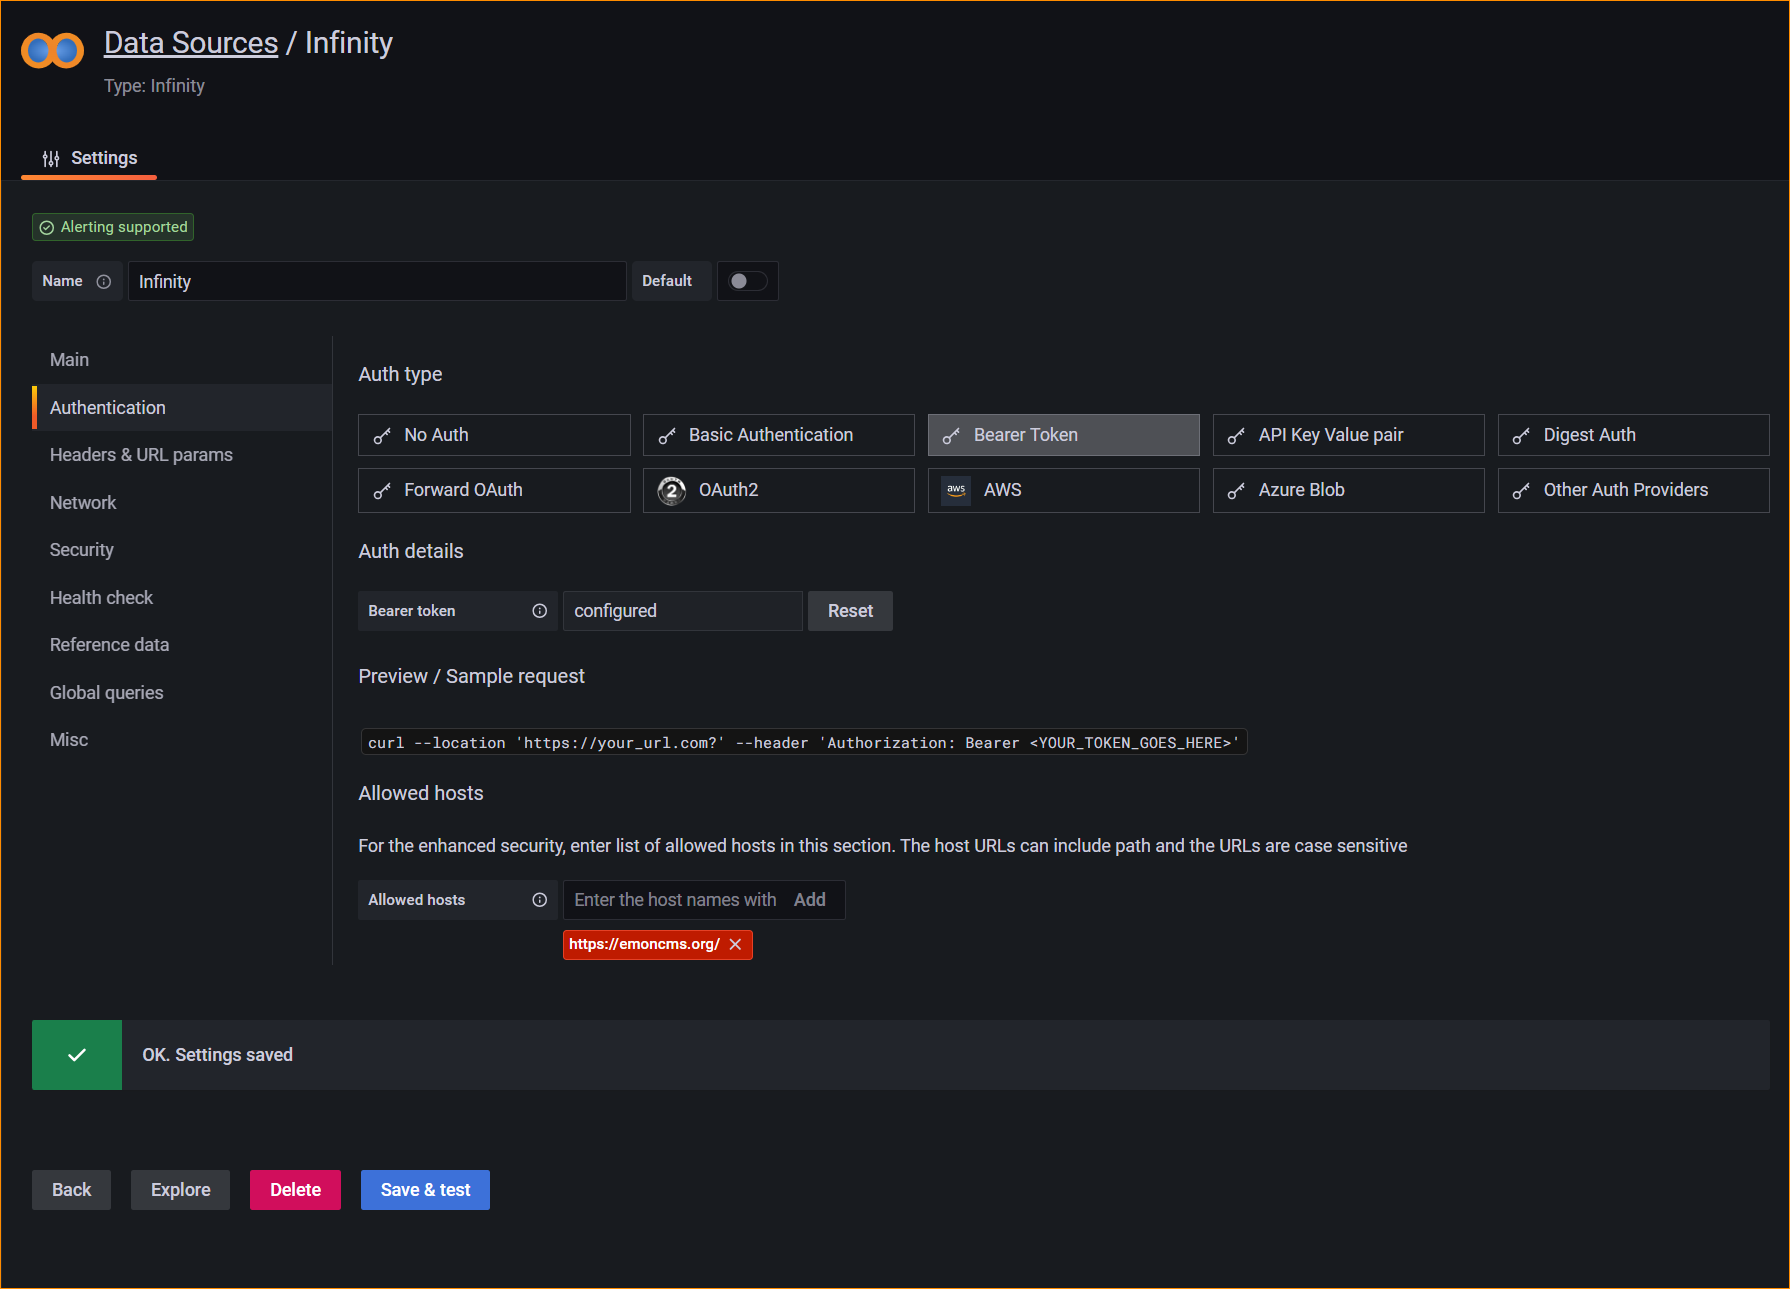
It seems the JSON data source listed here has been deprecated, i.e. it is no longer supported. This is the recommended replacement: Infinity plugin for Grafana | Grafana Labs
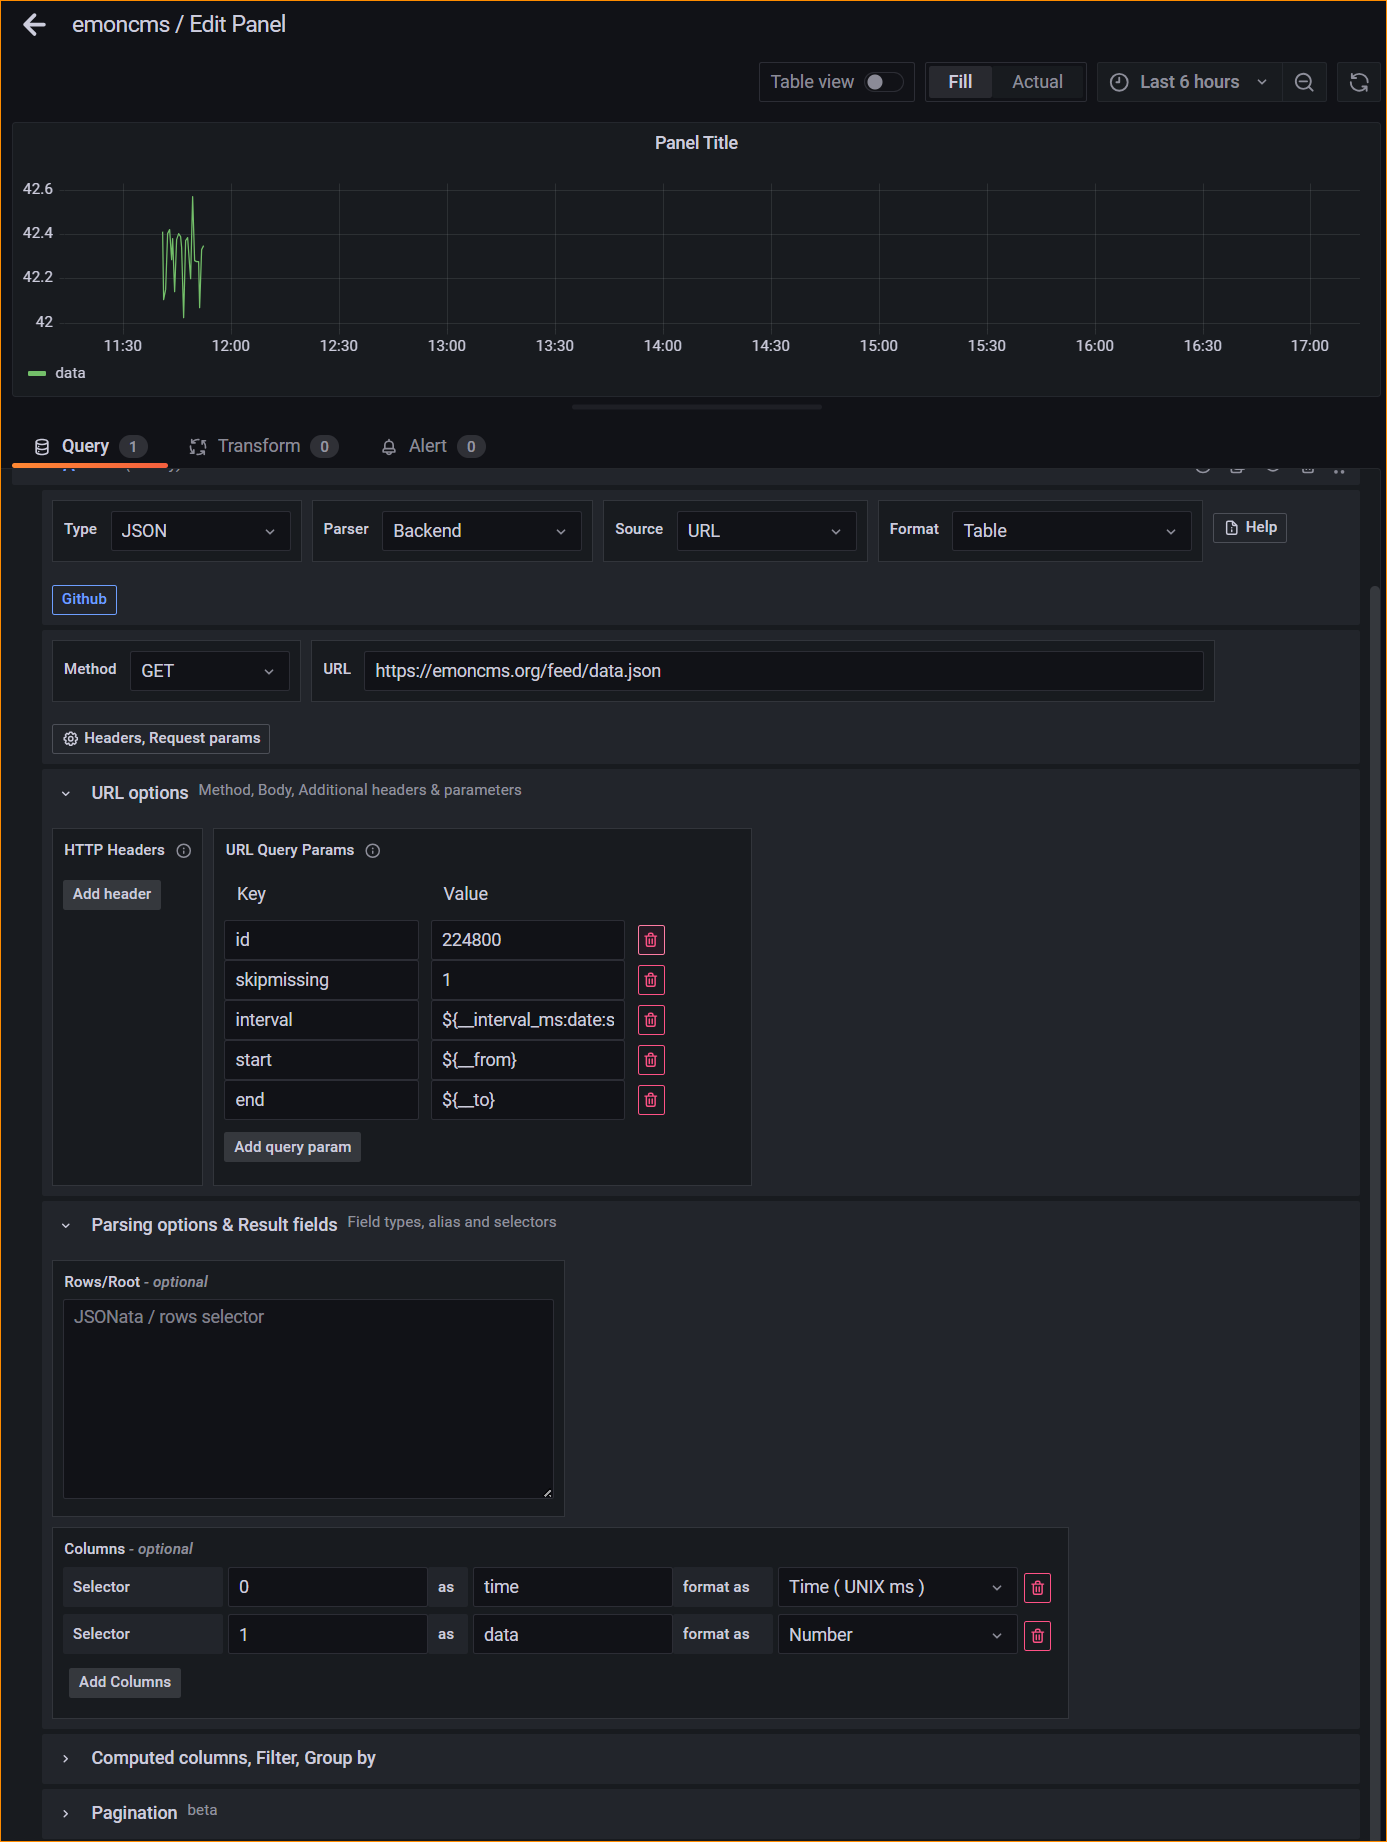
I was able to figure out how to configure it to work with emoncms (the web service, but should also work locally).
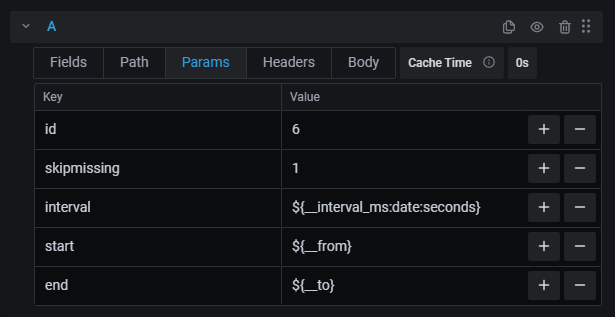
Headers, Request params
a. no headers needed
b. URL Query Params
i. key: id, value:
ii. key: skipmissing, value: 0 or 1
iii. key: interval, value: ${__interval_ms:date:seconds}
iv. key: start, value: ${__from}
v. key: end, value: ${__to}
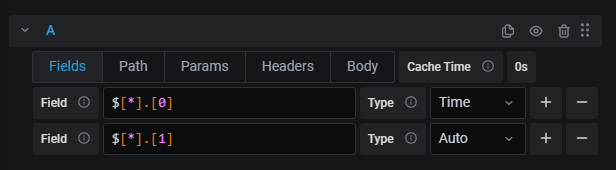
Parsing options & Result fields
a. Rows/Root - not needed
b. Columns
i. Selector: [0] for default, 0 for backend, as: time, format as: Time ( UNIX ms)
ii. Selector: [1] for default, 1 for backend, as: , format as: Number
The selectors as JSONPath (so it helps to understand that a little)
This is somewhat tedious to do, but copying queries and panels is pretty easy in Grafana
Performance seems okay, less than 1s per query, even asking for 5 years of data. I mostly use InfluxDB and Grafana, but still have some data in emoncms and wanted to see how well it would work with Grafana.