I’ve spent a bit of time recently reflecting upon what data I need from my emonTX, emonTH & solar diverter, and how I would like the data presented.
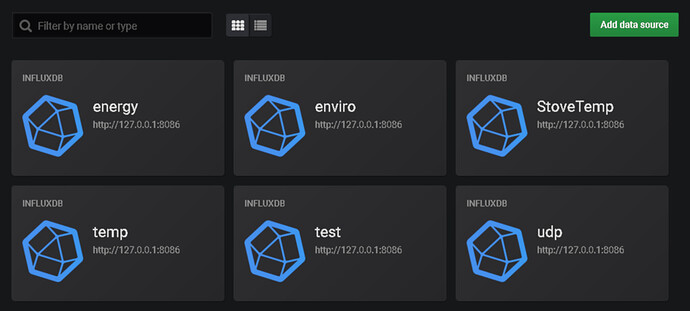
As a result, I’ve built a system which instead of using emoncms, uses node-RED to capture the data, influxdb to store data, and Grafana to display the results.
I get the data by listening on /dev/ttyAMA0 with a node-RED serial node and capture the RF binary packets. To decode the data packets, I’ve written a node-RED node - node-red-contrib-rf-decode to do just that, which is available from the node-RED palette.
The complete flow that I use is;
The 4 function nodes contain minimal code to format the data so that the Influxdb node is able write it to a Influxdb time-series database.
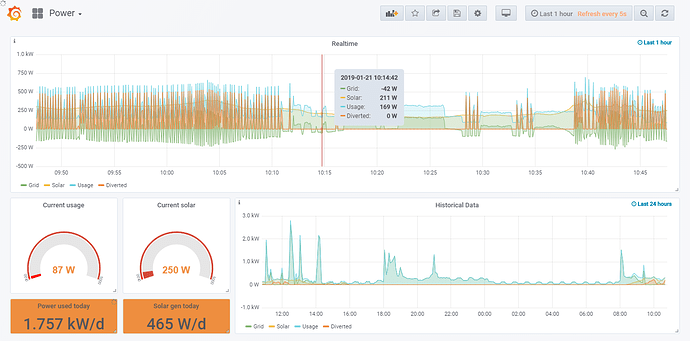
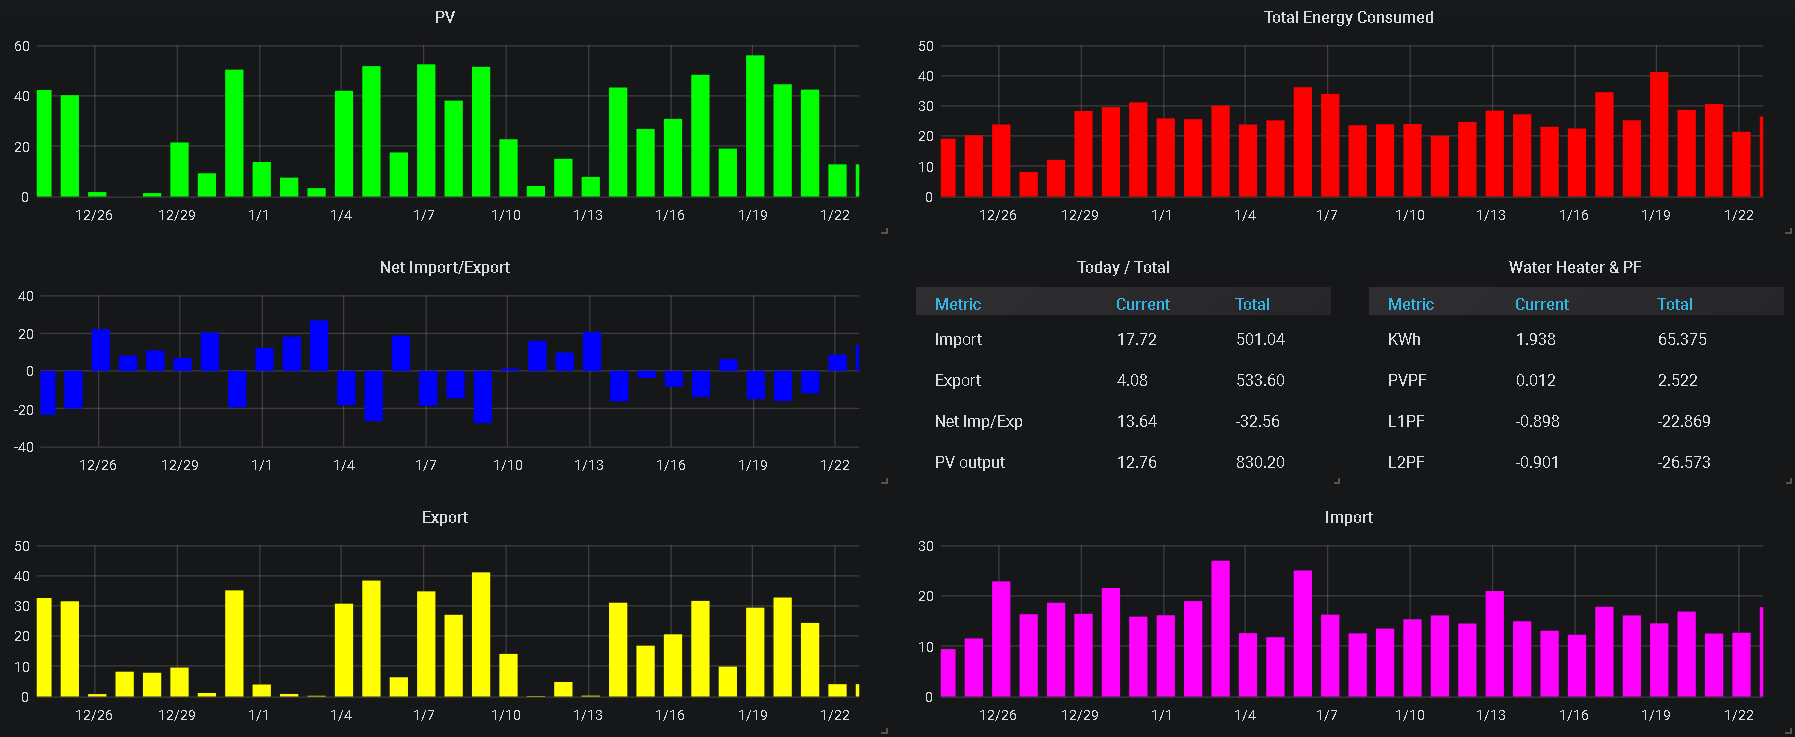
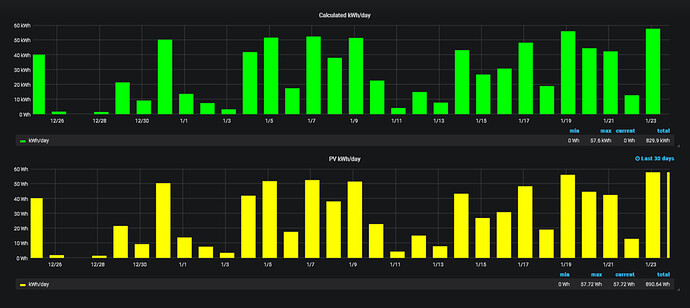
Grafana, is querying the database and present the data in it’s own dashboard. (click the image for full size)
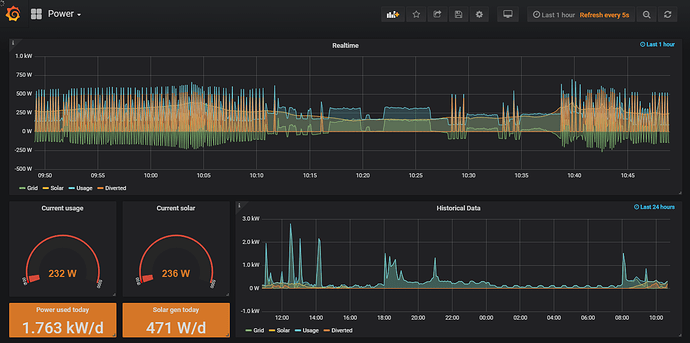
…or a dark theme…
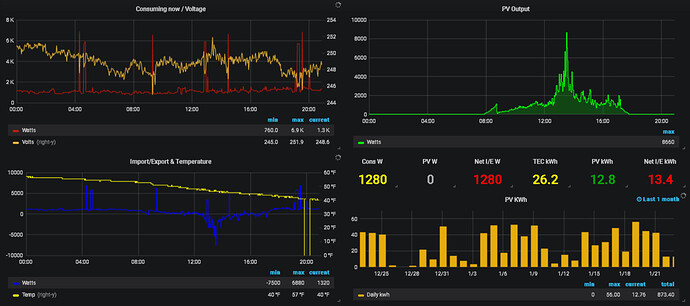
Each of the charts are refreshed every 5 seconds and can be zoomed in or out, or panned, and the gauges & boxes change colour depending upon the data value.
The database automatically downsamples the data, and only retains 1 day’s worth of realtime data, but retains the downsampled data for 1 year, to stop the database boating.
The dashboard is published over SSL, and is password protected.
NOTE - This is not a replacement for emoncms. Emoncms contains more features, and more detailed analysis tools than my personal project. Also influx & grafana can present a learning curve not suited to everyone. (as I found out!)

