then I stand corrected… perhaps I will revist grafana again… on my IOT monitor
okay after little more testing. I found that the method i was using above was not that accurate for calculating usage or production as my sends where not coming in at exactly 1 second every time. this way is much better as the rate of send can be what ever - 3 times a second, once a second or every 5 seconds . it always give you the the correct usage or production…
SELECT sum("value")/count("value")*24 AS "Grid Consumption" FROM "collectd"."autogen"."mqtt_value" WHERE time > now() - 720h AND "type_instance"='grid1' GROUP BY time(1d) FILL(null)
adds all the incoming values together divides by the the number of values in the sample multiplied by the period of time you wish to display - in this case each 24 hr period over 30 days
@stephen have you tried the example query mentioned several posts above which uses Integral to perform the sum.
does not work for me very accurately
sure on the consumption side it seams fine all the usages are about the same… but on the solar production side not so much so … currently my consumption is very high this last month as it being brutally cold absolutes temps of -43c and wind chills of - 50c - 60c. also we had most of our snow come this month so it being shifting from very bright skies ( when it cold) to very cloudy and overcast (when it snowing). so there the whole gambit of different day types…
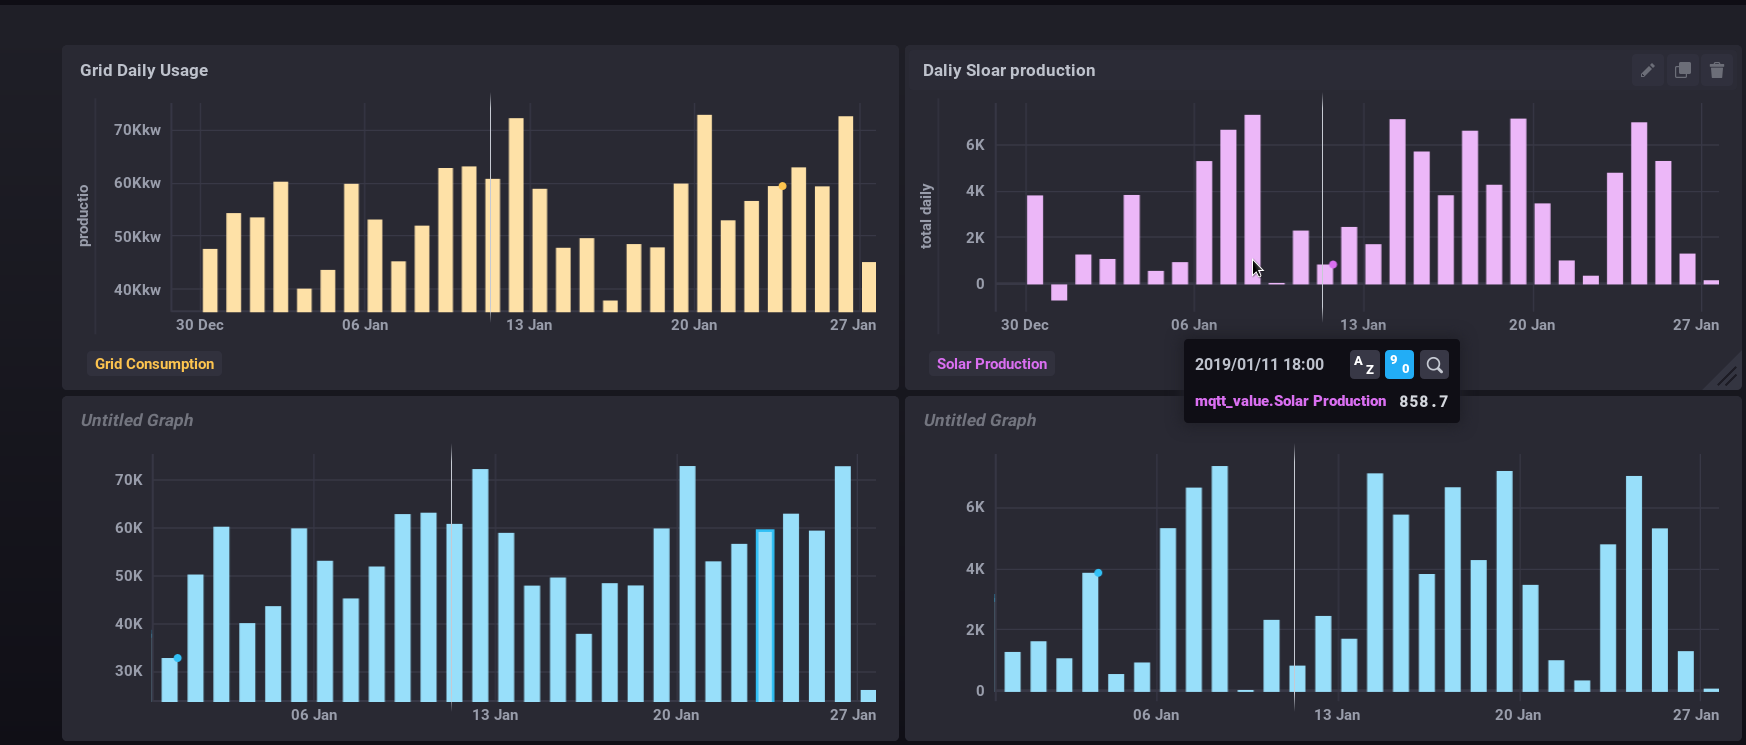
as you see from the graph especially my solar on the top pink is shows that I produced less then what i consumed on the second day which is accurate. the day was cloudy and snowy and i probably had a a foot of snow sitting on the panels. and when I check that day specifically it consumed more then it produced all for that 24h period… so i should of had a negative marker as what displayed in the pink… the one right below is the graph generated by the use of intergal… it shows I produced 900 watts which is not possible… as it looks like it shifted some of the preivous day into that day…
also it seams to take twice as long to generate as integral compared to the way i do it
Sounds like ‘Ice Road Truckers’ weather…
I can relate to that, having lived in Fairbanks, Alaska.
You know it’s damned cold when the high of the day is -32°F!
Life below -40°F gets to be a real PITA.
actually since you mentioned it . the husband of a friend of mine was on that show for a couple seasons a couple years back - the brutal cold days are tough <-35c - but weather between - 20c are - 32c not so much so … especially this time of year… since the sun so strong. heck by March the sun intensity so strong … you can walk around in tee shirts and shorts at -10c… also the humidity at those temps are so low it feels warmer then -10c in Nov and Dec … My wife is from Germany and when I use to travel there in the wintertime-- now that brutal 100% humidity at - 10c… I could not stay warm even under a foot of blankets… do not feel bad for me, I feel bad for those who live in warmer damper regions… now that brutal for me
Grafana 6.0 Beta is available.
Some nice additions to the feature list.
Looks great, will have to download it soon.
Tempting as it is… I think I’ll await the stable release :![]()
![]()
![]()
Just looking at the install docs, did you guys install the default sqlite3 database or use an existing mysql (mariadb) database?
Is there any advantage to installing another database engine? Since many of us already have a mysql database engine installed and most likely installing influx too, do I really need sqlite3? Is it advantageous to stick with the default (well trodden path?) that Grafana proposes? For example, else where in the docs do they always assume you are using sqlite3?
I went with the default. (SQLite3) I figured if they chose it as the default, it should
be safe to go with that choice.
SQL3 keeps all its data in a single file vice the conglomeration of files that MySQL is.
I didn’t get the impression the Grafana devs assumed the use of SQL3 anywhere other
than Grafana itself.
No I meant was there a bias to sqlite in documentation or on the forum etc, like here it is often assumed users are using phpfina when they could be using mysql (for data) for example.
I’ll most likely go with the default recommendation if I go ahead, it’s no biggy, I was just wondering if I could use mysql IF it’s already there for emoncms without adding complication or disadvantage.
None in the docs, that I could see. (assuming you’re speaking of the Grafana docs)
Haven’t seen much mention of Grafana on the forum, but what little I’ve seen
(as best I can recall) has never said anything about the internal database.
Sqlite comes bundled with the Grafana installation and is set up automatically, although you could switch to Mariadb if you wished.
I don’t think you can use sqlite as a datasource though, it’s purely to store the config.
Correct.
From: Configure Grafana | Grafana documentation
Grafana needs a database to store users and dashboards (and other things). By default it is configured to use sqlite3 which is an embedded database (included in the main Grafana binary).
There’s nothing much really to “install” for sqlite3 - its a database file and some libraries - there’s no service or anything that runs constantly on your server. If that is where they’ve chosen to store the config by default, I can’t think of a single good reason to change it.
Amen. ![]()
Going with SQL3 definitely makes it harder to “shoot oneself in the foot” when installing.
Hi @Bill.Thomson, how do you feed the data into the Influxdb instance?
Hi Brian,
Data upload gets done with a python script.
I use HTTP formatted in the Influx Line Protocol.
Network connection is Ethernet.