Aah, finally got it!
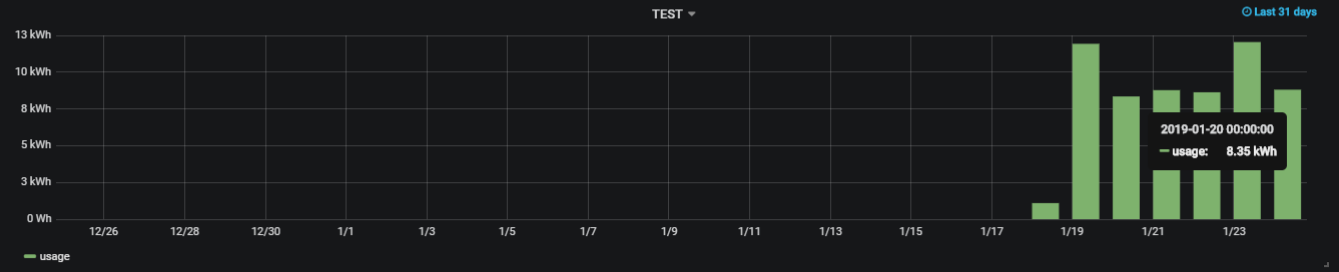
SELECT INTEGRAL(usage,1h) FROM "one_year"."downsampled_iot" WHERE TIME >= now() - 30d GROUP BY time(1d)
Just need to tidy up the X Axis so the date sits centrally with the corresponding bar, and the label -kwh/d.
Thanks Bill
YW,S!
Looks good.
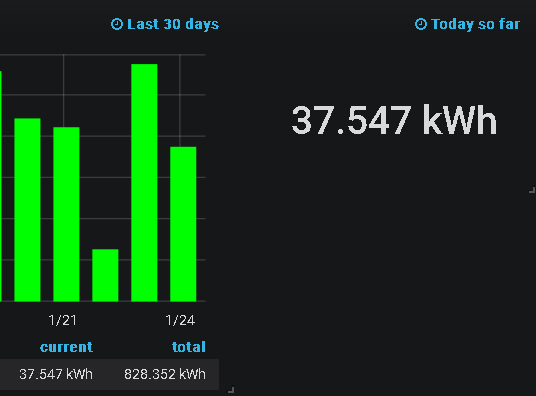
I found that plugging the same query (sans everything after “where time…”) into a single stat
panel yielded the same results as the last bar on the bar chart.
Edit - SELECT integral(*,1h) FROM "GENW" WHERE $timeFilter is the query I used.
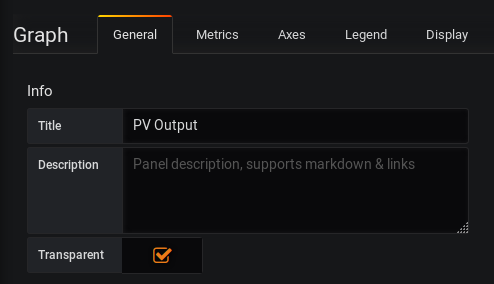
Tip for ya…
Under the General tab in the graph editor, tick the transparent box. It’ll make the background
a bit darker and yield (IMO) a nicer looking panel.
Just looking back at why your query didn’t work after toggling the Edit Mode…
It appears that the editor doesn’t like one the ,1h in (“usage”,1h).
To test, I’ve pasted this into the ‘cmd prompt’ editor, and the preview chart displays OK.
SELECT integral("usage",1h) FROM "one_year"."downsampled_iot" WHERE $timeFilter GROUP BY time(1d)
But, if I toggle the editor to the ‘graphical’ editor, the chart data changes and is incorrect. But toggle the editor back to the cmd prompt and the query has also changed, as it’s deleted the ,1h
SELECT integral("usage") FROM "one_year"."downsampled_iot" WHERE $timeFilter GROUP BY time(1d)
Is there a different way to write ("usage",1h) to avoid this?
I’ve never given it any thought. Something of a “set it and forget it” type of thing,
so I never checked to see if it could be done differently.
Have you taken a look at https://play.grafana.org/?
Lots of dashboard examples you can make any changes you want, to.
Play with, and test new ideas, etc w/o messing up your own system.
Yes, I found it a couple of day’s ago, it’s a great place to see what is possible with Grafana.
Trouble is, my power dashboard is growing in size every day as I explore new options!!
I need to think about menus & navigation…
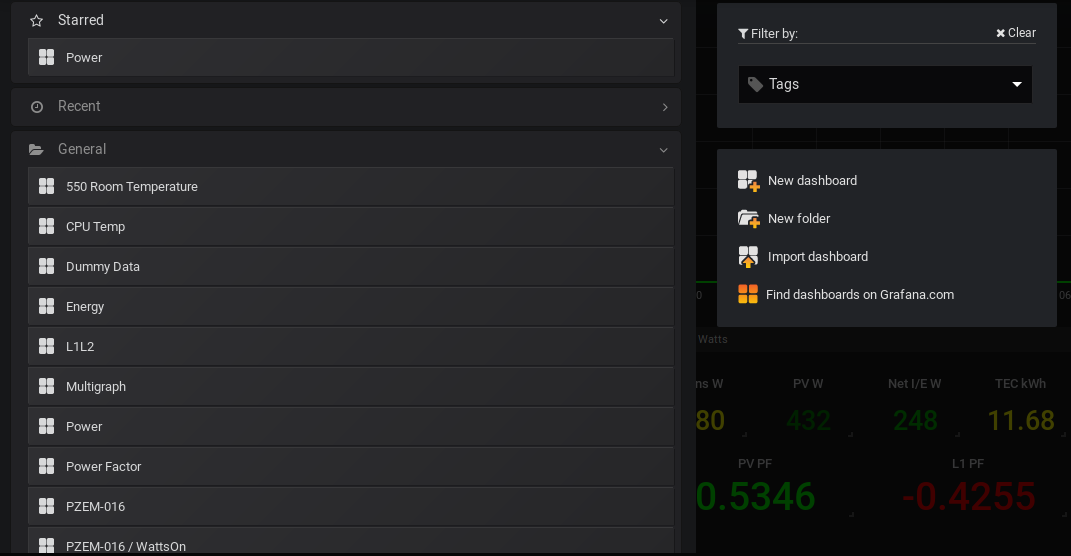
There’s a dashboard item (a panel) that is a “list” of dashboards…
Plus you can “star” a dashboard for quick retrieval.
…which is what I used in my example above!!
Aaahh!
Thanks Bill
Yep. Save for the cumulative sum function, they’re the same. 
One more “shortcut” I find handy:
Hover your mouse over the panel you want to edit, then hit e on your keyboard to edit the panel.
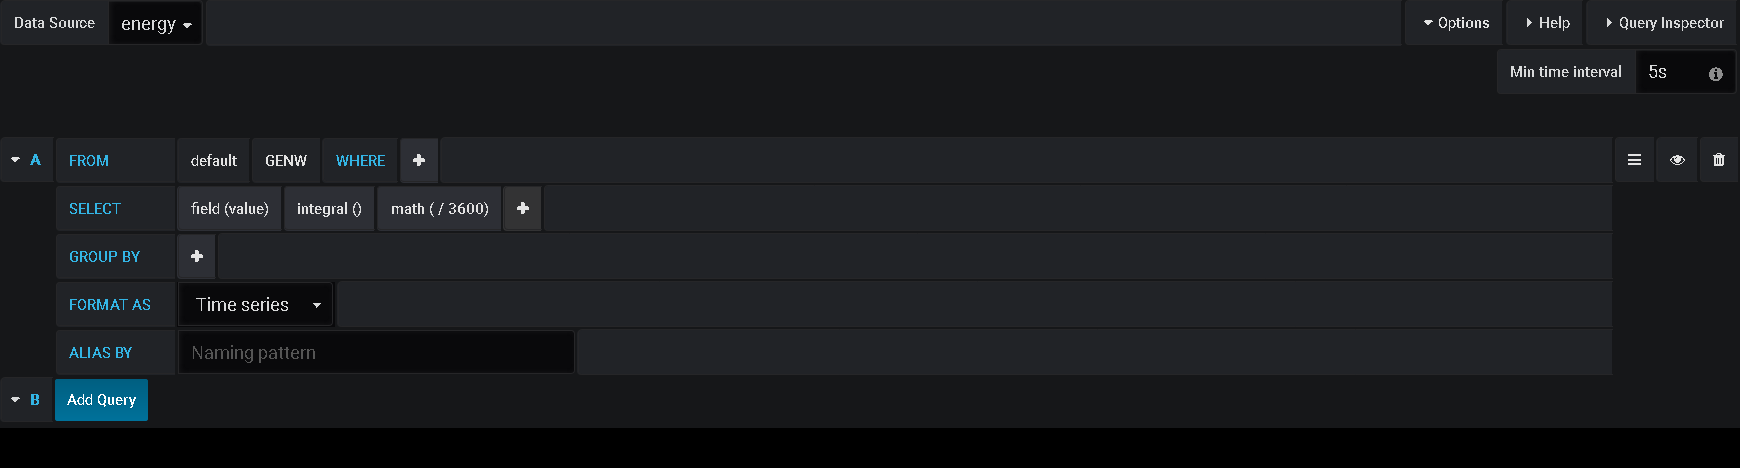
I know this is for grafana topic – but chronograf can do the same quite easily…
first set up your values
I know alot of people gravitate towards grafana ( so did i) but once you get use to the more hands on approach for chronograf… the more and more I like chronograf as it can actually do more then grafana can with significantly less cpu overhead
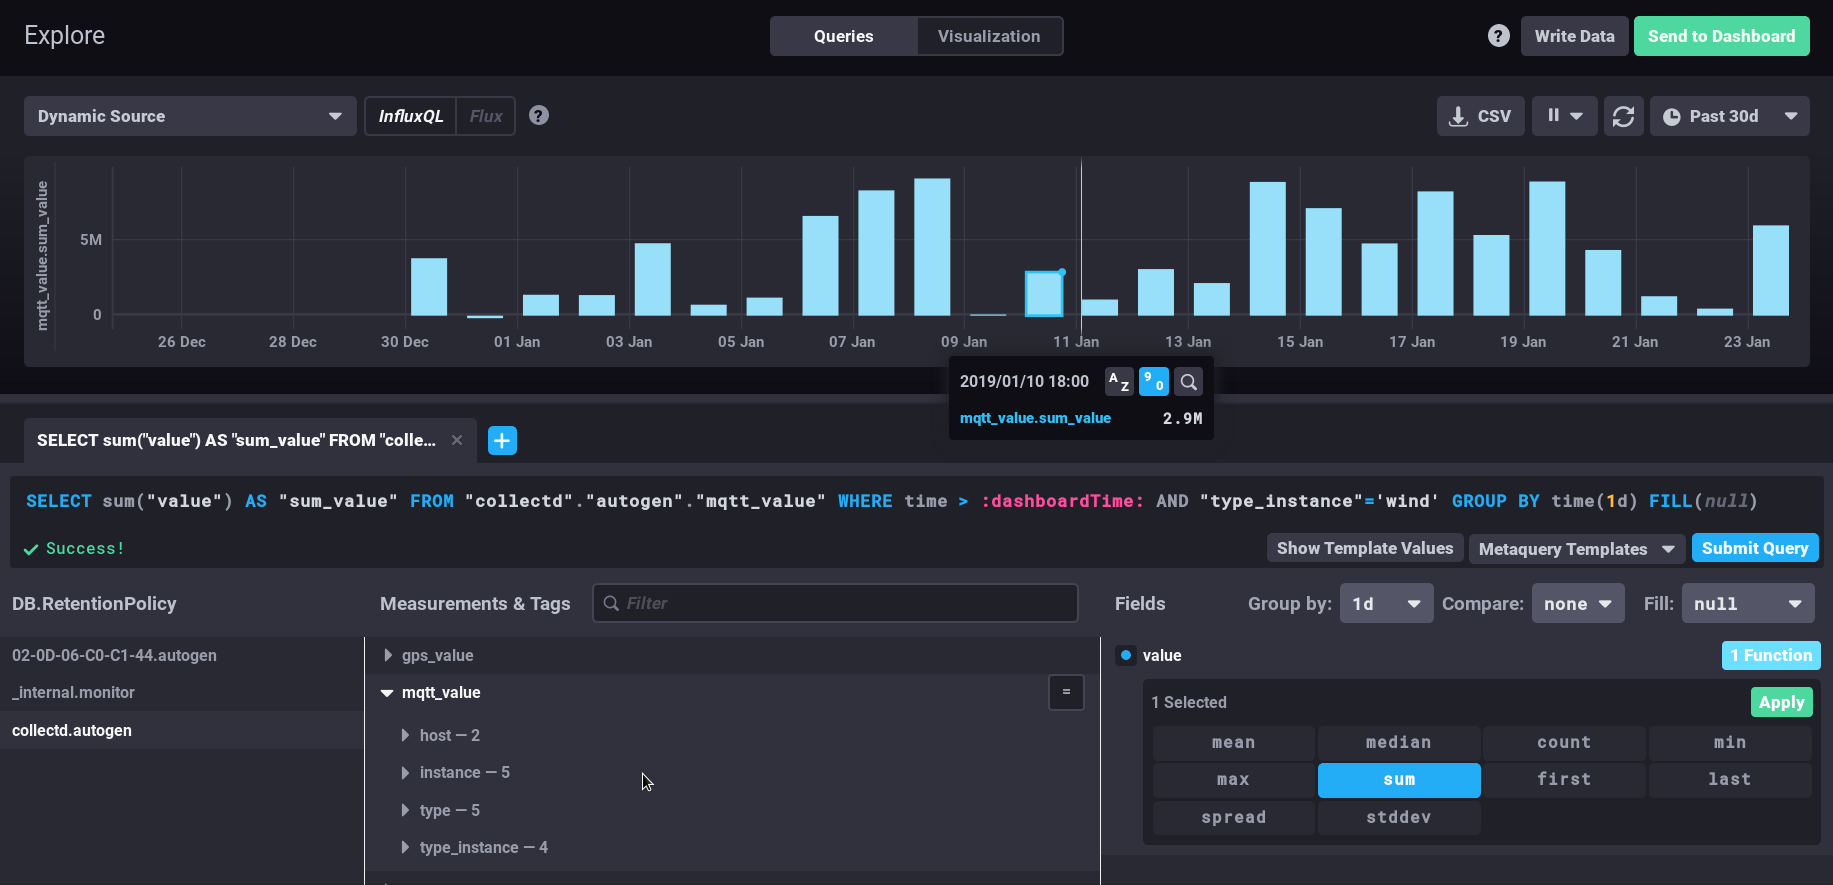
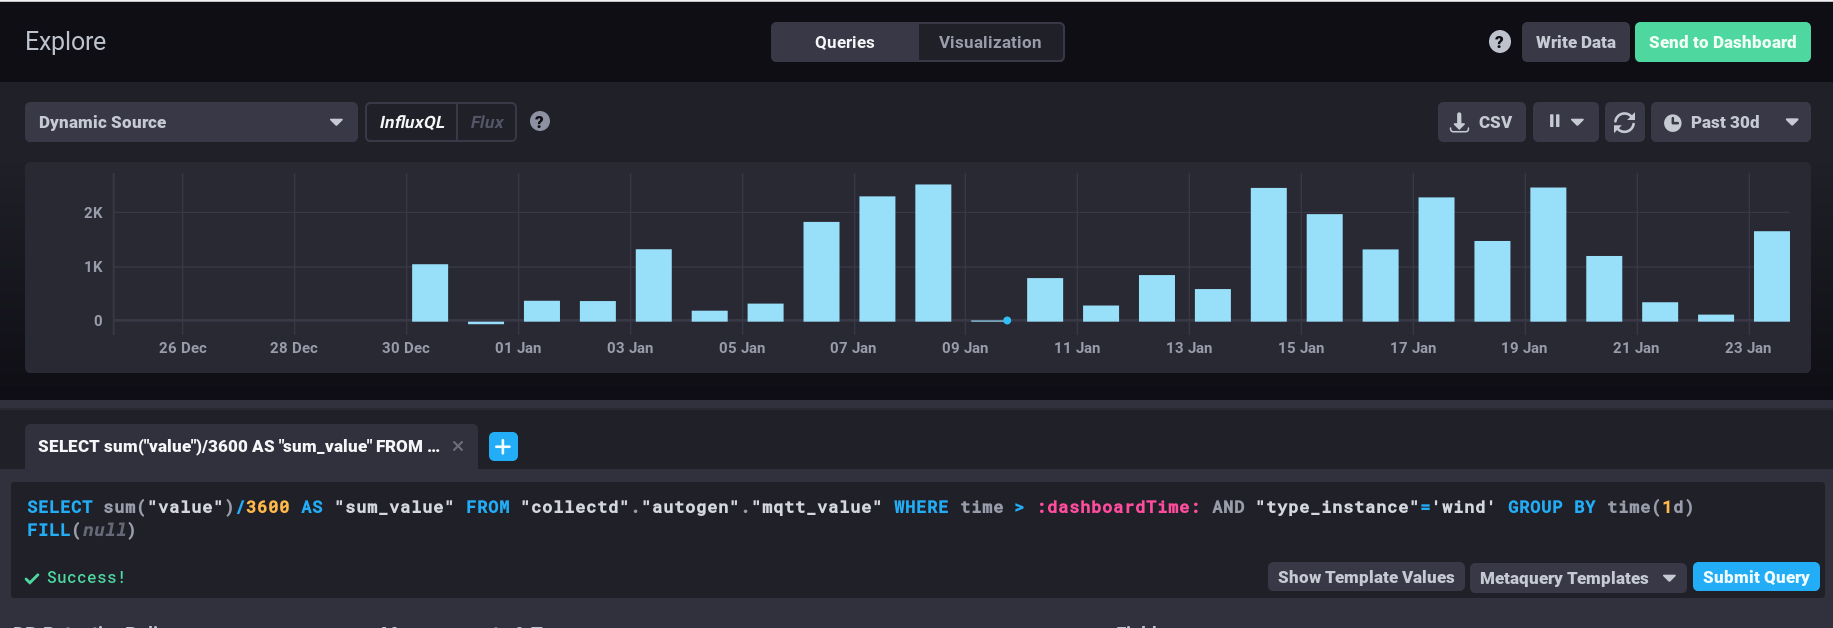
I thought i just add: to get over a specified period ie 30 day period – just change :dashboardtime: to now() - 30d
The ‘folders’ menu option, is very imposing & cluttered, I just need a minimal menu system.
I’m using the ‘Dashboard List Panel’ at the moment, but it’s still very basic & ugly. It does not collapse, and doesn’t render correctly on mobile devices.
Is this of any help?
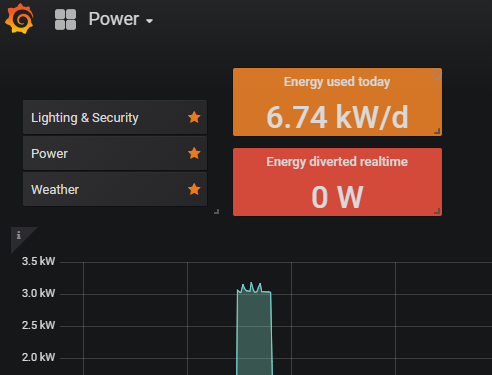
BTW, shouldn’t that read Energy used today x.xx kWh ? (vice kW/d)
Thanks @Bill.Thomson, the label was auto generated via the Value Unit Template (plus a Postfix) - I’ve found the Watt-hour template now, instead of the ‘Watt’ template, and it displays correctly.
Paul
@stephen I did look at chronograph and was tempted, but thought that as Grafana was more popular, that there would be more support available than with chronograph. That’s the only reason.
@Bill.Thomson Well, a little html, using grafana’s own stylesheets, and it’s possible to create a static menu, using a text panel.
As an alternative, there are Dashboard Links, but they are not visible if opened in kiosk mode, so disregarded.
no worries… grafana much easier for alot of stuff and chronograf is not for the faint of heart that for sure… but has some nice features such as variables - you can save screen space. example :
Grafana has variables too. ![]()