Care to share? ![]()
I suspect I’ll use MQTT as the feed and then Node-Red but always interested in other ways.
Care to share? ![]()
I suspect I’ll use MQTT as the feed and then Node-Red but always interested in other ways.
if you’re interested in other ways- you could try my way by using collectd
which allows you collect by many methods – mqtt, modbus, smnp curl, tail etc … as collectd gathers info it uploads it directly to influxdb…
nicest thing about it once it set up for Mqtt all you need to do is send your formated mqtt and it automatically create the new data inputs for you
Here ya go:
wattson.gz (2.5 KB)
I’m not a coder, so there’s no error handling in it.
Now give me a radar system or a piece of avionics… 
(I figure I got along just fine before I had the data, so if I lose any of it now, no big deal)
I’ve added comments to the parts that aren’t self-explanatory.
Thanks.
Ah yes, I remember you mentioning that before. I did look briefly but no further. I’ll have another look.
For system monitoring I prefer netdata.
![]()
Is there any way to use Grafana directly from emoncms feeds database?
I don’t really see any point feeding exact same data into another piece of software, just to read it back out for displaying. When emoncms already saves this data somewhere.
it not hard to setup here a quick how to:
just scroll through collectd conf enable or disable what plugins you want to use ( i only use mqtt, modbus and snmp )
enable mqtt plugin: subscription
point it at your mqtt host and have it listening to incoming/#
then scroll down to and enable network output plugin and in the server section and point it at your influxdb host with port 25826.
then go to influxdb conf collectd section - important to point it to the correct location of typesdb
ie:
[[collectd]]
   enabled = true
   bind-address = ":25826"
   database = "collectd"
   retention-policy = ""
   typesdb = "/usr/share/collectd"
then the mqtt format
mosquitto_pub -t 'incoming/Home/mqtt-Energy/power-grid' -m 'N:21.5'
description:
Home - the host name - I use it as a location name can be anything
mqtt-Energy: mqtt( required)- Energy ( subgroup can be anything)
power-grid: power( required and recognized in typedb) - grid ( name of input can be anything)
‘N:21.5’ : your data input
then in influxdb there should be a database created called collectd and all new inputs will automatically be created in the following format
 Home->
      mqtt->
          Energy->
               grid ->  21.5
an easy searchable database by location, type and name in influxdb
Which makes sense.
AFAIK, most (if not all) of the Grafana users who posted in this thread use InfluxDB vice emonCMS.
I don’t, I’m not using emoncms at all.
I’m using a node-RED node to listen for the data on dev/ttyAMA0 and then save it into a influx database.
Influx is the only database I have installed.
That makes two of us. ![]()
Sorry, I thought this whole forum is about using EmonCMS…
Clearly, this forum is about the openenergymonitor solution, emoncms is just one piece of the puzzle.
But still, instead of feeding data into another DB. How to get Grafana to directly read data off emonCMS feed database?
No, EmonCMS is just one component. You can buy an EmonTX to do the energy use measurement and transmit, store and manipulate that data in anyway you feel suits your needs.
The level of support for Influxdb & Grafana issues may be less here, but it is a valid solution.
Just to clarify, I’m using multiple openenergymonitor EmonTX’s & EmonTH’s, to monitor power usage, temperatures & humidity.
As Brian has already said ‘emoncms is just one component’.
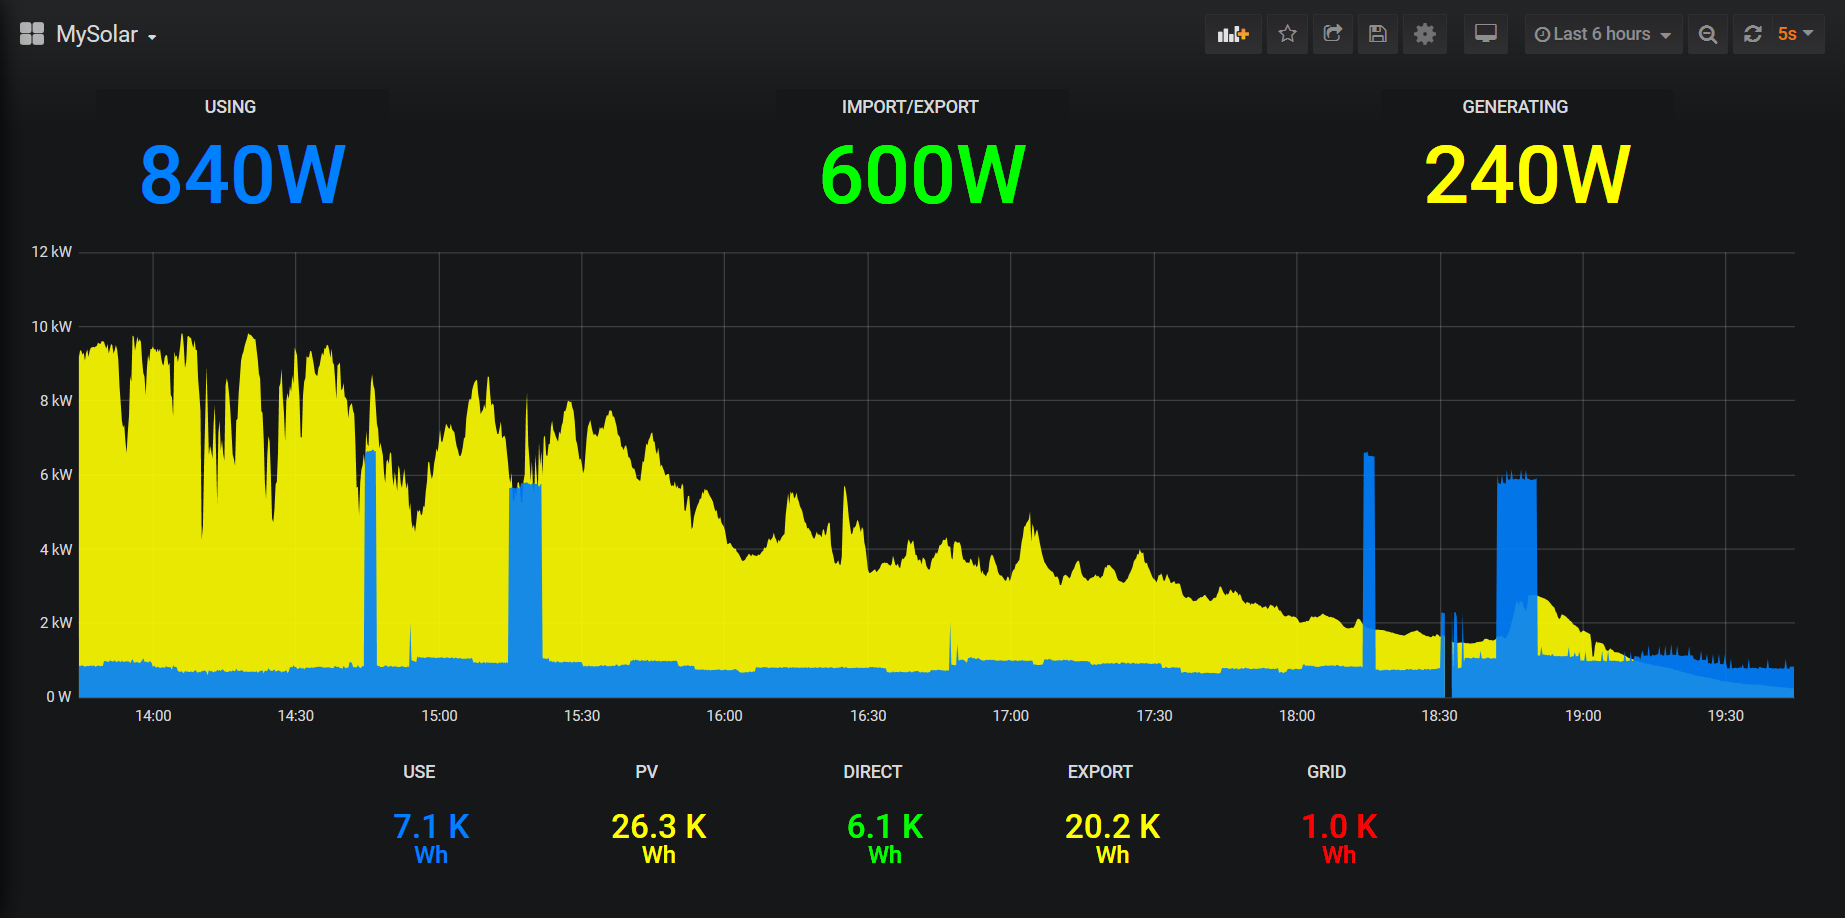
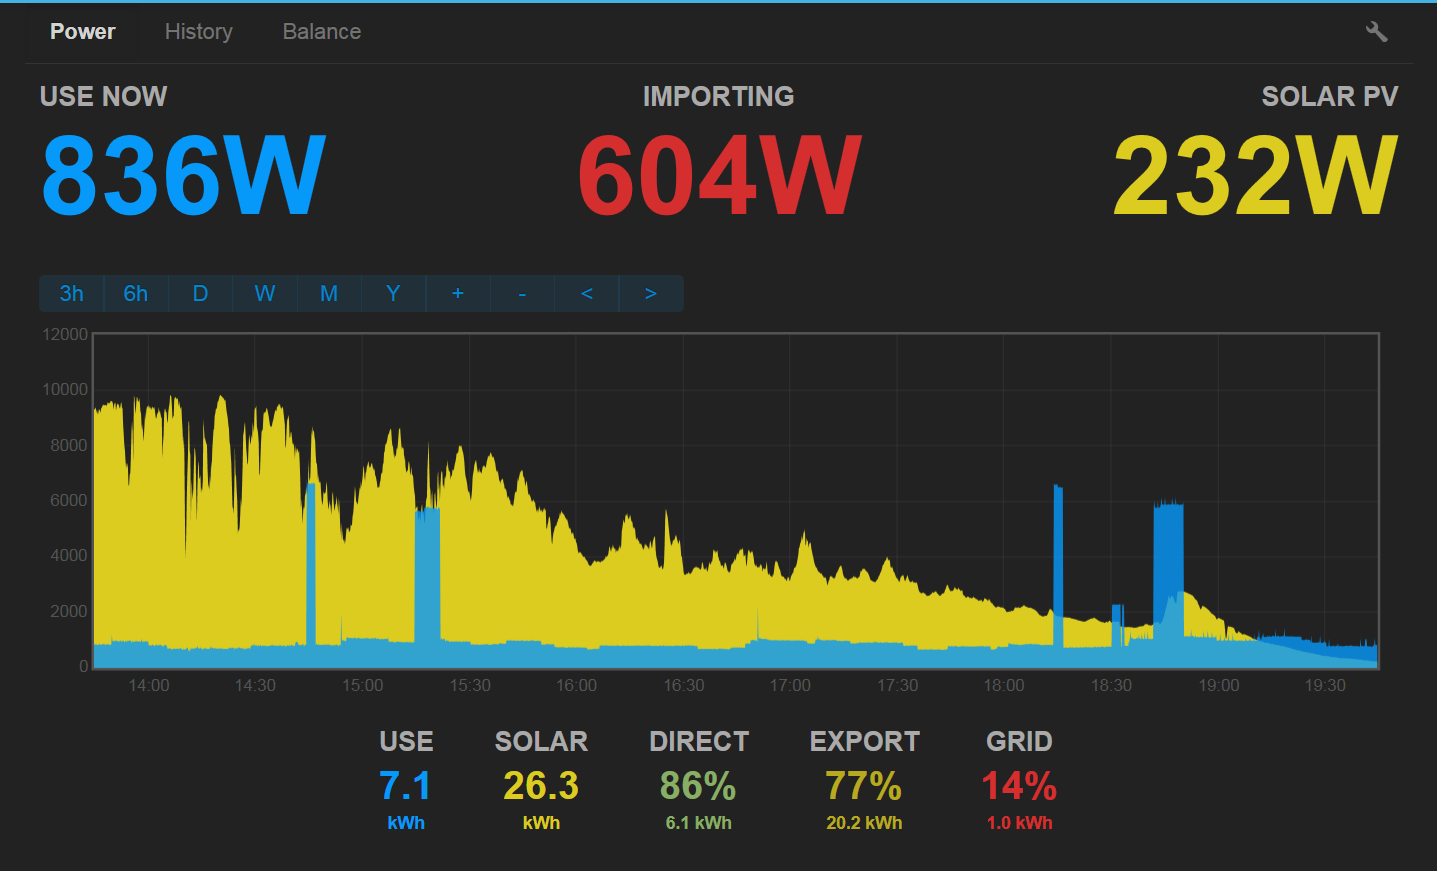
Just for the hell of it, I decided to have a go at “duplicating” the MySolar app as a Grafana dashboard.
Despite having the luxury of a Wh meter that’s capable of import/export and consumption energy measurements, I used Grafana’s integral function on the power measurementts to enable on-the-fly calculation based on window timespan similar to way the MySolar app works. The power values are slightly different because of the time it took to do the screen capture.
Here’s the results:
Missing are the percentages as well as the history barchart and balance line.
As a test, I modified the MySolar javascript code to show 2 decimal places (not shown here)
to get a better idea about the accuracy of the calculated energy values.
The difference was consistent at ~20Wh.