Proof Of Concept
ie. I didn’t know if the learning curve to use influx & grafana would be too steep a learning curve for me!
I’m still struggling with db queries…
Ah yes. (Slaps self in face) Should’ve known that one. ![]()
Have you had a look at the Influx Line Protocol docs?
Are you trying to work out the queries manually or through the Grafana interface?
Both really Bill, mostly through the Grafana interface, but some are direct influxdb queries made by node-RED.
Mostly both are straightforward, but things like calculating kwh/d from power readings was not easy, but ‘google as my friend’, we eventually got there!!
Paul
This is what I came up with. Is yours similar?
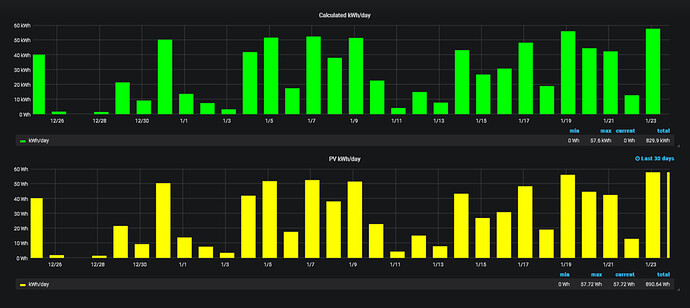
SELECT INTEGRAL(*,1h) FROM GENW WHERE TIME >= now() - 30d GROUP BY time(1d)
(GENW is PV output in Watts)
Gives me this:
The top chart uses the query shown above.
The bottom chart shows the data as reported by a WattsOn universal power transducer.
I’ve not got as far as charting kwh/d yet, but I’m also using integral to get the daily total;
SELECT cumulative_sum(integral("usage")) / 3600 FROM "iot" WHERE ("device" = 'diverter') AND $timeFilter GROUP BY time(1s) fill(null)

The time frame is set in the ‘Singlestat’ Time range tab setting.
@Bill.Thomson have you a screenshot of your grafana metrics tab please. I don’t seem to be able to get your query working here ![]()
Have you changed the query edit method so it looks like this?:
(via the hamburger menu at the right side of the query editor window)
I can’t access the machine running that particular query ATM, but I’m off work in an hour, so I’ll
shoot you a copy when I get home.
Yes, and pasted your query (editing for my database details) but whenever I toggle it back, I lose anything that I’ve added. Do you leave it permanently toggled to query view?
I think that I’ll probably find it easier working from a screenshot, so thanks.
Yes.
Odd that it didn’t work. Could you show me your query window with the contents you pasted?
Aah, finally got it!
SELECT INTEGRAL(usage,1h) FROM "one_year"."downsampled_iot" WHERE TIME >= now() - 30d GROUP BY time(1d)
Just need to tidy up the X Axis so the date sits centrally with the corresponding bar, and the label -kwh/d.
Thanks Bill
YW,S!
Looks good.
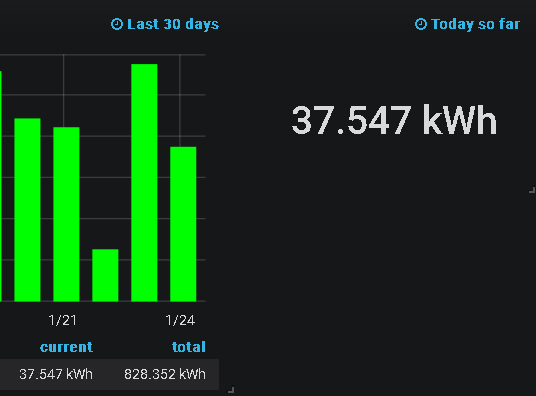
I found that plugging the same query (sans everything after “where time…”) into a single stat
panel yielded the same results as the last bar on the bar chart.
Edit - SELECT integral(*,1h) FROM "GENW" WHERE $timeFilter is the query I used.

Tip for ya…
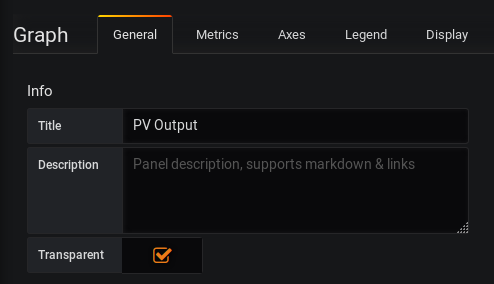
Under the General tab in the graph editor, tick the transparent box. It’ll make the background
a bit darker and yield (IMO) a nicer looking panel.

Just looking back at why your query didn’t work after toggling the Edit Mode…
It appears that the editor doesn’t like one the ,1h in (“usage”,1h).
To test, I’ve pasted this into the ‘cmd prompt’ editor, and the preview chart displays OK.
SELECT integral("usage",1h) FROM "one_year"."downsampled_iot" WHERE $timeFilter GROUP BY time(1d)
But, if I toggle the editor to the ‘graphical’ editor, the chart data changes and is incorrect. But toggle the editor back to the cmd prompt and the query has also changed, as it’s deleted the ,1h
SELECT integral("usage") FROM "one_year"."downsampled_iot" WHERE $timeFilter GROUP BY time(1d)
Is there a different way to write ("usage",1h) to avoid this?
I’ve never given it any thought. Something of a “set it and forget it” type of thing,
so I never checked to see if it could be done differently.
Have you taken a look at https://play.grafana.org/?
Lots of dashboard examples you can make any changes you want, to.
Play with, and test new ideas, etc w/o messing up your own system.
Yes, I found it a couple of day’s ago, it’s a great place to see what is possible with Grafana.
Trouble is, my power dashboard is growing in size every day as I explore new options!!
I need to think about menus & navigation…
There’s a dashboard item (a panel) that is a “list” of dashboards…
Plus you can “star” a dashboard for quick retrieval.


