Maybe not too terribly complex. ![]()
A continuous query makes it fairly easy to downsample data to a user defined interval
Paul Reed uses this one: (Ref: Grafana Dashboard Project - #5 by Paul)
cq_5m
CREATE CONTINUOUS QUERY cq_5m ON emondata
BEGIN SELECT mean(grid) AS grid, mean(solar) AS solar, mean(divert) AS divert, mean(usage) AS usage INTO emondata.one_year.downsampled_iot FROM emondata.one_day.iot GROUP BY time(5m), grid, solar, divert, usage
END
Which I adapted to suit my need and came up with:
cq1
CREATE CONTINUOUS QUERY cq1 ON energy
BEGIN
SELECT mean(*) INTO energy.autogen.AVPV FROM energy.autogen.GENW GROUP BY time(1m)
END
It downsamples 5 second data to 1 minute data.
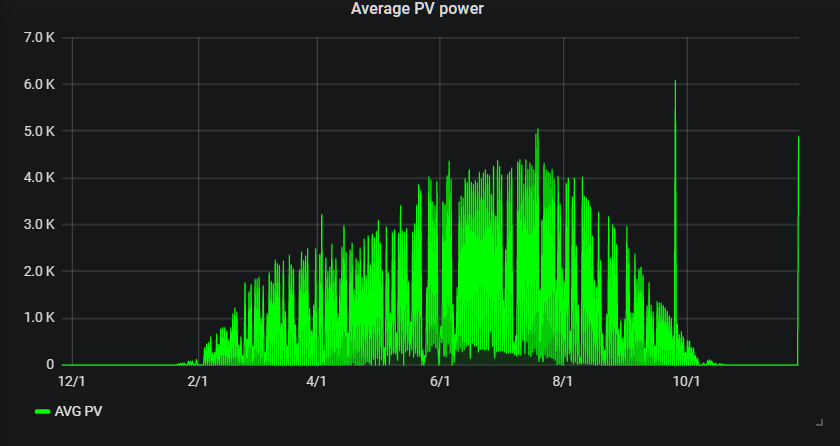
Yields a graph that appears on-screen very fast
Eight months of data popped up on-screen in well under 0.5 seconds. Viz: