Does your Windows box have the same address?
Do you mean the address used to access the DiyBMS Management Console?
Sorry for the confusion.
Is your windows box IP set to 192.168.0.129?
It wasn’t but it is now. Thank You for that. I’ve powered down/re-booted the ESP controller just to be sure. I’ll try restarting the Influx service.
Ok, Progress! Doing a ‘show measurements’ produces ‘name’ – ‘Cells’
Coolness! That means the database is getting populated. ![]()
Yay! Thank You Thank You. Grafana is still giving me that annoying red upper-left corner.
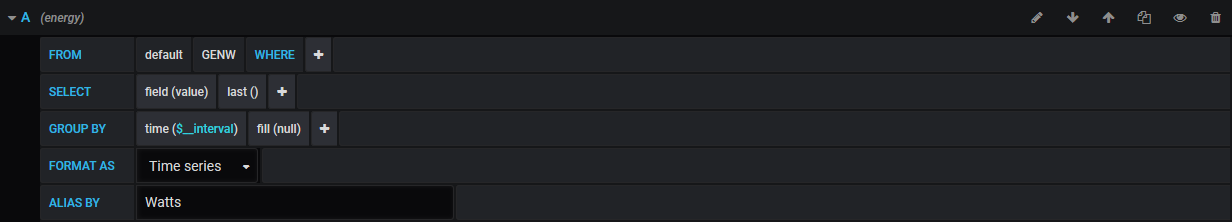
Recheck your query. Try pulling down the field name selector and see if “cells” is in the list.
I’m assuming you mean field(value). When I click on value there is nothing there.
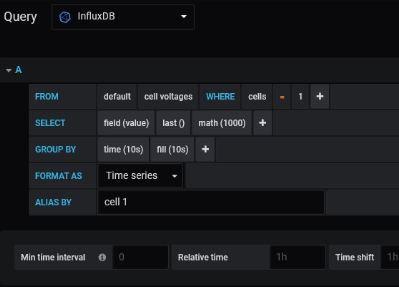
In the screencap shown above, the one named cell voltages.
No. It doesn’t show ‘Cells’. I’ve added another query and that also doesn’t show ‘Cells’
You mean when it’s clicked on, it shows nothing, correct?
Correct. It only shows ‘cell voltages’ in the one with cell voltages already there. The new query shows nothing.
For now, delete the math(1000) part of the query. Let’s keep it simple while we’re troubleshooting.
When you hover your mouse on the red triangle, what’s the error text say?
I think the math(1000) and fill(10s) parts of your query are part of the problem.
Ok, check.
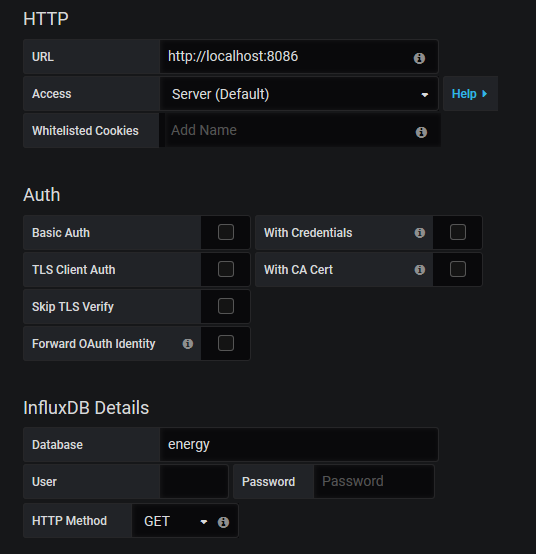
I think I’m going to delete the data source and add a new one. I noticed earlier that when I changed the HTTP url to something different, and then changed it back to the port number, doing a test/save failed.
The red triangle says, “Expected response data to be array, got undefined”.