When I set my Access to Server(Default), the test fails. Only on Browser does it succeed.
No worries. That’s normal behavior. It’s configuration dependent.
Could you post your new query, please sir? 
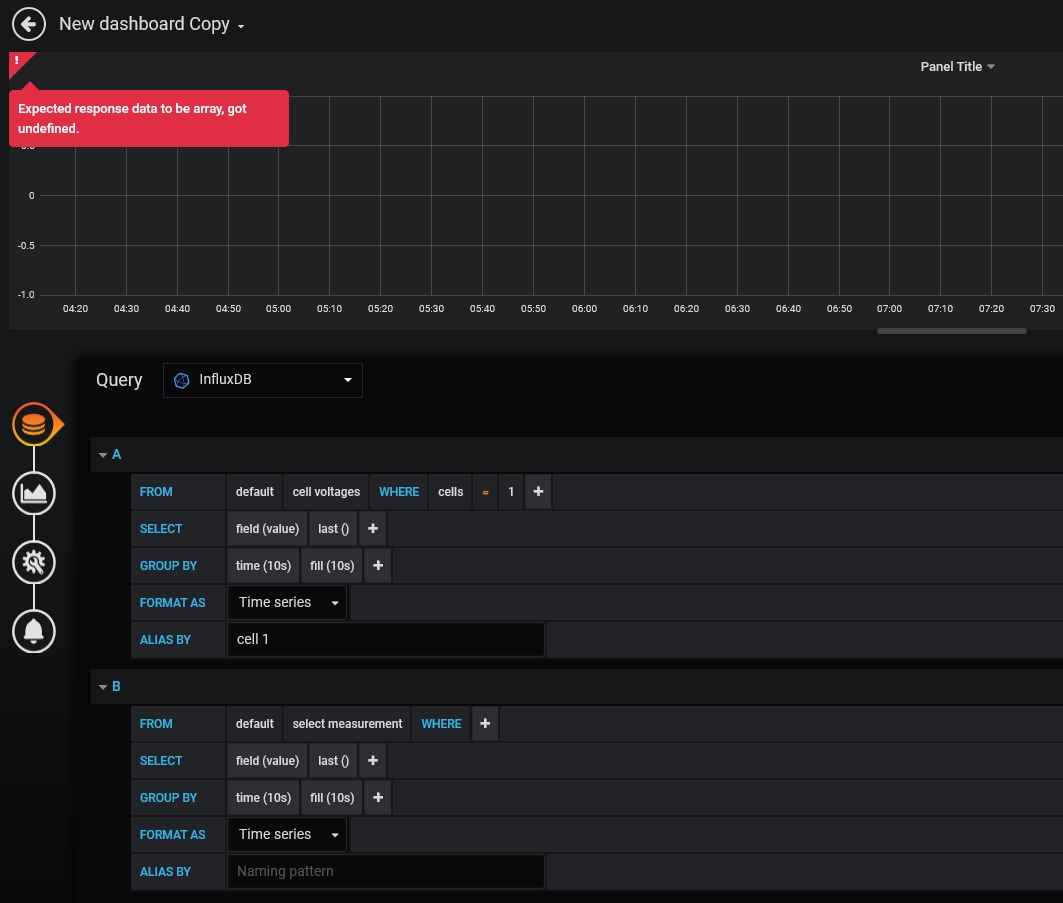
Change fill to fill(null)
I know that if I put anything in the “fill” parameter other than what’s in the dropdown list,
I get errors. (red triangle)
No go. If grafana is expecting the data to be an array, but what it’s seeing is ‘undefined’, where would that change need to happen?
Good question. Unfortunately, I don’t have the answer to that one.
One thing I do know, (according to their support forum) is that most errors are in the query.
delete query A and select a measurement for what is now query B.
After you delete A, B wll become A. (IIRC)
That didn’t help. I’m going to delete the dashboard and start fresh. It appears, after all the successes (thank you, Bill!) it’s with grafana now. I’ll mess around with the query data.
Easy enough to do. Take all the defaults, i.e. don’t add anything to any of the parameters.
Once you get ‘er workin’ then make the necessary changes.

Are there any settings I need to set (format, precision, consistency) that might fix the undefined data error?
Just checked the Grafana forum.
One solution for the error you’re getting was to replace localhost with 127.0.0.1 in the datasource definition.
So that should be http://127.0.0.1:8086
Ok, One little step at a time works for me. I went into data sources, clicked on the URL http://localhost:8086, (which was already there in shaded text; that passed the test), a drop-down appeared with the exact same info (http://localhost:8086), so I clicked on it and the URL box filled in with the data (not shaded text).
The test passed successfully, went into query and Cells was a choice in the drop-down menu.
so far, so good!
Ya, still no data but the red triangle is gone. And testing the fill(null) with fill(1m) returns the dreaded red triangle. So some progress.
That stands to reason as fill doesn’t take any parameters other than what’s in the dropdown list.
Is there anything I need to do with the panel now? It shows ‘no data’.
Again, that generally indicates no data is coming from the data source.
You mentioned sucessful results from show measurements, correct?
Yes. It shows now the number of cells I have connected

Yes, Show measurements shows name ------ Cells
And grafana is showing Cells as the dropdown choice and Cell as the dropdown choice along with the number of cells I currently have
Taking a look at my instance of Influx. Back in a few…