This is quite a large step forwards from the version of v9 that was running on emoncms.org, which I have been careful to upgrade due to need to maintain stability given the number of users posting to the site.
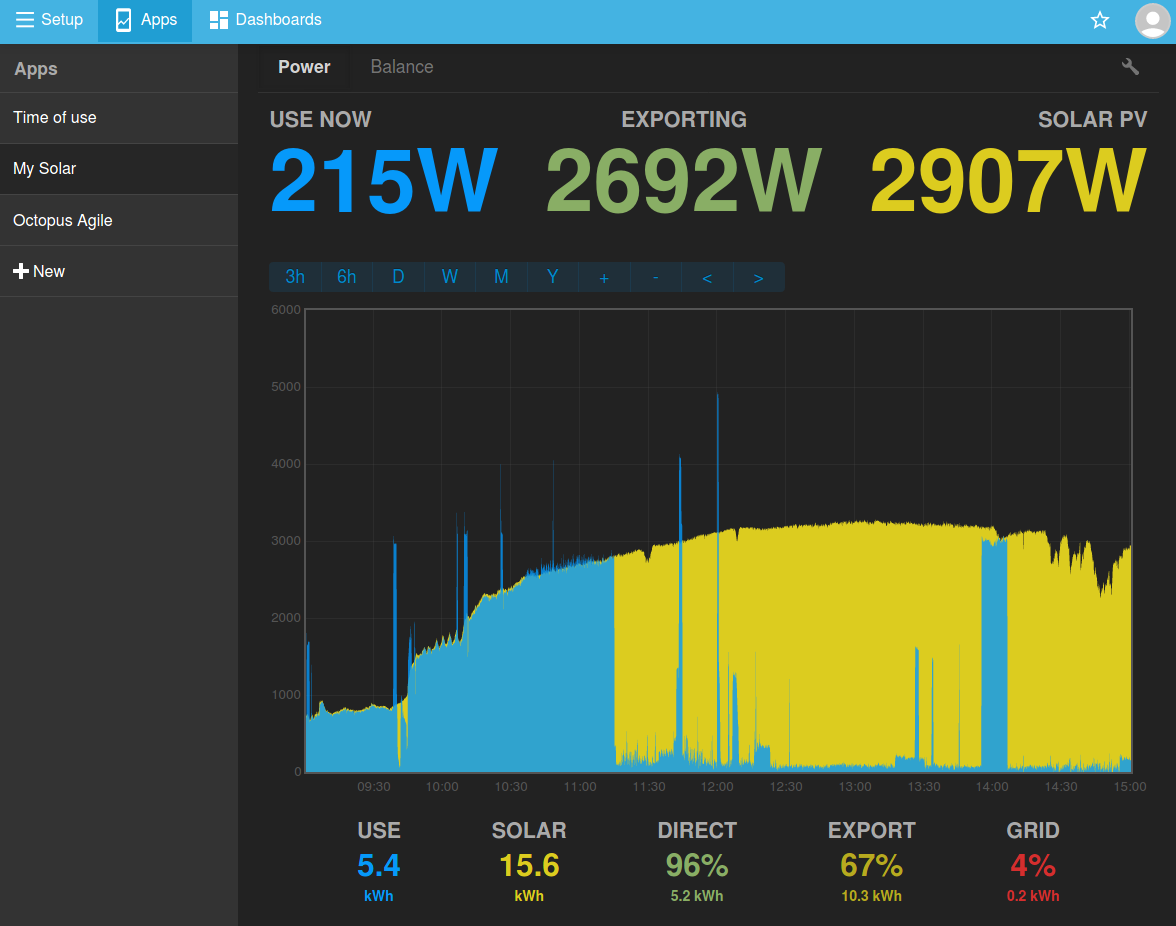
Oh no! 1h view mode has disappeared. I found this granularity to be the most usable “zoomed-in” view as well as invaluable for seeing average generation/consumption figures for the past hour. Can this view be restored please? Manually dragging a 1 hour window is not a substitute as it is difficult to be accurate and also doesn’t automatically scroll in real time. It is also impossible to perform on a mobile phone, which is my primary method of accessing Emoncms.
If it is not possible to add a “1h” button back in to the interface, is there any way of replicating its effect faithfully, e.g. a manual URL parameter or some such?
Thanks for the upgrade! I saw it this morning when I turned my device on to see the day’s status - I noted that the rendering seems to vary more across devices - MySolarPV works nicely in portrait on Android, but throws a load of errors on Landscape depending on the screen size - Error is “Invalid dimensions for plot etc” My Solar Divert has become stretched so it’s impossible to see all of the data on the screen without scrolling up
On iOS, there again seems to be some weirdness going on with both the MySolarPV and MySolarDivert apps - I can grab some screenshots later if that helps?
These are the main uses I have for displaying data so it’s a bit frustrating if that changes and the data I want to see isn’t shown or has fallen off on to the next line. Appreciate that it can probably be a challenge to check all of this in advance but if a fix is possible that would be great
Thanks @Umski I think I’ve been able to fix this, I was able to replicate on my Android phone in landscape mode and with the fix the error is no longer coming up. (Change available in the master branch for non emoncms.org users: commit)
@TrystanLea Wow - fast work - thanks - yes the error has gone now. Is it possible to get the entire view to fit the screen at all? If it helps, Android (landscape) now shows the import/export value where it used to be (second row first item), but on a desktop browser (Firefox on Windows) it seems to be now sat on the top line next to Total Use (zooming seems to make no difference) - no rush by the way!
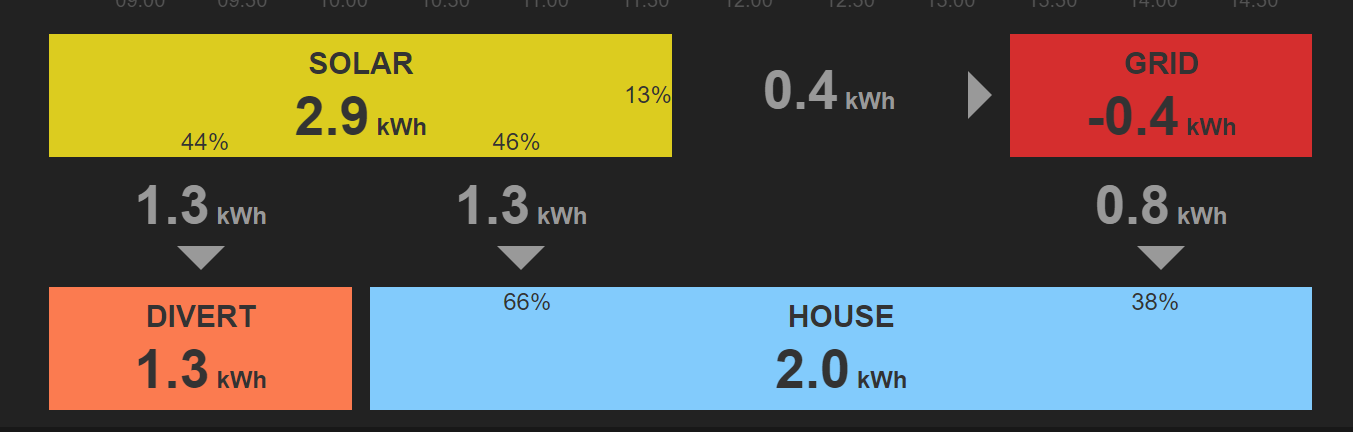
Hi, I also noticed the change this morning. I am facing issues in the My Solar Divert view. The percentage are all slightly wrong. Is it due to roundings?
@fabsoues well spotted - I didn’t see that either due to those bits being pushed below on my portrait displays :o I have similar totals - 50%+36%+15% = 101% and 100%+2% = 102%
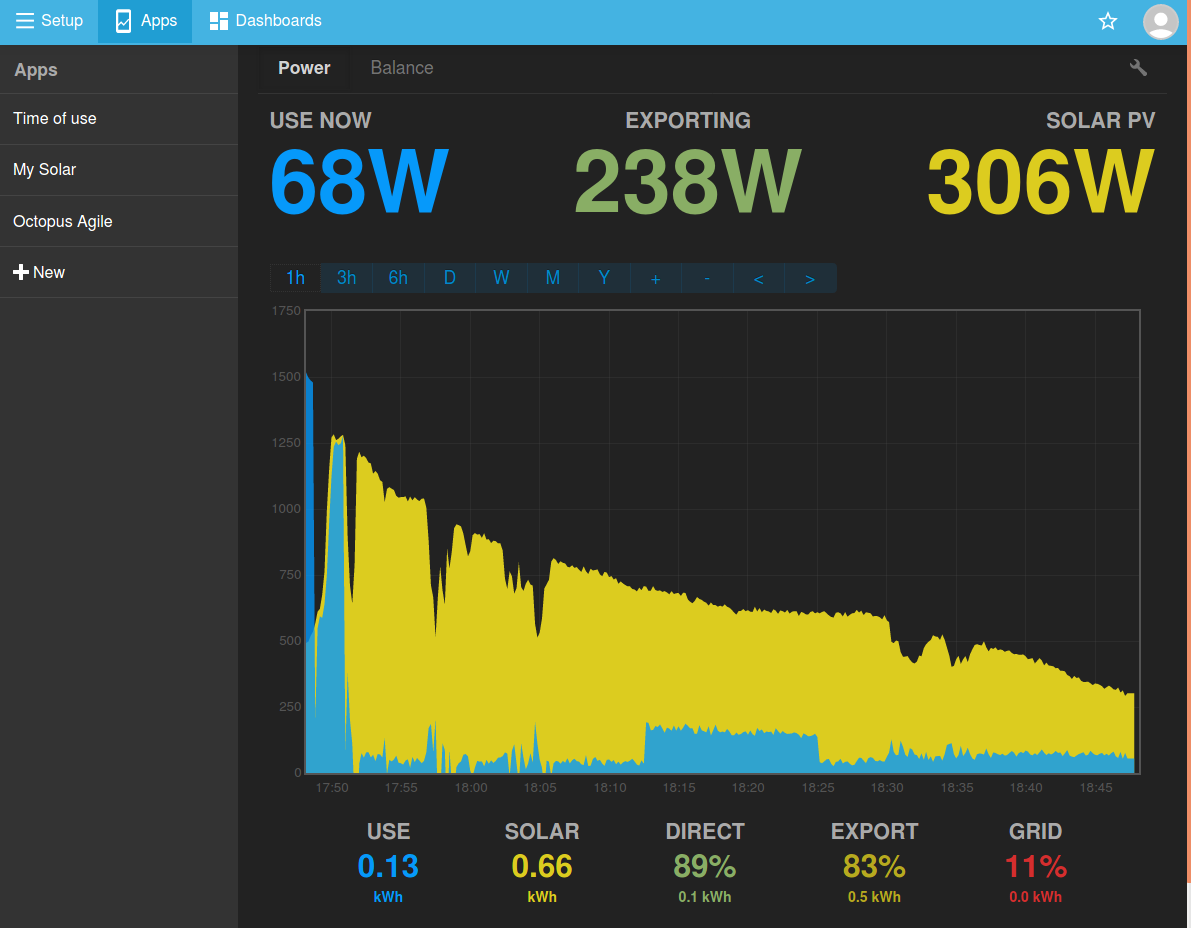
Weird, after update I can’t see 1h. Would be awesome to be able to customise time periods - e.g. 12 hour, since xAM/PM, etc. However, requests aside, great work as always!
@TrystanLea
Hi Trystan,
There appears to be a problem with saving changes to the secondary (right hand side) y axis in the graphing function. Many of my graphs have reset to auto scale the minimum right hand side y-axis. I have tried changing them to a fixed value (e.g. 0) but the graph reverts to the previous format, even after clicking save.


 (part of the day job :D)