Delayed pulses with emonPi and Optical LED Pulse Sensor

Continuing the discussion from emonTx max pulse count frequency:

I found the emonPi isn’t dropping pulses from the Optical Pulse Sensor but it seems to be delaying the post of the pulses.

So my question is:
Why does the emonPi pause (or hold its breath) for such a long time between posting pulses?

I don’t believe the emonPi is dropping pulses and the delays don’t seem to be causing an issue (not one that I have found).
 

Details:

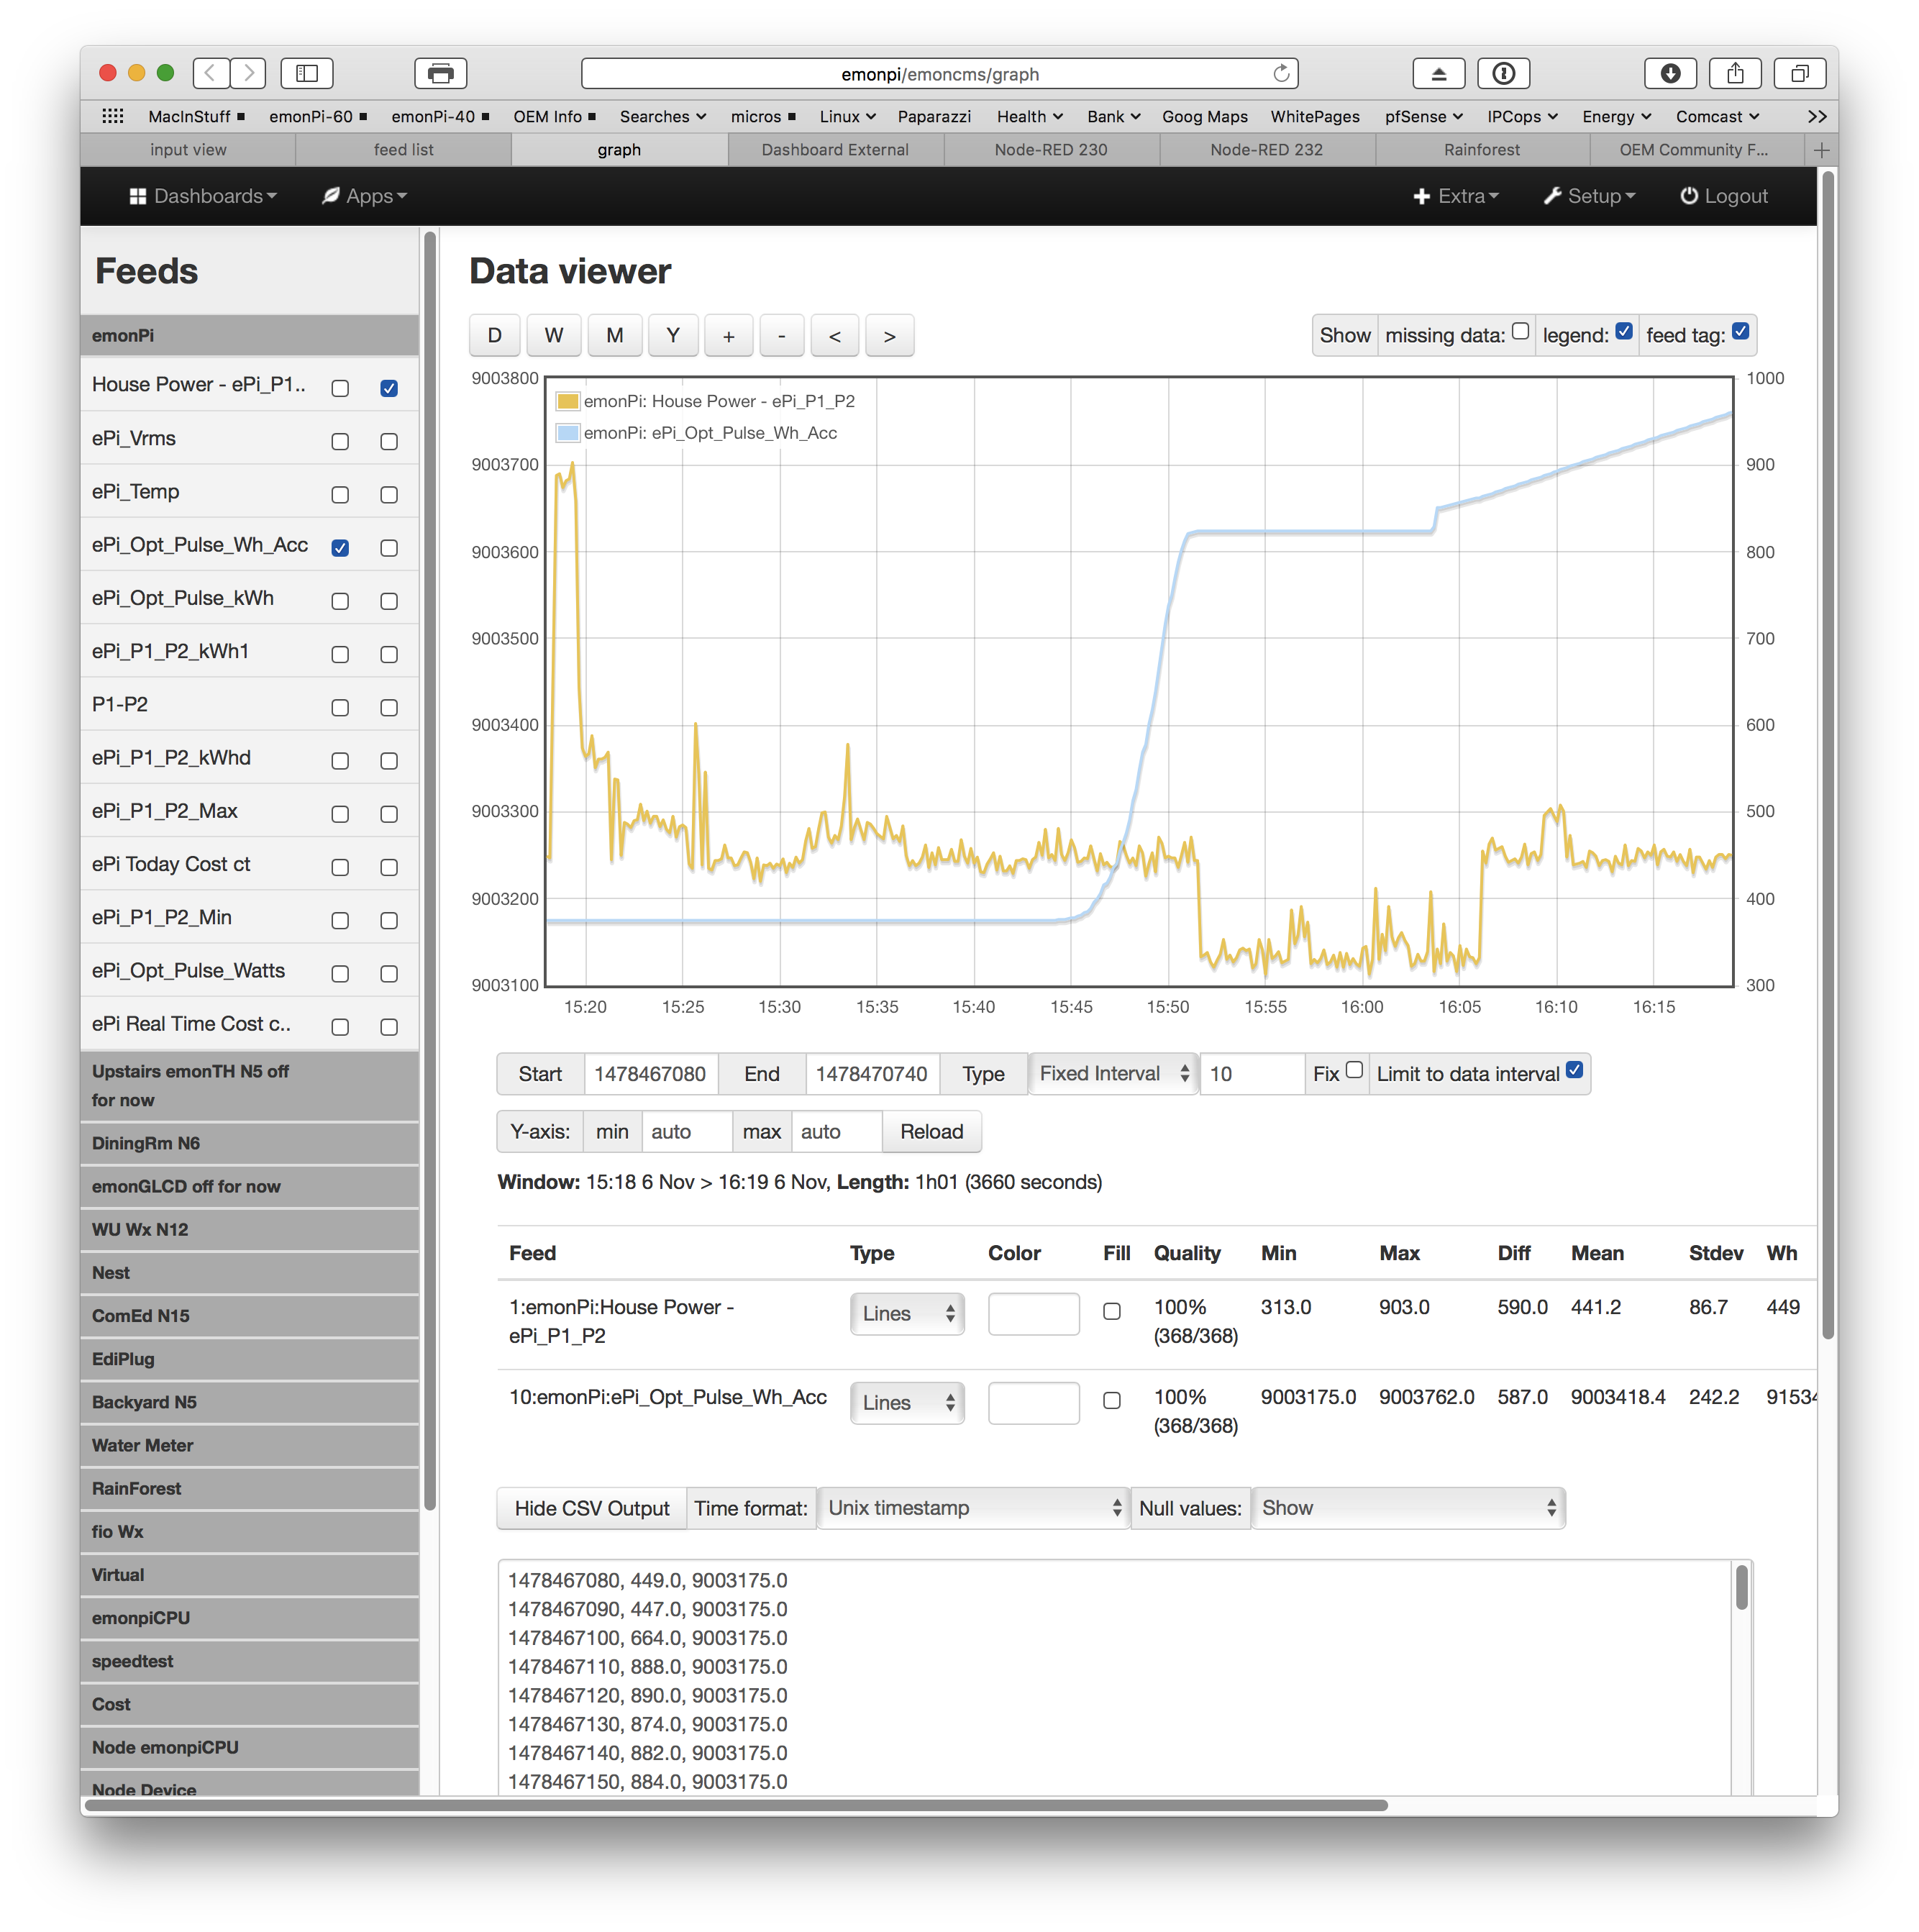
For the electricity meter, each pulse is 1 Wh. And my house usually idles near 300-400 W. So I think I should get one pulse every 10 seconds if not more.

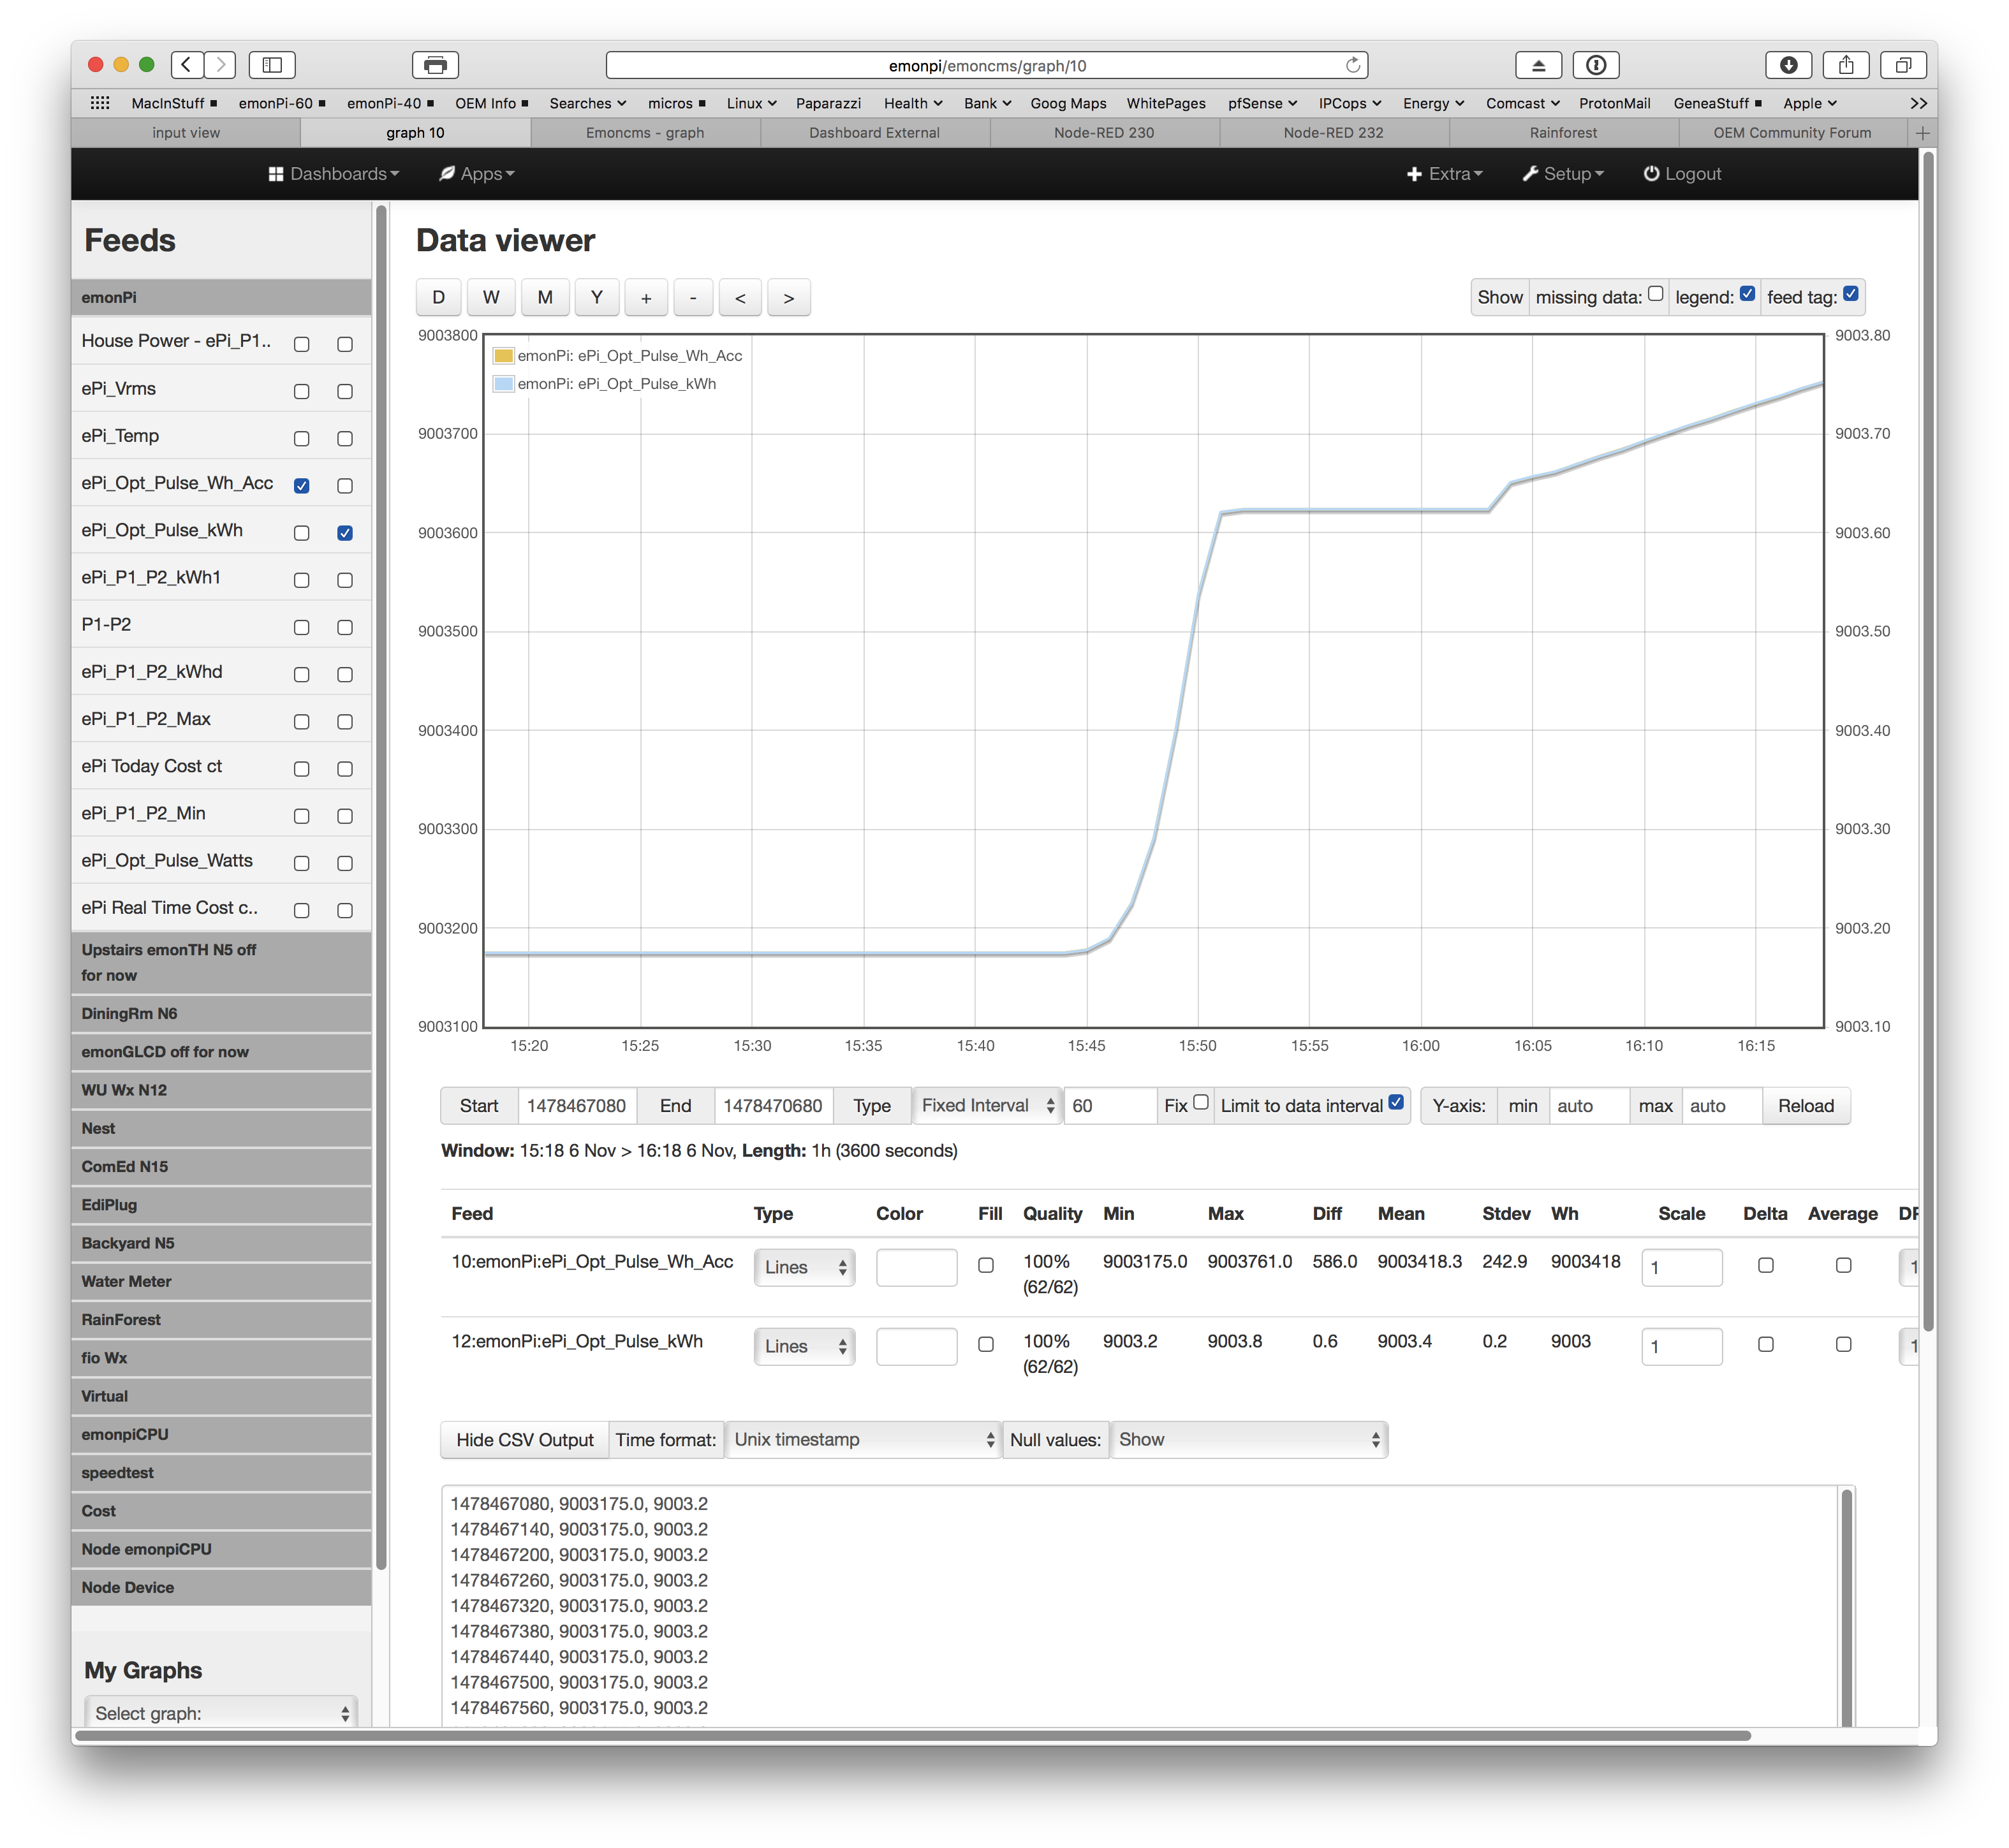
In the graph below the long horizontal lines in blue are the issue.

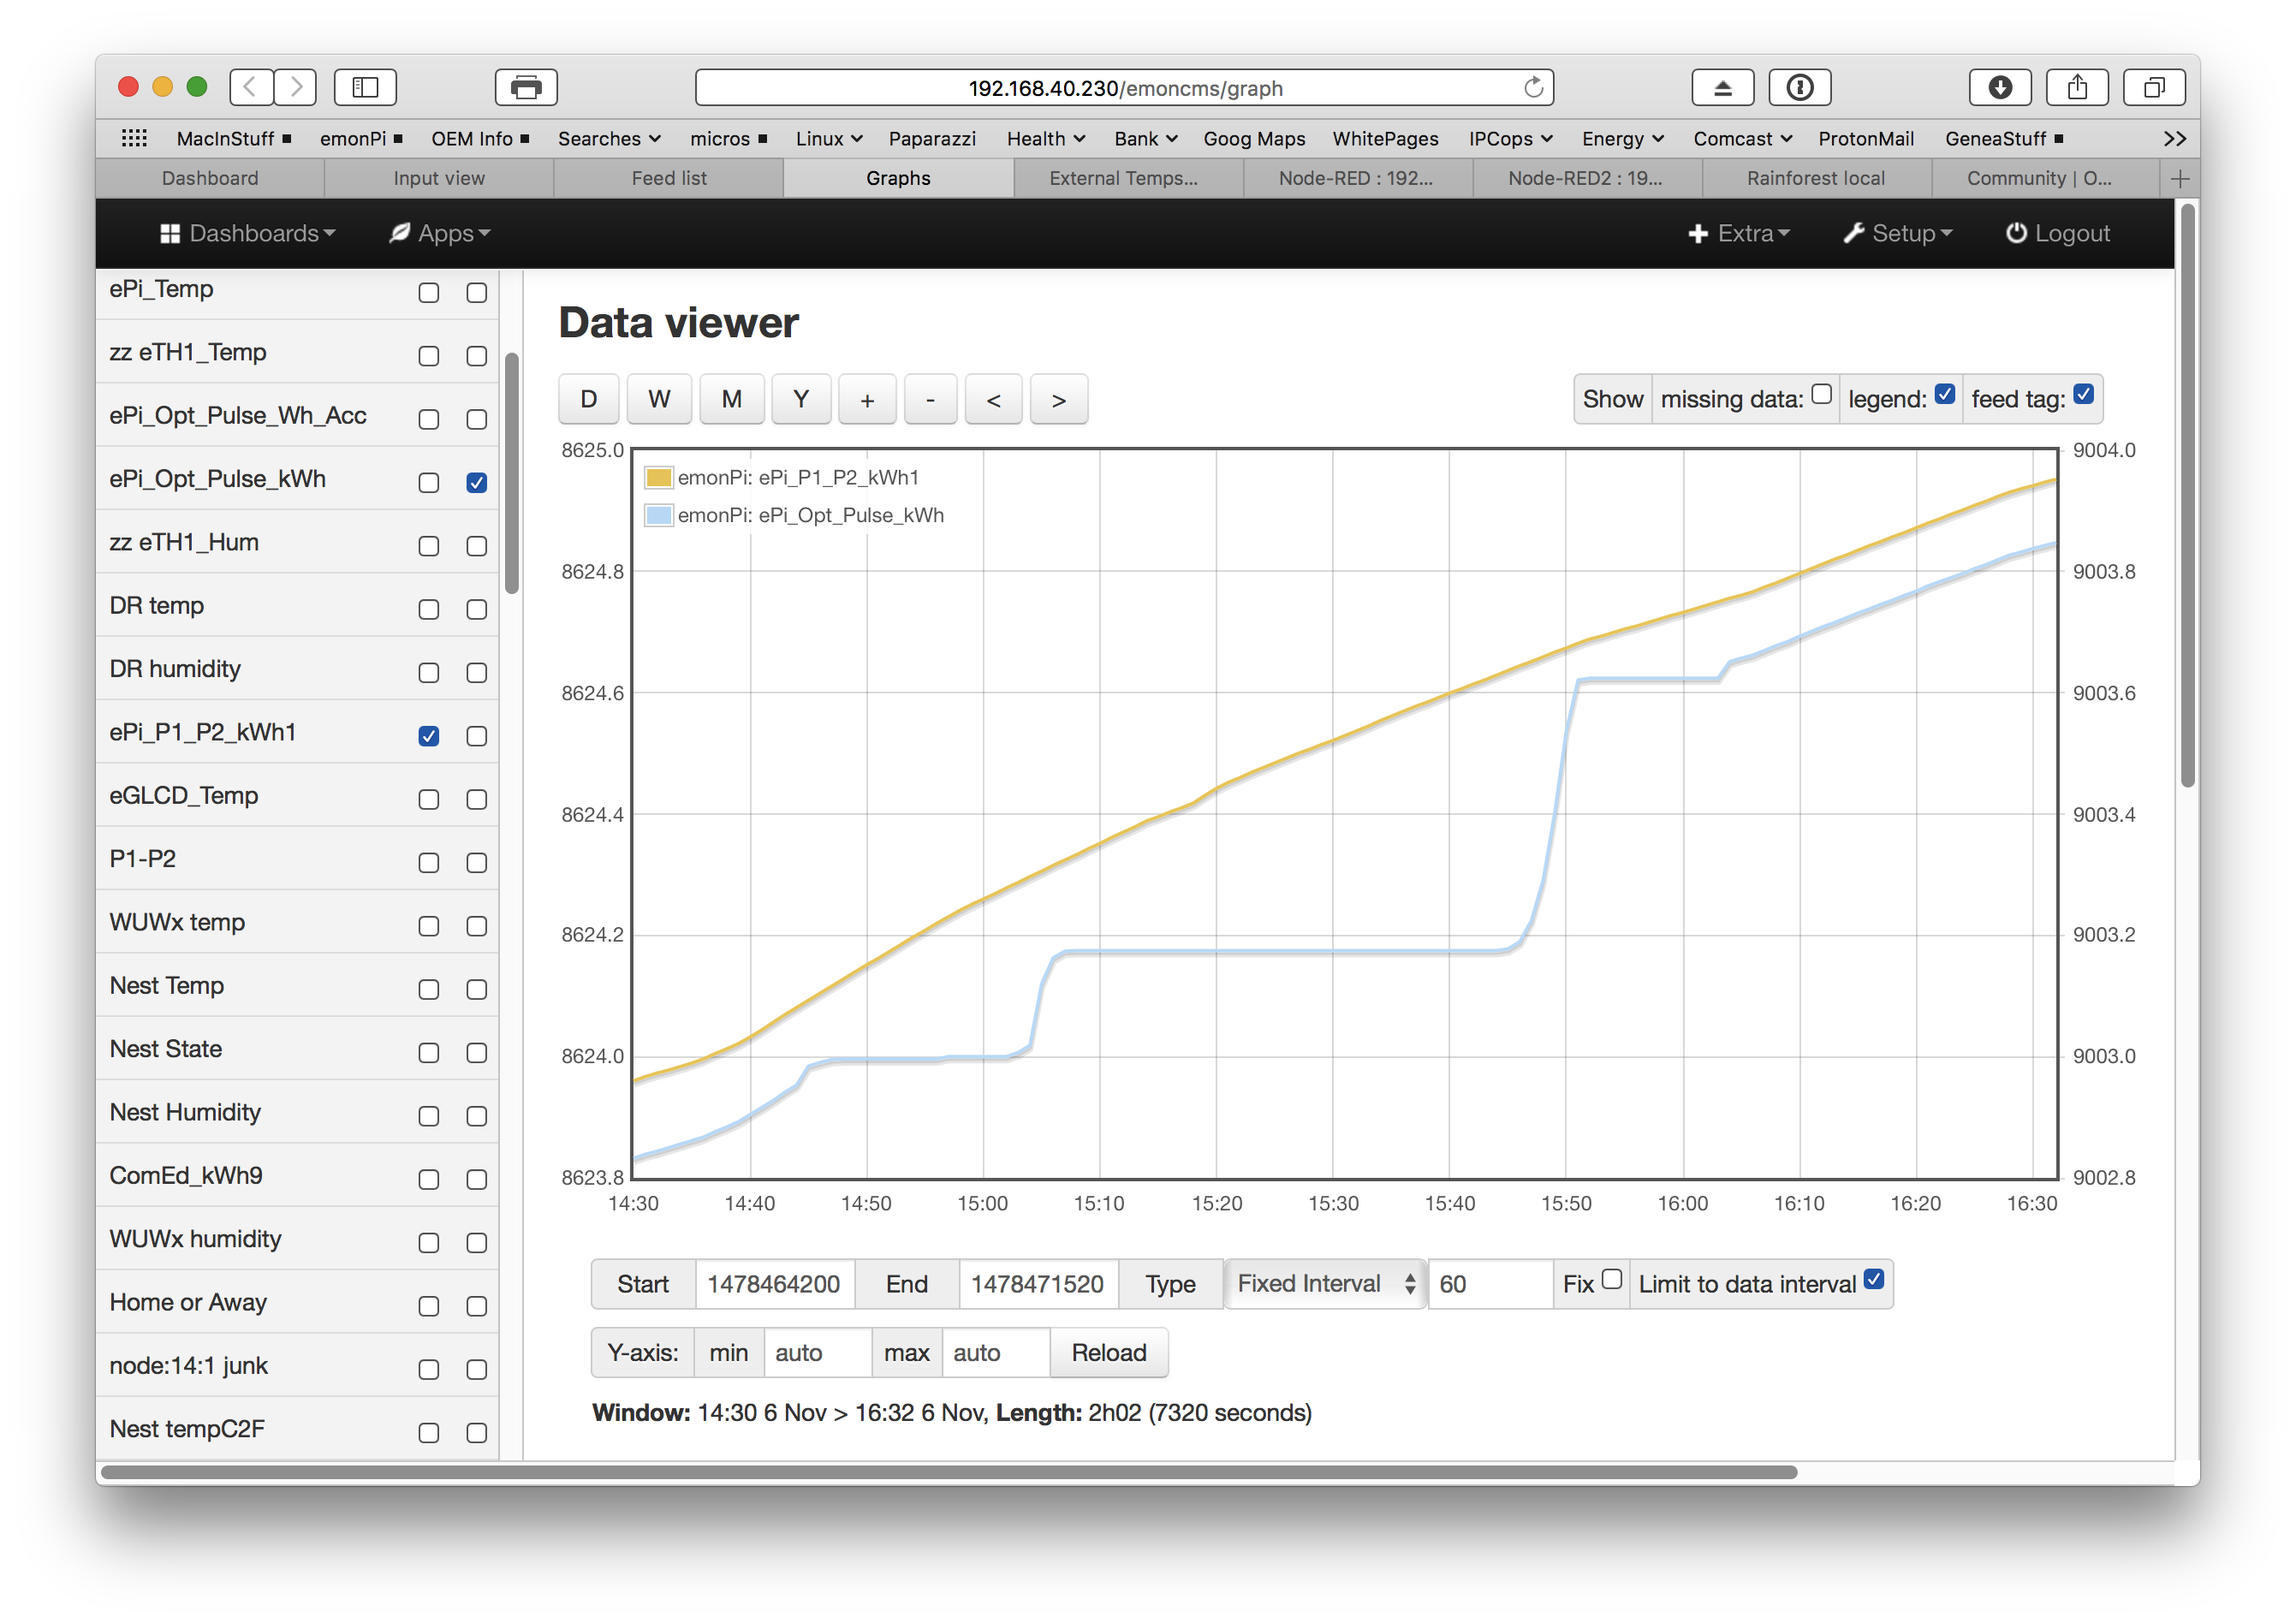
The yellow line is the CT (ePi_kWh below). The blue line is the pulse sensor (ePi_Opt_Pulse_kWh below).

timestamp   ePi_kWh   ePi_Opt_Pulse_kWh
==========  ========  ========
1478464200, 8623.960, 9002.832
1478464260, 8623.967, 9002.839
1478464320, 8623.973, 9002.844
1478464380, 8623.978, 9002.850
1478464440, 8623.983, 9002.855
1478464500, 8623.989, 9002.861
1478464560, 8623.996, 9002.867
1478464620, 8624.005, 9002.876
1478464680, 8624.013, 9002.884
1478464740, 8624.021, 9002.893
1478464800, 8624.032, 9002.904
1478464860, 8624.044, 9002.916
1478464920, 8624.057, 9002.928
1478464980, 8624.069, 9002.941
1478465040, 8624.081, 9002.953
1478465100, 8624.093, 9002.984
1478465160, 8624.104, 9002.990
1478465220, 8624.116, 9002.995
1478465280, 8624.128, 9002.996
1478465340, 8624.140, 9002.996
1478465400, 8624.151, 9002.996
1478465460, 8624.162, 9002.996
1478465520, 8624.174, 9002.996
1478465580, 8624.186, 9002.996
1478465640, 8624.197, 9002.996
1478465700, 8624.208, 9002.996
1478465760, 8624.220, 9002.996
1478465820, 8624.230, 9003.000
1478465880, 8624.241, 9003.000
1478465940, 8624.251, 9003.000
1478466000, 8624.260, 9003.000
1478466060, 8624.269, 9003.000
1478466120, 8624.278, 9003.000
1478466180, 8624.287, 9003.007
1478466240, 8624.297, 9003.019
1478466300, 8624.306, 9003.120
1478466360, 8624.315, 9003.163
1478466420, 8624.324, 9003.174

1478466480, 8624.333, 9003.175
1478466540, 8624.343, 9003.175
1478466600, 8624.352, 9003.175
1478466660, 8624.361, 9003.175
1478466720, 8624.370, 9003.175
1478466780, 8624.379, 9003.175
1478466840, 8624.389, 9003.175
1478466900, 8624.396, 9003.175
1478466960, 8624.403, 9003.175
1478467020, 8624.410, 9003.175
1478467080, 8624.418, 9003.175
1478467140, 8624.431, 9003.175
1478467200, 8624.442, 9003.175
1478467260, 8624.452, 9003.175
1478467320, 8624.460, 9003.175
1478467380, 8624.469, 9003.175
1478467440, 8624.477, 9003.175
1478467500, 8624.484, 9003.175
1478467560, 8624.492, 9003.175
1478467620, 8624.500, 9003.175
1478467680, 8624.507, 9003.175
1478467740, 8624.515, 9003.175
1478467800, 8624.521, 9003.175
1478467860, 8624.529, 9003.175
1478467920, 8624.537, 9003.175
1478467980, 8624.545, 9003.175
1478468040, 8624.554, 9003.175
1478468100, 8624.562, 9003.175
1478468160, 8624.569, 9003.175
1478468220, 8624.577, 9003.175
1478468280, 8624.584, 9003.175
1478468340, 8624.592, 9003.175
1478468400, 8624.600, 9003.175
1478468460, 8624.606, 9003.175
1478468520, 8624.614, 9003.175
1478468580, 8624.621, 9003.175
1478468640, 8624.629, 9003.175

1478468700, 8624.637, 9003.178
1478468760, 8624.645, 9003.189
1478468820, 8624.651, 9003.225
1478468880, 8624.659, 9003.291
1478468940, 8624.667, 9003.402
1478469000, 8624.674, 9003.538
1478469060, 8624.682, 9003.621
1478469120, 8624.688, 9003.624
1478469180, 8624.693, 9003.624
1478469240, 8624.699, 9003.624
1478469300, 8624.705, 9003.624
1478469360, 8624.710, 9003.624
1478469420, 8624.716, 9003.624
1478469480, 8624.722, 9003.624
1478469540, 8624.728, 9003.624
1478469600, 8624.732, 9003.624
1478469660, 8624.738, 9003.624
1478469720, 8624.744, 9003.624
1478469780, 8624.750, 9003.624
1478469840, 8624.756, 9003.651
1478469900, 8624.761, 9003.657
1478469960, 8624.767, 9003.662
1478470020, 8624.774, 9003.670
1478470080, 8624.781, 9003.678
1478470140, 8624.789, 9003.685
1478470200, 8624.797, 9003.693
1478470260, 8624.805, 9003.701
1478470320, 8624.813, 9003.709
1478470380, 8624.820, 9003.716
1478470440, 8624.827, 9003.724
1478470500, 8624.835, 9003.731
1478470560, 8624.843, 9003.738
1478470620, 8624.850, 9003.746
1478470680, 8624.857, 9003.753
1478470740, 8624.864, 9003.761
1478470800, 8624.872, 9003.768
1478470860, 8624.880, 9003.776
1478470920, 8624.887, 9003.783
1478470980, 8624.895, 9003.790
1478471040, 8624.901, 9003.797
1478471100, 8624.909, 9003.805
1478471160, 8624.916, 9003.812
1478471220, 8624.924, 9003.819
1478471280, 8624.931, 9003.827
1478471340, 8624.937, 9003.832
1478471400, 8624.941, 9003.838
1478471460, 8624.947, 9003.843
1478471520, 8624.952, 9003.848
1478471580, 8624.958, 9003.854


And I use a node-red flow to determine the duration between Opto Sensor pulses.

timestamp (Central Time)                epoch (ms)      time since last pulse (sec)
===============                         ==========      ====================
Sat Nov 05 2016 17:02:25 GMT-0500 (CDT)	1478383345060	diffTime = 1005.175
Sun Nov 06 2016 14:45:29 GMT-0600 (CST)	1478465129536	diffTime = 30.024
Sun Nov 06 2016 14:45:54 GMT-0600 (CST)	1478465154576	diffTime = 20.101
Sun Nov 06 2016 14:46:24 GMT-0600 (CST)	1478465184418	diffTime = 29.842
Sun Nov 06 2016 14:47:59 GMT-0600 (CST)	1478465279583	diffTime = 85.100
Sun Nov 06 2016 14:56:34 GMT-0600 (CST)	1478465794645	diffTime = 515.061
Sun Nov 06 2016 15:02:49 GMT-0600 (CST)	1478466169727	diffTime = 354.968
Sun Nov 06 2016 15:03:39 GMT-0600 (CST)	1478466219659	diffTime = 49.933
Sun Nov 06 2016 15:06:14 GMT-0600 (CST)	1478466374770	diffTime = 30.018
Sun Nov 06 2016 15:06:39 GMT-0600 (CST)	1478466399745	diffTime = 24.976
Sun Nov 06 2016 15:07:34 GMT-0600 (CST)	1478466454796	diffTime = 50.011

Sun Nov 06 2016 15:44:20 GMT-0600 (CST)	1478468660325	diffTime = 2205.528

Sun Nov 06 2016 15:44:50 GMT-0600 (CST)	1478468690299	diffTime = 29.976
Sun Nov 06 2016 16:03:40 GMT-0600 (CST)	1478469820598	diffTime = 730.087

@glyn.hudson - I am curious if this was fixed?? The longest delay I see these days is about 20 seconds. I’d hate to think it went away on its own :slight_smile:

@Jon are you able to provide a section of emonhub.log with the matching emoncms data as above?

Paul - Enclosed is a section of the above. It starts near 2016-11-06 15:17:04 (CST) and ends near 2016-11-06 16:17:00

2016-11-06 at 16-17-01 - emonhub.log.txt (1.4 MB)

2016-11-06 at 16-17-01 - emoncms data.txt (1.9 KB)

Hi @Jon, I have had a bit of a look and it seems the data is being transported, processed and saved faithfully, the packets recieved from the emonPi firmware in emonhub seem to correlate to the graph so I do think the issue is in the emonPi sketch or the pulse counter itself, when you get alerted to a non-incrementing pulse count, do you check the led on the optical pulse counter?

If, as you say the the pulses are being “delayed” that would suggest a “hold up” somewhere, but I would have expected to see an instant “batch” increase in pulsecount rather than the gradual increase seen when the pulsecount starts moving. I’ll take another look tomorrow and let you know if I spot anything.

Yes, I’ve watched the Opto Pulse sensor green LED blink without a pulse counter increment.
 

[quote=“pb66, post:5, topic:2139”]
but I would have expected to see an instant “batch” increase in pulsecount rather than the gradual increase seen when the pulsecount starts moving[/quote]

I re-wrote my logging code to keep track of the Count, the Increment, and the Delay. Sometimes the increase is gradual, sometimes a bunch and sometimes an instant batch. Makes no sense…
 

Date (CST)				epoch (ms)	count	inc	delay (sec)
Fri Nov 11 2016 15:06:06 GMT-0600 (CST)	1478898366222	1728	5	5.110
Fri Nov 11 2016 15:06:11 GMT-0600 (CST)	1478898371181	1736	8	4.959
Fri Nov 11 2016 15:06:16 GMT-0600 (CST)	1478898376015	1744	8	4.834
Fri Nov 11 2016 15:06:41 GMT-0600 (CST)	1478898401129	1754	10	25.110	diffTime = 25.110
Fri Nov 11 2016 15:06:46 GMT-0600 (CST)	1478898406155	1761	7	5.030
Fri Nov 11 2016 15:06:51 GMT-0600 (CST)	1478898411036	1764	3	4.881
Fri Nov 11 2016 15:07:01 GMT-0600 (CST)	1478898421155	1769	5	10.119
Fri Nov 11 2016 15:07:06 GMT-0600 (CST)	1478898426054	1773	4	4.898
Fri Nov 11 2016 15:07:16 GMT-0600 (CST)	1478898436184	1788	15	10.130
Fri Nov 11 2016 15:07:21 GMT-0600 (CST)	1478898441152	1790	2	4.968
Fri Nov 11 2016 15:07:26 GMT-0600 (CST)	1478898446144	1797	7	4.993
Fri Nov 11 2016 15:07:31 GMT-0600 (CST)	1478898451099	1798	1	4.954
Fri Nov 11 2016 15:10:01 GMT-0600 (CST)	1478898601142	1799	1	150.030	diffTime = 150.030
Fri Nov 11 2016 15:10:26 GMT-0600 (CST)	1478898626152	1802	3	25.023	diffTime = 25.023
Fri Nov 11 2016 15:10:31 GMT-0600 (CST)	1478898631165	1809	7	5.014
Fri Nov 11 2016 15:10:36 GMT-0600 (CST)	1478898636165	1810	1	5.000
Fri Nov 11 2016 15:10:41 GMT-0600 (CST)	1478898641143	1816	6	4.977
Fri Nov 11 2016 15:10:46 GMT-0600 (CST)	1478898646087	1820	4	4.944

@Jon, do you have any CT based power readings for the same period and circuit?

Looking at the increment values at each of the delays in your latest data, I now wonder if the issue is as bad as it looks, I’ve added some notes to the data, (see below, these are not conclusions, just observations for consideration)

The biggest “delay” is actually the least concern as it only returns an increment of 1 after the “quiet spell”, so it could be accurate.

What do you calculate your maximum pulse rate to be? and how does that compare to the possible rate set by the “pulse duration” in the sketch? Perhaps some of the quiet spells are high use that is pulsing too fast for the sketch and the “catch up” value on resume is the tail of that high consumption as it comes down to a readable level again???

Date (CST)                              epoch (ms)	count	inc	delay (sec)		          missing updates
Fri Nov 11 2016 15:06:06 GMT-0600 (CST)	1478898366222	1728	5	5.11		
Fri Nov 11 2016 15:06:11 GMT-0600 (CST)	1478898371181	1736	8	4.959		
Fri Nov 11 2016 15:06:16 GMT-0600 (CST)	1478898376015	1744	8	4.834
Fri Nov 11 2016 15:06:41 GMT-0600 (CST)	1478898401129	1754	10	25.11	diffTime = 25.110	4
	4 updates missing, possibly at the peak of consumption as it increased way beyond 8p/5s until it reduced close to 10p/5s, the next count is lower again too. OR  did consumption drop so low and then pick up again at the end? A lot can change in 25secs at this level.							

Fri Nov 11 2016 15:06:46 GMT-0600 (CST)	1478898406155	1761	7	5.03		
Fri Nov 11 2016 15:06:51 GMT-0600 (CST)	1478898411036	1764	3	4.881		
Fri Nov 11 2016 15:07:01 GMT-0600 (CST)	1478898421155	1769	5	10.119	  ???	                1
Fri Nov 11 2016 15:07:06 GMT-0600 (CST)	1478898426054	1773	4	4.898		
Fri Nov 11 2016 15:07:16 GMT-0600 (CST)	1478898436184	1788	15	10.13	  ???	                1
Fri Nov 11 2016 15:07:21 GMT-0600 (CST)	1478898441152	1790	2	4.968		
Fri Nov 11 2016 15:07:26 GMT-0600 (CST)	1478898446144	1797	7	4.993		
Fri Nov 11 2016 15:07:31 GMT-0600 (CST)	1478898451099	1798	1	4.954
Fri Nov 11 2016 15:10:01 GMT-0600 (CST)	1478898601142	1799	1	150.03	diffTime = 150.030	29		
	increment of 1 pulse after 150secs might suggest this was a genuine low consumption period as the previous increment was only 1 pulse for 5secs too					

Fri Nov 11 2016 15:10:26 GMT-0600 (CST)	1478898626152	1802	3	25.023	diffTime = 25.023	4	
	3 pulses over 25 deconds imediately after a long slow increment of 1 maybe the tail of the lowest consumption period with a burst of 3 pulses at the end just as the consumption increases to 7 pulses in the subsequent 5secs 	
			
Fri Nov 11 2016 15:10:31 GMT-0600 (CST)	1478898631165	1809	7	5.014		
Fri Nov 11 2016 15:10:36 GMT-0600 (CST)	1478898636165	1810	1	5		
Fri Nov 11 2016 15:10:41 GMT-0600 (CST)	1478898641143	1816	6	4.977		
Fri Nov 11 2016 15:10:46 GMT-0600 (CST)	1478898646087	1820	4	4.944		

Paul -

Yes, see files below. Keep in mind the power is averaging about 450 Watts over the one hour. See the image below.

2016-11-06 at 16-17-01 - emoncms 60 sec interval data.txt (1.8 KB)

2016-11-06 at 16-17-01 - emoncms 10 sec data.txt (10.5 KB)
 

CT Watts vs Opto Pulses:


My electricity meter is 1Wh per pulse.

During this time frame? A max pulse rate of 12 pulses per minute or 1 to 2 pulse per emonpi update.

The emonpi pulsecount value is updated every 5 seconds. So that would be 1 to 2 pulse increments per emonpi update (or per 5 seconds).

During any time frame? Summer would be the worst with Air Conditioning + appliances running at the same time. Maybe 6000 Watts for a short duration. So 100 pulses per minute or 8 to 9 pulses per emonpi update max.

I can’t figure out if this is a cockpit error (my error in calculations) or what…

At first glance those graphs do not seem to correlate.

Interesting that you say the power averages 450w for that hour as there were 571 pulses counted, which CT is grid?

Both. I’m in the US with split phase power. And no solar power (yet!)

I just pulled the power data out of the emonhub.log (using the 3rd power “power1pluspower2”) for that hour and found the average power across 3600secs was 439.8watts which is therefore 439.8Wh (0.4398 kWh) or 439 pulses if your meter pulses for each Wh. There were 571 pulses recorded across the same hour which is a 23% to 30% discrepancy.

I think you should do some tests to compare the actual meter readings. At the power levels you are working at I would expect the power factor to be pretty poor with a lot of standby and electrinic devices, perhaps the CT reading is out? or perhaps the way your meter measures or calculates the “sum accros the 2 legs” isn’t as straight forward as summing the 2 individual powers?

Paul - the emonhub.log file I sent starts at Sun Nov 06 2016 15:07:34 GMT-0600 (CST) or 1478466454796. See the red outline in the image below:

Could some of the extra pulses be carry over from that large delay?
Sun Nov 06 2016 15:44:20 GMT-0600 (CST) 1478468660325 diffTime = 2205.528


How did you do that? Did you add up all of these lines by hand:
2016-11-06 15:17:04,826 INFO RFM2Pi Publishing: emon/emonpi/power1pluspower2 529


I will do that!

The electric company installed a smart meter a few months ago and I downloaded the data from it. This is the emoncms data and it matches up (mostly) with the emonhub.log file above. The RFenergy_kWh is the smart meter and the data interval is every 5 minutes

emoncms data 4a.csv (2.0 KB)

Here are the totals for that emonhub.log duration (about 1 hour):

durat	RFenergy_kWh	ePi_P1_P2_kWh1	ePi_Opt_Pulse_kWh
3300	0.399		0.391		0.563


and here is the emoncms data for the past month:
emoncms data 7 (past month) 2.csv (10.8 KB)

duration	RFenergy_kWh	ePi_P1_P2_kWh1	ePi_Opt_Pulse_kWh
2505600		445.651		444.535		444.482

so over a longer duration it seems like my discrepancy drops to < 1%. does this seem correct?

I don’t think anything can be ruled out yet but the first 1600secs of that hour only counted 1 pulse, that would suggest the pulses are being delayed by half an hour or so, which doesn’t sound that likely.

No I dumped the data into excel from emonhub.log.

Is that an additional smart meter or is it the same meter you have your pulse counter attached to?

Do you have the raw data from the smart meter for that same period I looked at?

When you are questioning the data shown in emoncms you need to look at the source data, these prepared lists you provide just show numbers without any proof or working to verify their validity

Without verification of those numbers all I can say is “emoncms data 4a.csv” suggests the pulsecounting is over counting by 40% over that 3300secs and the CT looks pretty accurate, underreading by just 2%. But I have no idea of how those numbers came about and how faithful or typical they are.

The “emoncms data 7 (past month)2.csv” looks suspicious because the interval is all over the place, varying from 300 to 142200 secs in no particular pattern.

Yes, same meter the Opto Pulse sensor is connected to.


Dumb error on my part - I clicked this without thinking:


This is how I got started down this path - I was trying to validate what I was seeing and things didn’t make sense (like the long delays with no data).
 

Let me mull this over a bit. Even when looking at all of the data (Null values = Show) on the Graph screen things don’t look quite right. The interval is still “odd”.

Try not to use the graph page for debugging, that introduces it’s own errors. Firstly if you are using FI feeds, things get altered and then running queries via emoncms returns values nearest to the timestamp intervals derived from start time, end time and screen size and there is also a quirk that only uses the first selected feeds timestamps and not the other feeds timestamps for the CSV output.
See this post in Emoncms Graph module developments

I’ve spent a lot of time searching… could you explain how you got those feeds into emoncms? I assume you have some code in your emonpi_interrupt_pulse.ino. How did you implement the result? Is there a guide or fitting keywords i should look for?

Daniel - I think you’re looking for a more technical answer than I can supply. I’m still learning about the emon/OEM code.

I have an emonPi and I use the standard Nov 2016 image. So the Inputs and Feeds and pulse count software are all part of this build. I did not add anything extra to the emonpi_interrupt_pulse.ino code.

I am guessing you are not using the standard image. Is this correct?

The emonPi runs the emonPi firmware: emonpi/firmware at master · openenergymonitor/emonpi · GitHub

Pulse data along with CT and VRMS power readings are passed to the RasPi in JeeLabs RF packet format via tttyAMA0 GPIO serial port. EmonHub is then used to decode the data and post to MQTT and remote emoncms

MQTT input script then takes the MQTT data and posts to emoncms.

See emonPi technical overview: https://guide.openenergymonitor.org/technical/

Jon! Ah I thought ePi_opt_pulse_watts was a value calculated in the onPulse routine! Yeah, I also have the emonPi!

Glyn: Thanks! Not that I know exactly how to do all of that, but I now I know what to learn and what path to take! Great!