Emoncms Graph module developments

I have just checked this and can confirm your suspicions, it is this module that is preventing any other visualization from being configured correctly.

@TrystanLea, I have just tried adding a random selection of visualizations to a new dashboard and while the red box appears after selecting a vis’ configuring it does not allow it to display, even if saved and then “view” the vis’ appears unconfigured.

I tried removing the graphs Module and all was restored and working correctly. I then re-cloned the graphs module and lost the issue returned. Although removing or adding the module alone doesn’t change anything unless the page is refreshed so it is something that is loaded when the page gets loaded. The only noticeable difference to that page with or without the module installed is the addition of the “graph” option at the top of the visualization selection dropdown.

I previously had the graph module installed for a couple of months at least and had not noticed any problem before updating yesterday,

Thanks @Kristjan_Ulfsson & @pb66, I think I’ve managed to fix the issue, a full page refresh may be needed to download updated javascript.

I will look into adding the option to show/hide the tag :slight_smile:

Yep, that got it! thanks @TrystanLea

Much appreciated, I hope it isn’t too difficult to implement,

Sorted the toggleable legend, tag and saving of the show/hide missing data field :slight_smile: (top-right hand corner above the graph)

Fantastic! works a charm :joy:

Is it possible to add the tag to the “Feed” column of the graphs page too? eg feedid:tag:feedname rather than just feedid:feedname.

If space is an issue perhaps the histogram buttons could be smaller square buttons with “Histogram” written just once at the head of the column.

I have just spotted a misleading anomaly that you may need to take a peek at!

Using the same cpu_temp example from above

.

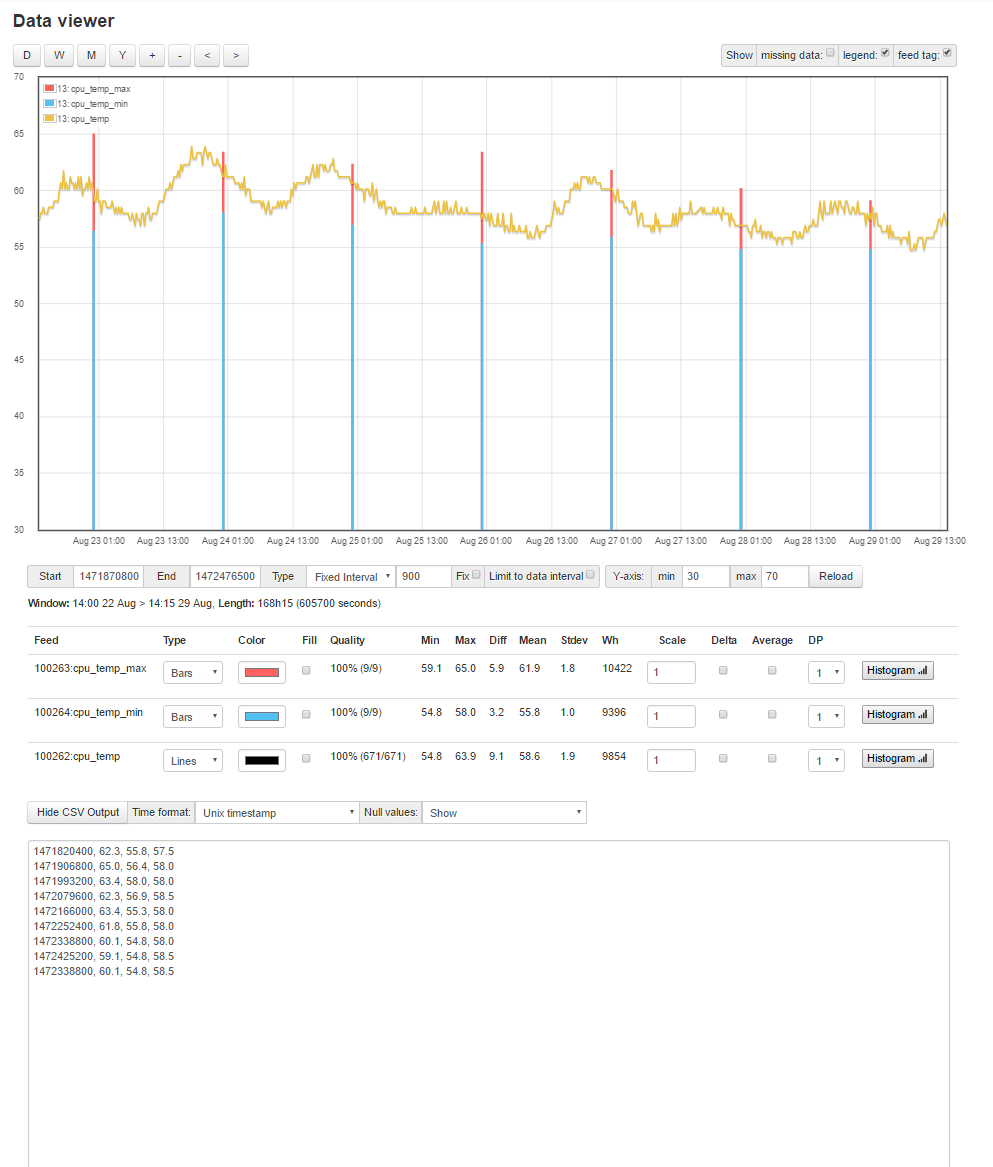
when we “Show CSV output” the 9x cpu_temp_max and 9x cpu_temp_min values are listed alongside the first 9 cpu_temp datapoints, appearing to give them timestamps spanning 2hrs not 8days.
.

EDIT - I have just noticed something that maybe of value, the number of datapoints and the timestamps seem to be driven by the first selected item on the table ie the top one, using the same example again, by deselecting the yellow cpu_temp trace in the lefthand panel and reselecting it so it effectively moves from the top to the bottom of the table, I now ONLY have the first 9 datapoints of each feed (data subset) included in the CSV output and they are 86400 secs apart.

Shall I remove the feed id in the table? Perhaps with tag:name its not needed?

IMO you should keep it on the work area, I would certainly like to be able to find the feed id, if you remove it could you provide a tooltip/hoverover? There again should it remain visible for assisting users that provide screendumps? I think keep it!

ID access is something I have been meaning to bring up in a general sense too. The old processlist edit page used to include the input ID at the head of the page, now it seems there is no way to obtain an input id without using a input/list api call or adding a “+input” to a processlist and getting the id from hovering over the shorthand processlist buttons on the input page.

And in contrast the feeds page prominently shows all feedids in the 1st column and also sorts by feedid too, so lists become very confused once you start retrospectively adding feeds at a later date. the default sort order should be based on feed name (within the tag groups) and perhaps the column display order should be Name first.

I would like to see less focus on feedids on the feeds page without losing them altogether like the inputs, and bring back the inputid in a discreet but logical location.

EDIT - Sorry slid a bit off topic there, maybe I should start a new thread about the general use of ids and their visibility (or lack of)

Also !!!

Would you consider putting the graph selector & save functions at the top of the feed list pane? the graph selector & save box is a fixed size that will be needed on most visits to the page and some users will only have short feed lists, some of us though have quite long feed lists, look at the size of the scroll bar handle for the left pane in this screendump.

Do you see the same issue when creating a multigraph?

This type of issue has been mentioned before with colour picking in some browsers and I do not recall the outcome, If it is not unique to the graphs module/page we should move this discussion another thread to keep on topic.

@TrystanLea - Sorry but I found another bug, when using the right hand axis, the legend is not right. the screenshot below is the same 3 feeds but the right boxes are selected rather than the left.

2 posts were split to a new topic: Bugs in new graph module

Looking into these bugs, thanks for testing, will hopefully update with fixes tomorrow, working through the public dashboard issue at the moment.

3 Likes

@pb66 in relation to the bug in your last post, does the legend work ok if you reselect those feeds now, after a cache refresh?

I’ve added the feedid:tag:name to the feed list. Good point about the input ids. The easiest solution would be to add another column perhaps with the id’s in a light gray colour? Or for the configure (wrench) icon to have a hover caption of the form: “Configure inputid:4502” perhaps…

No change I’m afraid!

(top tip! do not clear your browser cache whilst logged into the forum, it doesn’t cope well. I couldn’t post, and even though it looked like I was logged in it kept giving me messages like “you need to be logged in to do that” BUT I couldn’t log out either, the “logout” at the foot of the user dropdown (accessed by clicking profile pic) did nothing, it wasn’t until I got a couple of 404 pages that it finally logged me out)

DOH! hang on a sec, I did as I was told and cleared the cache but it would help if I pulled in the changes first, back in few mins !!!

Right! lets try again!

There is a change but it’s still not right.

If I freshly select a new feed with a RH checkbox it’s no different, still “undefined undefined”.

However. If I move a feed from the left to the right but just clicking the RH box of a feed that already has it’s LH box ticked, the tag and name persist. (previously it would change to “undefined undefined”)

Do the same test again but deselect the LH box before selecting the RH box and it’s “undefined undefined”.

So the code for the RH box cannot determine new values but it can retain existing data, So for now a work around is to momentarily selct the LH box before the RH box for RH scaled feeds.

Sorry about the false start, multitasking never pays off !!

EDIT - Also to add to that if you select RH first then LH the “undefined undefined” remains, it does not correct unless you deselect and reselect the LH box.

Yes at the moment the way it works is that it copies over the feed id, name and tag to the graph object when you create the graph which means that if you change the feed name the name is not updated. This saves a feed list api call for every graph load (which could be a large number of api calls on a large dashboard) but perhaps its an optimisation that will lead to more confusion than its worth…

How do the existing dash elements/widgets work? do they fetch or retain the feed names? IMO if I edit the feed name in the Feeds page I would expect it to change everywhere. Obviously graph titles and dashboard names based on feed names wouldn’t change but I think the legend should, especially with the table below parsing the feedid:tag:feedname would that then actually be giving false info?

Also, I’ve just noticed the Min and Max applied to the LH scale are being applied to the RH scale.

This pic shows my usual cpu_temp example with solar_power added to the RH scale (hence the “undefined undefined”) the PV array is currently producing well over 10kW, so the solar_power is 10,000+ but goes of the scale at 70.

The y-axis min and max applies to both axes at the moment. Il look into what I can do on the legend feed names.
The public accessibility in dashboards is also a little more complicated than I thought, as at present the saved graph object contains all saved graphs for a given user and is requested using the userid which is not stored in the parameters for the graph embedded in the dashboard… which means each saved graph will likely need its own id, in much the same way as the multigraph id to be accessible.