Perhaps I’m doing something wrong, some help would certainly be appreciated.
Since I fitted a new preinstalled sdcard I’m having an issue with Feeds that are ‘Virtual’ and have calculations. The value of these feeds is always ‘ZERO’ now. They always worked before.
Here is an example.
Here are the two source feeds I’m using.
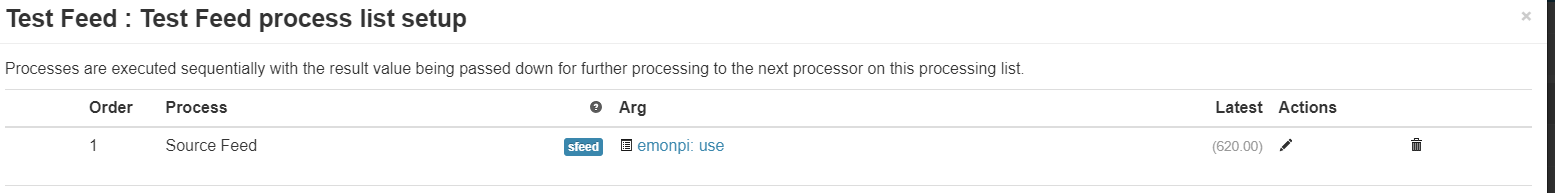
Here is the Virtual Feed.
And its result is shown as ‘ZERO’
Am I misunderstanding the use of Virtual Feeds?
Hello @Mike_Henderson this should work fine, testing here it seems to work for me with the multiplication in the same way that you have it configured.
Could you copy and paste here the system info from the emoncms admin/info page?
Server Information
-----------------------
Services
emonhub : Active Running
emoncms_mqtt : Active Running
feedwriter : Active Running - sleep 300s 1557 feed points pending write
service-runner : Active Running
emonPiLCD : Active Running
redis-server : Active Running
mosquitto : Active Running
demandshaper : Not found or not installed
Emoncms
Version : low-write 11.2.10
Git :
URL : https://github.com/emoncms/emoncms.git
Branch : * stable
Describe : 11.2.10
Components : Emoncms Core v11.2.10 | App v2.6.8 | EmonHub Config v2.1.5 | Dashboard v2.3.3 | Device v2.2.2 | Graph v2.2.3 | Network Setup v1.0.2 | WiFi v2.1.1 | Backup v2.3.2 | Postprocess v2.2.7 | Sync v2.1.4 | Usefulscripts v2.3.10 | Avrdude-rpi v1.0.1 | Emonhub v2.5.2 | EmonPi v2.9.5 | EmonScripts v1.5.14 | RFM2Pi v1.4.1
Server
CPU : 1 Threads(s) | 4 Core(s) | 1 Sockets(s) | Cortex-A53 | 89.60MIPS |
OS : Linux 5.15.76-v7+
Host : emonpi | emonpi | (192.168.1.212)
Date : 2023-01-08 11:25:01 UTC
Uptime : 11:25:01 up 2 days, 16:44, 0 users, load average: 0.28, 0.30, 0.29
Memory
RAM : Used: 19.30%
Total : 922.14 MB
Used : 178 MB
Free : 744.14 MB
Swap : Used: 76.96%
Total : 100 MB
Used : 76.96 MB
Free : 23.04 MB
Disk
: - / : Used: 40.41%
Total : 5.78 GB
Used : 2.33 GB
Free : 3.13 GB
Read Load : 1.1 KB/s
Write Load : 2.05 KB/s
Load Time : 2 days 16 hours 31 mins
/boot : Used: 19.52%
Total : 254.99 MB
Used : 49.78 MB
Free : 205.21 MB
Read Load : 0.02 B/s
Write Load : 0 B/s
Load Time : 2 days 16 hours 31 mins
/var/opt/emoncms : Used: 17.58%
Total : 9.61 GB
Used : 1.69 GB
Free : 7.43 GB
Read Load : 28.05 KB/s
Write Load : 8.54 KB/s
Load Time : 2 days 16 hours 31 mins
/var/log : Used: 16.24%
Total : 50 MB
Used : 8.12 MB
Free : 41.88 MB
Read Load : n/a
Write Load : n/a
Load Time : n/a
HTTP
Server : Apache/2.4.54 (Raspbian) HTTP/1.1 CGI/1.1 80
MySQL
Version : 10.5.15-MariaDB-0+deb11u1
Host : 127.0.0.1 (127.0.0.1)
Date : 2023-01-08 11:25:00 (UTC 00:00)
Stats : Uptime: 233138 Threads: 11 Questions: 940376 Slow queries: 0 Opens: 60 Open tables: 53 Queries per second avg: 4.033
Redis
Version :
Redis Server : 6.0.16
PHP Redis : 6.0.0-dev
Host : localhost:6379
Size : 948 keys (928.36K)
Uptime : 2 days
MQTT Server
Version : Mosquitto 2.0.11
Host : localhost:1883 (127.0.0.1)
PHP
Version : 8.1.12 (Zend Version 4.1.12)
Run user : User: www-data Group: www-data video Script Owner: pi
Modules : apache2handler calendar Core ctype curl date dom v20031129exif FFI fileinfo filter ftp gd gettext hash iconv json libxml mbstring mosquitto v0.4.0mysqli mysqlnd vmysqlnd 8.1.12openssl pcre PDO pdo_mysql Phar posix readline redis v6.0.0-devReflection session shmop SimpleXML sockets sodium SPL standard sysvmsg sysvsem sysvshm tokenizer xml xmlreader xmlwriter xsl Zend OPcache zlib
Pi
Model : Raspberry Pi 3 Model B+ Rev 1.3 - 1GB (Sony UK)
Serial num. : 76AB6BF1
CPU Temperature : 48.31°C
GPU Temperature : N/A (to show GPU temp execute this command from the console "sudo usermod -G video www-data" )
emonpiRelease : emonSD-10Nov22
File-system : read-write
Client Information
-----------------------
HTTP
Browser : Mozilla/5.0 (Windows NT 10.0; Win64; x64) AppleWebKit/537.36 (KHTML, like Gecko) Chrome/108.0.0.0 Safari/537.36
Language : en-GB,en-US;q=0.9,en;q=0.8
Window
Size : 1657 x 793
Screen
Resolution : 1920 x 1080
Thanks, all looks fine, when you look at the graph for that vitual feed is it also zero? What about a virtual feed with source feed only? What are the feed intervals? and what happens if you enable averaging on the graph page? I wonder if it’s null values in the feeds tripping it up…
Ok, I’ve made up this test feed.
The source feed has a feed interval of 10 seconds.
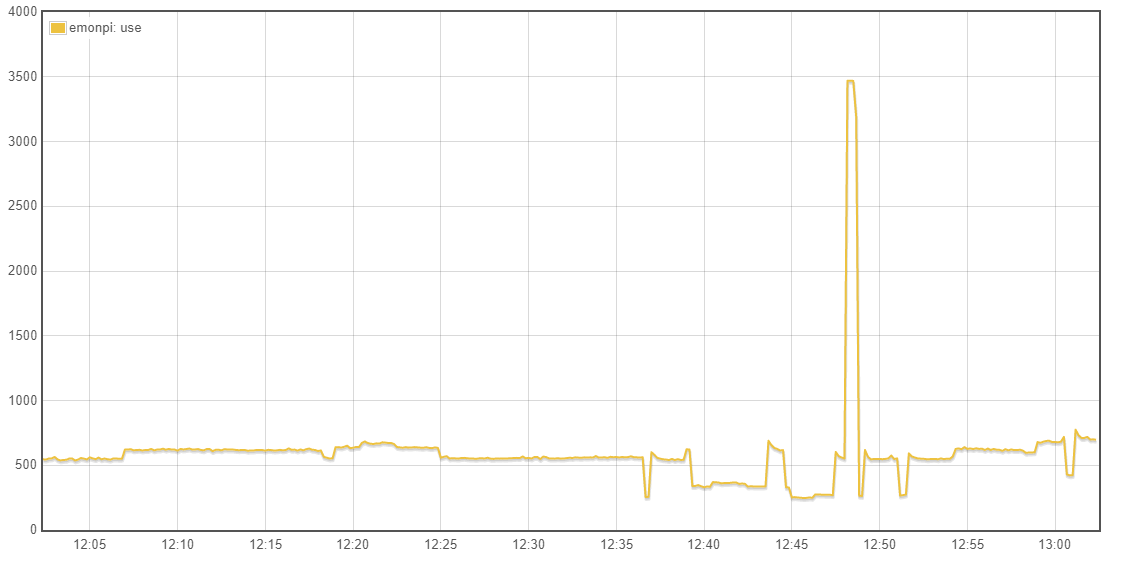
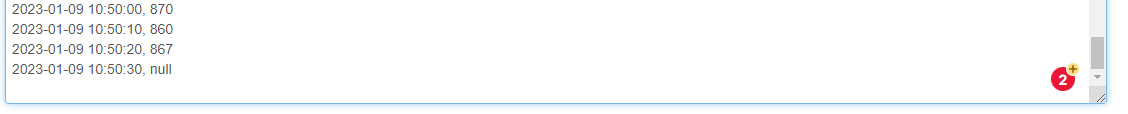
I have just noticed when I graph the source feed that the last value is always ‘null’
This’ll be why when I try to place a value from the virtual feed on a dashboard it will show zero as it’s trying to use the last saved value, but my graphs of the virtual feed continue to show data.
I notice that when I check the CSV data of the trend, the last ‘NULL’ value is from a timestamp ahead of the clock.
Looks like I was testing above with an older version. Testing on the latest I was able to replicate and have now fixed the issue and pushed up the update. Version is now 11.2.11 available in both master and stable.
Cheers
borpin
10 January 2023 08:55
10
@TrystanLea , could you close issues on GitHub with a link to the fix commit/release when you fix things, please
If I had more hours in the day yes! I’ve closed @greentangerine issue, thanks Nick!
G0LGS
10 January 2023 16:52
12
Seems to be Ok for me too.
rkirk
10 February 2023 19:31
13
This appears to still be an issue. I’m using Version
G0LGS
10 February 2023 19:51
14
Still working here with V11.3.0
However I did notice another I use elsewhare had stopped working a couple of days ago - I will try to check that again next week.
rkirk
10 February 2023 20:26
15
I can draw a graph and see the values, however I only see “0” in other widgets, such as a “dial” in a dashboard.
rkirk
10 February 2023 20:29
16
I am experiencing the same issue; “0” is displayed in single value widgets, such as a “dial”.
rkirk
10 February 2023 20:30
17
I guess that the code should display the value [n-1], since value [n] is null ?
CF87
10 February 2023 20:37
18
Virtual feeds are working fine on my local dashboard, but I have the same issue as you describe using emoncms online dashboard.
Virtual feeds show as ‘0’, but any graphs with virtual feeds in them display fine - although it is evident that the latest value on the graph for the virtual feed is zero.
Hope that makes sense.
rkirk
10 February 2023 22:02
19
My local dashboard works correctly also. It would appear as though there is an issue with the Emoncms.org dashboard.
rkirk
13 February 2023 10:47
20
Is there a resolution to this issue? Thank you.