An app to review heat pump experiments

Hi @TrystanLea,

cc @johncantor @Adminde

As you’ve probably noticed I’ve been busy with Emoncms in the last few days.

I should start off by saying that I love how open you are all being with the work you are doing. It makes it really easy to see the great things you are doing. I like what you’ve done with “My Heatpump” - it certainly shows the information many people want to see.

I’m in a more advanced situation. I have a heat pump from a popular manufacturer and the Metering and Monitoring Service Package installed which, when hooked up to their website, gives me lots of data about how it’s performing as well as the ability to control it. I know this doesn’t really fit with the ethos of OpenEnergyMonitor because it’s using vendor-supplied hardware and systems which are closed-source.

Given that setup and my programming experience I’ve been investigating how the heat pump behaves and how I can improve it. For example, the installers (nice people) suggested we’d see a CoP of around 2.5. Since I implemented my improved control technologies it’s gone up from 2.66 (October) to 3.11 (December) and then with further tweaks up to 3.27 (February).

The key for me has been the ability to look at the data in lots of different ways. I have readings for every minute since October and my home-grown web app (Javascript) has helped me see things and improve control algorithms (Python).

However, I’m now looking to share my algorithms. I finally got legal approval from people who care so the next thing was to find a way to share them.

I’ve re-implemented my home-grown web-app as an app in Emoncms. It’s pretty much functional now. Of course there are things I still haven’t re-implemented so far, but the core is functional and potentially useful to people performing experiments and wanting to dive in and out of the data.

Arguably people could do that with graphs. I did myself, but I’ve found the app format helpful because it does a lot of the legwork for me. Of course it’s not as flexible as graphing, but that doesn’t bother me because I just re-write bits of the app I need.

So now I have a decision to make and I’m hoping you can tell me your opinion.

Would a more advanced heatpump app have a place in Emoncms and it’s repos?

Of course it’s very hard for you to tell, so I’ll post some screenshots in the next few messages on this topic.

I’ve included @Adminde because I was able to use his “device” engine quite effectively to set up the feeds and the calculations. Of course @johncantor knows a lot about the heat pump and your monitoring hardware side and may have something to say.

I may share the actual content soon, but I’ll give you a summary of the technical details in a following message. There isn’t anything particularly exciting except that we get the source data from an unusual source.

It’s going to take considerable work on my part to follow it through, but I can find the time and energy if it’s worthwhile. I’ve already taken this week off work to build it out.

Thanks

David Bowen
1 Like

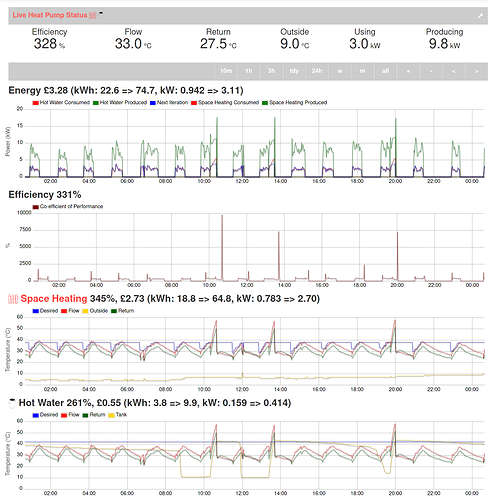
We can see two sections, the “current status” and the “review” areas. I’ve got them combined because sometimes I watch the experiments playing out in realtime and alter the algorithm as it’s running.

The “current status” section is pretty much what you’d expect, it just refreshes with the latest values from the selected feeds every so often.

The “review” section is where I do most of the interesting stuff. Notably I spend a lot of my time asking “what happened during a particular time window?” This is because my experiments overlap and intersect and so there isn’t really a sensible way to say “show how this experiment played out”. I often want to look at the fine details of an experiment’s behaviour so being able to zoom in and out is great.

The header sections above each graph show interesting stats for the selected time window (e.g. 24 hours). As you’ll see in the next few screenshots, that helps me quickly gauge the energy consumed and delivered.

There are many graphs rather than one. If all the data was on a single graph it gets too noisy to see the information. The graphs are horizontally aligned and show the same time window so I can visually compare events and behaviours.

I’ve separated hot water and space heating because their individual behaviours are very important to my control algorithms.

Of course there are plenty of improvements to make. For example, the instantaneous CoP is clearly nonsense - my homegrown app smooths it out.

1 Like

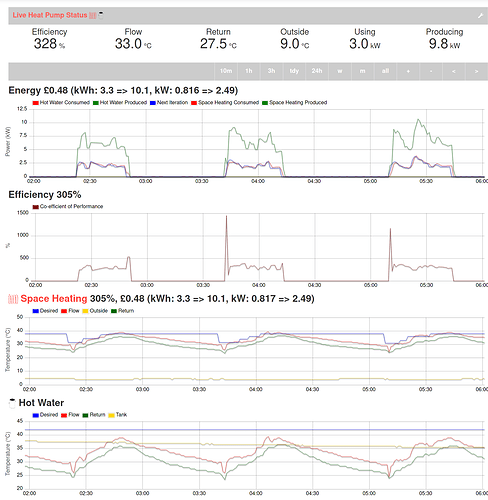
So here is me reviewing last night. The heat pump doesn’t usually run then, but I was working building the app all night so used the heat pump to keep myself warm.

I zoomed in on the 24 hour graph to see 4 hours from 02:00 to 06:00.

As we can see, the heat pump came on for space heating three times. The desired flow temperature (controlled by my algorithms) went from about 30 to 40 degrees. My algorithms also decided when to turn the heat pump on and off - my home-grown app uses “dygraph” which made it easy to show that with “annotations” on the graph.

We can see it was about 5 degrees outside and the efficiency was only 305% over those four hours.

1 Like

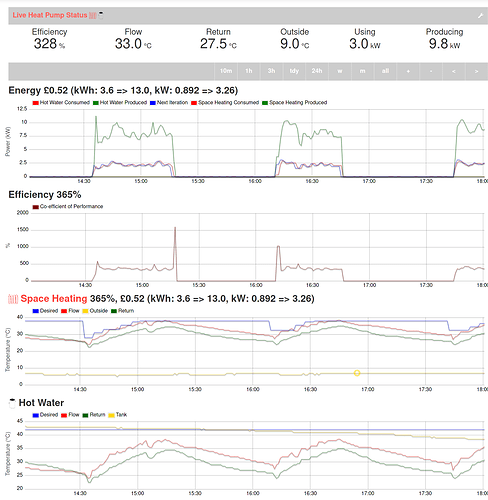
Here’s me reviewing the four hours in the daytime from 14:00 to 16:00.

We can see that it’s about 7 degrees outside and the efficiency has improved from 305% to 365%.

The heat pump vendor gives lots of CoP figures and I’ve interpolated them for every combination of flow and outdoor temperature. I include that as a series on the graph in my home-grown app but haven’t implemented that in Emoncms yet.

If we take a flow temp of 40 °C (I have over-sized radiators) then the CoPs are:

Overnight (5°C): achieved 3.05 versus vendor suggested 3.43

Daytime (7°C): achieved 3.65 versus vendor suggested 3.81

Part of the reason for this good performance is the control algorithms I’m using to drive the heat pump. Of course I know the details of those and I can see them playing out in the graphs.

1 Like

So now on to the technical parts.

Gathering Data

Use the vendor’s “API” to get readings every minute.

Store them on disk (yes, very old-fashioned).

Push them to Emoncms using “/input/post”

Arguably the thing hoovering up the readings could just post them to Emoncms or perhaps a scheduled job in Emoncms could hoover them in. I don’t know if the vendor would be happy with me exposing that capability.

Setting up the Feeds

The most critical thing we need to do is accumulate Wh so we have to have all the inputs setup to do that. I’ve used the “device” module to create a comprehensive set of inputs, processes and feeds. It’s well beyond the six heatpump_* feeds in “My Heatpump” because it’s trying to do so much more of course. I do also generate the feeds that “My Heatpump” uses as a courtesy.

Emoncms Application

I’ve spent quite a few days learning how you do things and building stuff that tries to follow your conventions whilst I re-implement all my logic.

I’ve got a sensible-sized PHP file that looks much like the other apps you already have.

I’ve extracted out the CSS and Javascript out to other files to help keep my brain straight (and to take advantage of formatting tools!)

I did bump out the app configuration to a JSON file and extended the source with a “displayOptions” section just as a place to house meta data for graphing. Here’s an example (notably not using the heatpump_ prefix):

"HeatingEnergyConsumedRate1": {
    "displayOptions": {
        "label": "Space Heating Consumed",
        "color": "red",
        "precision": 2,
        "scale": 0.001,
        "scaledUnit": "kW"
    },
    "type": "feed",
    "autoname": "HeatingEnergyConsumedRate1",
    "engine": 5,
    "optional": true,
    "description": "The power consumed by the heat pump for space heating in watts (W)"
},

One of the sections in the PHP might look like the following block. The Javascript uses it to feed the nominated data series from the Emoncms API into flot. It strangely ended up working a bit like the way dashboards work - I wish I’d looked at the dashboard code before I wrote all my code!

<div>
  <div class="placeholder_bound">
    <div data-label="Temperature" data-config-keys="FlowTemperature,ReturnTemperature,OutdoorTemperature,TargetHCTemperatureZone1" class="chart"></div>
   </div>
</div>

I could go on, but I’m sure you get the gist of what it’s doing.

David Bowen

1 Like

Of course I’m fine with this being included or not with Emoncms. It’s really about what you would like to see happen Trystan.

1 Like

A question for @TrystanLea and @glyn.hudson. Seems like it to me.

Looks very interesting. If I ever get the chance to build another house it will definitely be powerd by a HP.

On a general level, what can you do to improve the COP?

Being able to control flow temperatures are an interesting thing, not just for HPs. Is this something built into the HP or something you have to control the temp to the HP?

I’d be interested in your method for the controlling algorithms. My UFH currently has a fixed flow temp. I’d love to be able to change that depending on outside temperature. AT the moment I have a very crude method of trying to prevent it overshooting and being warm enough by a specified time. SO far I have not found anything that is more sophisticated.

Hello david. Its interesting to hear about your work. I would be interested to know how you got your cop improvements. One really hard question to answer is that relating to intermittent/continuous heating. I have tried to get a better grip on the topic, but find that hard… when gauging ‘comfort’ rather than air temperature, it all gets more anecdotal. Anyhow, i feel that a lot of people are not aware that efficiency with HPs is so variable and that improvements are possible.

john cantor
01654 700115. 07894 431317

1 Like

Thanks for your comments Brian and John.

I’m building up to answering your questions by sharing my existing experiments but I’m also trying to build a platform for future experiments by myself and others, hence this question to Trystan. If it doesn’t become part of Emoncms, I’ll share it another way.

Somewhat teasingly, I do actually have hard data and algorithm implementations what will answer all your questions comprehensively.

Hi,

Looking at the graphs, you seem to have some single data points for COP that are way out of range, hence the graph is basically flat, hiding the detail. These are surely anomalies and are maybe artefacts of the way the data is stored and processed? They only seem to occur when the pump is turning on or off. Would it be possible to remove these from the data, either as they are being stored (with some log warning) or before the data is displayed. That way, you’d be able to see much more detail from the COP graph.

Also, it looks as though you circulate your hot water, it gradually loses heat between operations of the HP. This seems to be a standard method for new builds with HPs. We are about to commission a new build and we’ve designed things so that all the bathrooms are close to the plant room, minimising any hot water runs. The kitchen sink is the only place hot water would be used that is some way from the plant room and we intend to put in a Quooker (instantaneous boiling/hot water) on the premise that with Solar PV and a battery system, this should be more cost effective than circulating the hot water to all points where it is needed with the inherent heat losses.

Not sure if anyone has experience of this with HP systems?

Having said all that, this looks like a great addition to the Open Energy arsenal. Thanks for posting.

Simon

1 Like

Thanks for your comments Simon.

single data points for COP that are way out of range

It does look that way, but they are correct - the amount of useful heat generated can sometimes be way higher than you’d expect. It’s a feature of the way I’m controlling the heat pump and helps me get a good average CoP. Of course it doesn’t help with the graphing which is why on my home-grown web-app I smooth it over five minutes. I haven’t done that in Emoncms yet.

it looks as though you circulate your hot water

Actually, one of the features of my new control algorithm is to not circulate the water because it wastes 200W driving the pump and sending heat outside. I actually turn everything off and let the radiators slowly emit the heat they’ve built up. After something like an hour I start everything back up. My control algorithm is working out when it’s a good time to do that. Notably I recently enhanced it to work out the “effective” outdoor temperature rather the actual one which is why Emoncms is interesting because I’ll be able to implement that more flexibly by consuming feeds for the weather station data rather than hard-coding the lookup that I have at the moment.

Your comment about the kitchen sink temp are quite valid. We’re having to wait a little longer for hot water to come through since we stopped using oil (temp=70C). However, our un-lagged DHW piping is helping to heat the house so I don’t mind those losses. In the Summer it will be pure waste, but by then we’ll have excess solar PV so it won’t bother me much.

1 Like

I suggest the sensors are close to the tank so the figure you are seeing ‘at rest’ is the temp of the tank - this is what I see on my boiler flow/return sensors. Mine are also a few degrees out - I’ll plumb in proper sensor pockets next time :grin:

I’ll open some more topics to chat about what’s actually happening with the heat pump.

I’m not ignoring you all but I’d like to keep this topic to be about adding the new app rather than what I’ve been doing with the heat pump.

Hope you don’t mind.

1 Like

Good point, I have the same on my heat bank - should have thought of that one! :expressionless:

1 Like

I’ll bite on this topic. Too juicy not to :grin:

I am impressed with the level of experimentation and monitoring that David has carried out so far. I personally don’t think enough work is carried out exploring heat pump control strategies but I know the reasons why though.

  1. Most people only care about heating if it’s not working, or if it’s costing them a fortune to run.
  2. Manufacturers’ want their ASHP box of tricks that performs as reliably as possible for as many types of installation as possible. It might not be the most efficient strategy they use, but it is often the most reliable.

With that in mind, and based on my day job as a tech support guy for a heating manufacturer, I’ll throw in my 5p worth :smiley: (All opinions my own). Whilst this may come across as negative, it is not meant to be. I just want to remind anyone wanting to experiment, to bear some important things in mind.

Now I did speak to @TrystanLea about this last year at the Fully Charged show where OEM had a stall. He mentioned how good it would be to be able to adjust the compressor running frequency / speed based on available excess solar PV energy, or to have an influence over the defrost cycle of an ASHP.

Whilst that would be great to be able to do this as an experimenter, no manufacturer would be happy doing this from a warranty point of view. Priority 1 of the software on a heat pump is to look after the heat pump. Priority 2 is to provide heat to the customer!

Every manufacturer has a different strategy around defrost cycles - it is their “secret sauce”, whether it be a time calculation around the time it took to complete the previous defrost, or based on ambient temp, evaporator temp and suction pressure or perhaps around CoP.

One thing for sure with a reverse cycle Air to Water heat pump, is that when the heat pump needs to do a defrost, it needs 2 things. Good water flow rates & sufficient thermal energy from the heating circuit & buffer tank. A lack of flow or insufficient thermal energy during a defrost cycle can cause water freezing & crystalisation in the condenser. Freezing water expands, potentially splitting the plate heat exchanger condenser. The software built into the machine will do everything it can to prevent this from happening. That might be faulting out with an error code if needed, or switching on a flow boiler / buffer tank immersion element to assist the defrost. Just be mindful of this if you are controlling a circulation pump controlling flow through the heat pump with your own on/off durations and pump speed. If the heat pump was expecting to control that pump, but in reality you are, it could cause trouble. A split condenser = a water filled refrigerant system. Not fun is an understatement!

Now I can see David has been experimenting by switching the heat pump demand on/off and slowly ramping up the water return set temperature rather than allowing the heat pump to do this quickly. I would imagine this results in the heat pump running the compressor at a lower RPM speed for longer and having a reduced cooling effect to the evaporator, potentially prolonging times inbetween defrosts & increasing CoP. What effect toggling demand on/off signals or altering the return temp set point on the fly to the heat pump makes to the defrost algorithm I don’t know (Never worked on Mitsi). One to perhaps think about.

On the topic of compressor running speeds and run times. The compressor manufacturer will specify a minimum and maximum running speed for inverter driven compressors as well as minumum run times. This is to ensure compressor longevity. Compressors contain oil and the compressor RPM and run time makes all the difference in making sure that oil gets to where it needs to go within the compressor. Generally speaking, compressor longevity is increased by reducing the number of starts per hour they have to perform. There is also a rule in the UK that should be followed to prevent upsetting the local DNO - no more than 3 compressor starts per hour. Most heat pumps have this inbuilt. Trying to override this may shorten the compressor lifespan and upset the DNO if they catch you (unlikely but still!)

Nevertheless, my inner heating geek rather likes seeing stuff like this. Would the gains in CoP efficiency be worth the time & effort spent seeking them? I would question it, but if you’re enjoying it and it doesn’t leave you with a broken heat pump, then I will enjoy seeing the fruits of your labour. :smiley:

2 Likes

Thanks for the kind words @moojuiceuk

There’s a lot of important points you mention there. You’ll see I’ve expanded on most of them over in the heat pump category:

For control I’m exclusively using commands their phone app can send. That way I can’t do anything they didn’t design for (and continue to support in the future). As a result my program just looks like a very very involved app user.

It would be nice to have finer-grain control, but (as someone who also supports other tech) I’m fine just using what they feel comfortable with.

Thanks again for taking time to think about these things and for sharing.

1 Like

I never realised you were using an API which is part of their app. Fair play :grinning:

For DHW prep, have you looked at taking an external weather forecast dataset for your area, then adjusting when DHW can be performed based on anticipated peak ambient temperatures that day? That might increase CoP figures a little bit for DHW prep. Of course this depends on when you have a demand for hot water, tank and pipe losses etc.

Also, are you heating your DHW tank to 60C every so often (say once a week)? I know of two different heating engineers who caught legionnaires and they wouldn’t wish it on their worst enemy. That hygiene cycle could be scheduled around the next highest forecast air temperature to aid efficiency perhaps?

I also wonder, from a CO2 national grid point of view what the merits would be to using a much larger thermal store and to heat that up based on when electricity is greener, by taking data from https://carbonintensity.org.uk/ or charging the thermal store during periods of off-peak electricity. Yes, the air temperatures will likely be lower overnight when prices are lower = lower CoP, but would the CO2 output be reduced by using electricity that was greener to produce at those times? Just a thought :slight_smile:

Here you go @moojuiceuk

Notably the demand shaper app in Emoncms should allow me to do that agile tariff/ CO2 bit. That’s part of the reason I’m doing all this work to integrate, such as this app

See

1 Like