Hi,
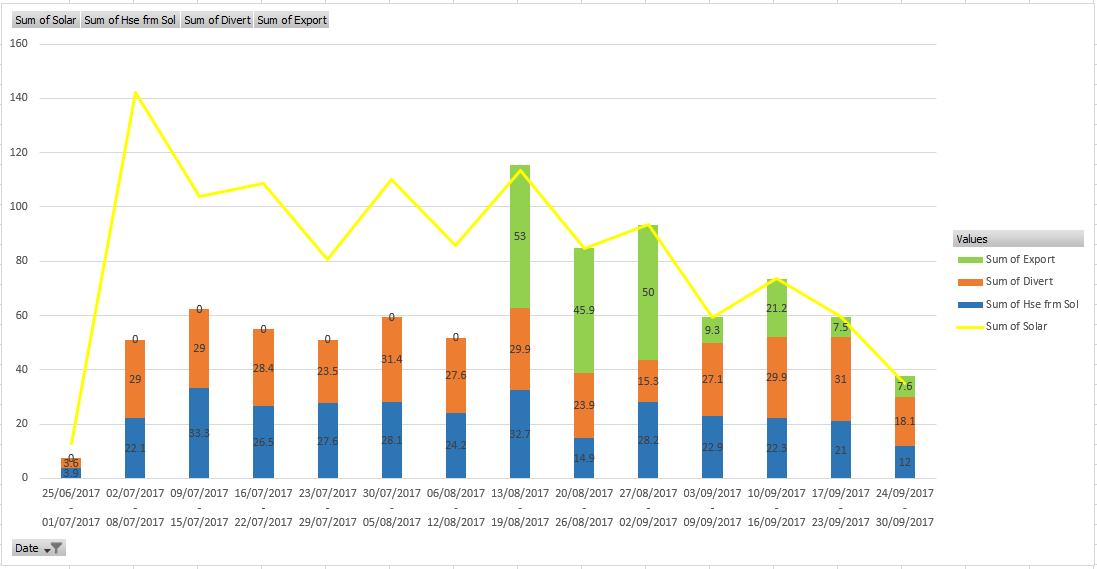
I’d like to build some graphs which show a stacked bar graph of weekly or monthly stats, to ‘show house from solar’, ‘divert to immersion’ and ‘export’, to compare with a line showing ‘solar generated’, roughly equivalent to:
I can only see input processors up to daily kWh within ecmoncms, I’ve looked through the community and couldn’t find anything to suggest that this is a current/ planned capability.
I’ve taken a very quick look and found references within “PHPFina.php” for weekly and monthly, hence presume that the basics of the capability are there, but that it may need a few input processes to be configured etc.
I’m happy to have a hack around, but wanted to check the approach and whether anyone had kick started this and that I could build upon.
I’ve been tweaking multigraph to support the visual aspects, hence my current focus upon creating and storing the feeds