Feature request: time picker and hourly range in graphs

I love the EmonCMS Graph module. I spend hours in there plotting and analysing graphs.
I just wish there were 2 additional features:

  • a date/time picker to set start and end time. I don’t speak epoch fluently…
  • and “hour” range button alongside the D, M and Y buttons. That’s because I seem to concentrate a lot on the last hour as I spend a lot of time trying to understand and optimise the behaviour of my electric and gas systems.

All I want for Xmas is those :wink:
Merry Xmas to all!

The Apps offer default buttons for 1h, 8h & Week. This may be a good solution for you.

I just wish it had 12h and 48h, or better still if we could change what date ranges it shows.

I’ve also found this a little difficult to manage. I’m just finishing off some other changes in Multigraph (the current version is well worth a look), and will try to look into this after my changes are complete and ready for inclusion into the master

I’ve had some time off before Xmas and managed to get the following updates made on my local copy:

I’ve taken most of this from the date time picker in Multigraph. I’ve also tweaked the tooltip to only show the number of decimal places specified beneath, as for some feeds it was should 6+ decimal places.

It also works when embedded into a dashboard.

I’ve created a pull request and am waiting for any updates, feedback or suggestions.

2 Likes

I’ve tested this and it seemed to work great for me. Nice work @CDuffy! :+1:

This PR has been merged into Graph master branch. Please feedback on this thread if any issues are found. We’ll allow some testing time before merging into stable branch. If you your running a standard emonPi you will need to switch to master branch to pull in the changes:

rpi-rw
cd /var/www/emoncms/Modules/graph
git checkout master

Thanks @glyn.hudson,

I’ve been looking around and see the interest in displacing multigraph with graph and after having looked I can now see how with a few enhancements to graph I can get it to cover the functionality that I’ve been tweaking in multigraph.

To this degree I’ve been further tweaking my copy of graph and it now provides stacking:

Changes I’ve applied:

  1. Adding flot.stack, and an additional option “stack:true/false”
  2. Changed the fill opacity to follow the multigraph approach - i.e. solid colour if stacked, 50% opacity if not, or no fill
  3. fixed my code to pick out individual bar heights when stacked (same as my changes to Multigraph)
  4. Changed “bars” to show as centred although this looks a bit quirky for the first bar on the left - needs some thought of how to manage this

I propose to make the following changes and hence was interested in getting feedback and guidance before starting:

  1. Add “Stack” column into feeds view
  2. Change DP to default to 0 for datatype=1 and 1 for datatype=2
  3. When applying intervals of a week/ month/ year, change the tooltip to highlight the start to end of that range
  4. Change the display of “Interval” to easier to read, e.g. allow for displaying/ entering with “1h”, “1d” etc
  5. tooltip placement for entries on the far left only show the right hand part of the tooltip - need to move this to the left when tooltip width > xpos.
  6. For “Show CSV” segment store defaults within the saved graph entry
  7. “Show CSV” add an option to display a headers row
  8. The ability to re-order the Feeds - maybe an up + down arrow for each row

Thoughts and constructive feedback are always welcome.
Clive.

3 Likes

Hi Clive,
Stacking with Deltas - perfect; I can finally get rid of my kWh/d feeds!
Is there an ‘auto’ refresh (every xx seconds) option in graph?
If you click a legend on the graph, it hides/shows that line/bar. This never worked quite right in Multigraph if things were stacked - it would hide the line and everything after it.
Thanks! Sandy

I’ve just submitted a pull request for the following changes:

Include options for stacking, reordering feeds and storing CSV display options.
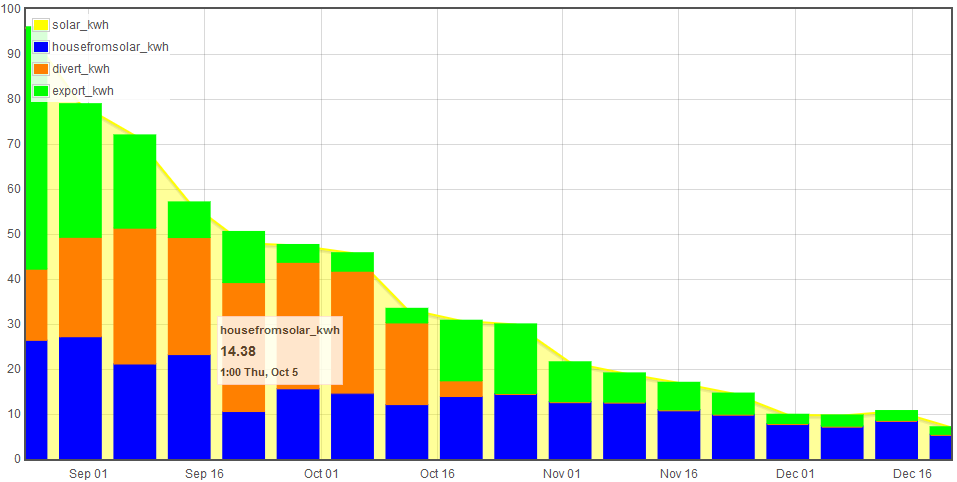
Graph changes when stacked:

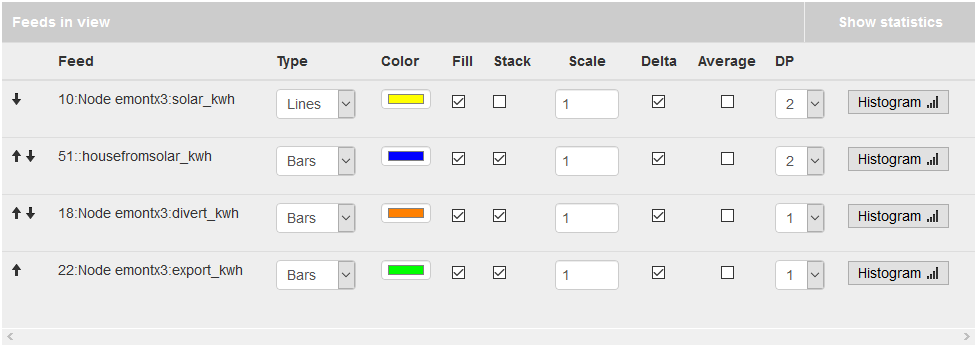
Feed list changes (reorder feeds arrows & stack):

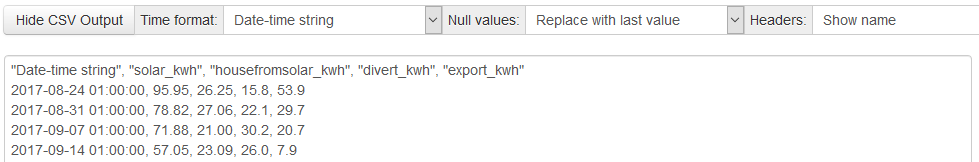
CSV Output changes (CSV Headers):

Of my previous list, the following are implemented in this pull request, I’ve tested them, but they need broader testing:

  • Add “Stack” column into feeds view
  • Change DP to default to 0 for datatype=1 and 1 for datatype=2
  • For “Show CSV” segment store defaults within the saved graph entry
  • “Show CSV” add an option to display a headers row
  • The ability to re-order the Feeds - maybe an up + down arrow for each row

I still have the following to work out what to do with:

  • When applying intervals of a week/ month/ year, change the tooltip to highlight the start to end of that range
  • Change the display of “Interval” to easier to read, e.g. allow for displaying/ entering with “1h”, “1d” etc
  • tooltip placement for entries on the far left only show the right hand part of the tooltip - need to move this to the left when tooltip width > xpos.

The first two just need some time, the last one I’m unsure how to achieve as I do not know how to easily determine the tooltip size to align. Otherwise I can just change placement to be after the pointer on the first half of the graph and before the pointer on the right hand side.

@blaal02, I’ve been tinkering with hiding a series, it works if the series is either the top or the bottom series within the stack, but if within the middle this seems to ‘loose’ the stack details and plots from the bottom. If you apply my updates, display your series (NOT filled), then hide rows and you’ll see the tops of the bars bounce around.

I need to get on with my day job, hence stopped changing things for the moment. I’d like to get any final tweaks or updates included before delving into the last few changes.

Clive.

3 Likes

Nice work @CDuffy thanks a lot :+1:

I briefly tested (I’m currently travelling) and everything seemed to work great for me. I will let some time pass and get some more data points from uses before doing a release and merging into Emoncms stable branch. Current master branch changes won’t be available currently via emonPi / emonBase update.

All your proposals sounds good.

Hi Clive,
Looking good to me too! One trivial request; the fill colour logic - 50% only if not stacked - could you do that for lines as well as bars?
Thanks, Sandy

Hi @blaal02,

The original logic was to supply true/ false, which looks to give a 50% opacity for true. The logic I’ve applied was taken from multigraph.

After your question, I’ve noticed that my pull request version didn’t apply the opacity correctly for lines, but OK for bars which I’ve been testing. It attempted to define ‘fill’ twice, hence has effectively not changed. I will update this along with any other quirks that anyone finds in the New Year.

@glyn.hudson,

Like you, I’d much rather get others feedback on using these updates before they become more mainstream. I’m sure there must be some issues, hence would like to clear those now to prevents problems later.

Hi @CDuffy,
Here’s my main dashboard redone using your graphs:


For Dashboard use, I’m slightly missing the floating end time (current) & the auto refresh. When you’re done, maybe I’ll take a look.
Thanks! Sandy

1 Like

I’ve made a change to PHPFina.php as it wasn’t returning the last value in the range requested, PR:

I’ve also submitted a new pull request to finish off the other items I promised to work upon:

It’s a fairly hefty set of changes, hence am expecting a good and strong critical review/ appraisal.

At a high level, changes as follows:

  1. Change tooltip to show give context related info, e.g. for a daily stat only show YMD
    image ← Daily
    image ← Larger than 24hrs
    image ← less than 24hrs
  2. Add support for touch devices within flot
  3. Change the Interval to display and accept human readable figures, e.g. 1d, 2w, 4h
    image
    image
  4. Set the minTickSize to align with the YMD intervals
  5. bar position is placed to the right for ‘delta’ to help show what time duration this covers
    image ← With delta selected
    image ← Without delta selected
  6. Store the requesttype, e.g. fixed, daily, weekly …
  7. Align the start/ end dates to show the entire bar
    image

Quirks/ bugs still to be ironed out:

  1. When a series is toggled off, this need to be reset when loading a new graph, i.e. you hide the first series when looking at “saved graph1”, then open “saved graph2” and it also shows the first series hidden.
  2. Stacked line tooltip shows the absolute location on the graph, rather than the delta from the data series beneath it. This is because flot stores stacked line data differently to stacked bars and hence needs a different means to obtain the delta
  3. Weekly and daily graphs starting within daylight savings time don’t show the first data point, I need to think about how to cater for the +1 hr encountered during this period

Thoughts for further enhancements:

  1. if the start is part way through the first data point or last data point, then no data is shown is shown for that point. e.g. showing a monthly delta starting 1st June and ending 1st November, but we only have data from 13th June to 29th October, then the first and last deltas do not show.
    Maybe, this can be an option “show incomplete data point” which would shown the 2nd half of June and majority of October
  2. When the logoff timeout expires the graph tool just gives a blank page, add checking to push the user to the logon page, or otherwise show a pop-up logon (if one already exists!?)
2 Likes

I’ve made a few cleanups in the tooltips to give better localisation support:

Change the date/ time to use the browser language to display in the users locale. I’ve done this as my previous addition had forced it to en-gb, which was a poor thing to force it to.
Also applied the same display of numbers, to support the different decimal places and separators used.

image ← Browser set to en-gb
image ← Browser set to de-de
image ← Browser set to en-us

@glyn.hudson Any chance we can consider this for the master branch now that the previous changes have passed into stable please? Please say if you have any concerns/ queries.

Clive.

2 Likes

That sounds like a good idea to me. I can’t see any issues. What do you think @TrystanLea? Please go ahead and open a pr

Hi @glyn.hudson

These are updates to my previous PR on 11/1, hence includes the changes above as well, eg placement of bars if a delta, making the interval field show as 1d, 2d, 1w etc …

Thanks,
Clive

1 Like

Thanks. I’ve just testing commented on github :+1:

Apologies, my description wasn’t clear enough, I’ve given a better explanation and example with the PR.

It also needs a little more thought, hence please read and I’m interested to hear which direction would benefit us all. I can bring the comments back here if it would help get a broader feedback.