thanks, has the boiler kicked in? seems to have gone off?
Yeh, trivai kicked in… I disabled… HP will soon come back
@20:33 stopped interference of the boiler’s pump
1 Like
Thanks @Ulric looks like 4.8kW Emoncms - app view similar to some of the other measurements for the 5kW.
2 Likes
I’ve added your test to the table @Ulric looks like it is a bit lower than others, 29% lower than datasheet if I’ve got that right. Thanks again!
1 Like
You’re welcome
I guess it could do a bit better if it wasn’t so foggy
1 Like
is your target temperature data coming from Vaillant ebus?
and is the outside temperature data also from ebus? or from our Metoffice data feeds?
More generally, are there any settings that we might be missing that could contribute to lower than expected outputs e.g silent modes etc?
Both from Vaillant ebus for me
1 Like
Target & outside temperature both come from ebus. I have no noise reduction or similar enabled, only eco mode for DHW which should not make a difference here.
For these kinds of analyses, it would be great to supply a humidity feed into the heat pump app. In foggy conditions, this would not be sufficient as the droplets condense in air so the absolute moisture content is even higher. No idea how to quantify this exactly.
1 Like
OK. I was concerned to find out where a slightly undersized Vaillant 7Kw might run out of puff as the weather got colder: the interaction of increasing heat demand and increasing defrosting as temperatures dropped could have been a problem for me.
Warning- involves quite a bit of interpolation/ reading of graphs on OEM, so treat results with caution.
My starting point was this Vaillant data sheet
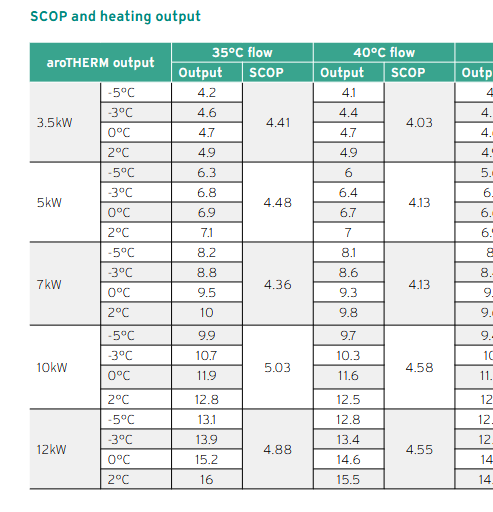
My guess was that these figures were reasonable maximums but excluding defrosts. The data below is consistent with that guess, and provides some estimates for both. The alternative guess- that the stated outputs in the data sheet include defrost allowances- can’t be squared with the data.
To test the first part I found a V 7kW pump on OEM (#124) that seemed to be working hard in the 11 Jan cold snap. That pump was regularly showing 10.5kw steady output between defrosts at temperatures of c-1 (as low as I was interested in). For simplicity I assumed that actual peak output in favourable conditions was about 10% above the spec outputs at all OATs…
Now to estimate defrosts losses, comprising:
- heat draw per defrost (c0.5Kwh)
- heat output lost per defrost (c6min per defrost at stated output)
- ramp up after defrost back to full output (c10min, losing 0.2kwhr per cycle)
- ramp down as defrost approached (c2min, losing 0.15kwhr per cycle)
- defrost intervals, varying with OAT. My inspection suggested c40 mins at 1degC and below, steadily increasing as temps increase to 5deg (with a slight improvement at 0degC).
Put these together I got:
| OAT | Output kW | Defrost loss % | Output gain % | Net |
|---|---|---|---|---|
| 5 | 10 | -2% | 10% | 8% |
| 4 | 10 | -7% | 10% | 3% |
| 3 | 10 | -10% | 10% | 0% |
| 2 | 10 | -18% | 10% | -8% |
| 1 | 9.75 | -28% | 10% | -18% |
| 0 | 9.5 | -22% | 10% | -12% |
| -1 | 9.1 | -30% | 10% | -20% |
| -2 | 8.7 | -31% | 10% | -21% |
The key factor is defrost interval, not surprisingly- a small reduction in frequency at 0degC came from my observation that the interval increased from 40 mins to 50 mins at that OAT. I had no info on humidity but 11 Jan here in London was pretty damp.
Treat this with caution- other HPs would be different, and my observations and calculation may contain errors. But it gave me some confidence, for my various heat loss estimates, at what OAT I would need more heat from a backup with this model HP.
2 Likes
@Simonwhiteley confused how to read this. We are seeing an average of around 6.7 kW from the 7 kW vaillant in the 0 to -3C range, what does your ‘Output kW’ column relate to?
“Output kw” is what the Vaillant spec sheet (pictured above) shows for 35deg flow temp, with some interpolation/ extrapolation from me. (I see the -2 figure should be 8.8kW). Less 20% gets you pretty close to your figures.
(PS- hadn’t noticed this topic was closed- apologies!)
1 Like
Great thanks @Simonwhiteley, worth adding another column with the net outputs? The thread is still open ![]()
Here you go- have relabelled columns to make a bit clearer.
| OAT | Spec output kW | Defrost loss % | Output gain % | Net gain/loss | Actual output kW |
|---|---|---|---|---|---|
| 5 | 10 | -2% | 10% | 8% | 10.8 |
| 4 | 10 | -7% | 10% | 3% | 10.3 |
| 3 | 10 | -10% | 10% | 0% | 10.0 |
| 2 | 10 | -18% | 10% | -8% | 9.2 |
| 1 | 9.75 | -28% | 10% | -18% | 8.0 |
| 0 | 9.5 | -22% | 10% | -12% | 8.3 |
| -1 | 9.1 | -30% | 10% | -20% | 7.3 |
| -2 | 8.7 | -31% | 10% | -21% | 6.9 |
1 Like
Where is the ‘output gain’ coming from?
And how is ‘Defrost loss’ measured?
See longer post above Vaillant maximum output capacity testing - #139 by Simonwhiteley
Happy to explain more if needed.
I still don’t understand why you’re estimating defrost losses, when they can be measured directly.
Looking at system #124, specifically this 3 hour period in the morning that saw 5 defrosts with average ambient of -1°C:
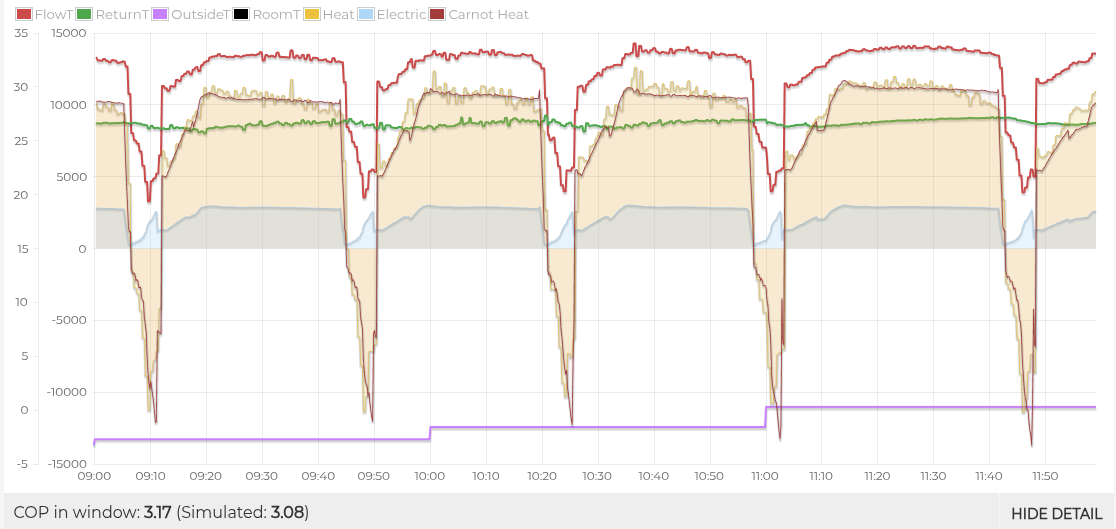
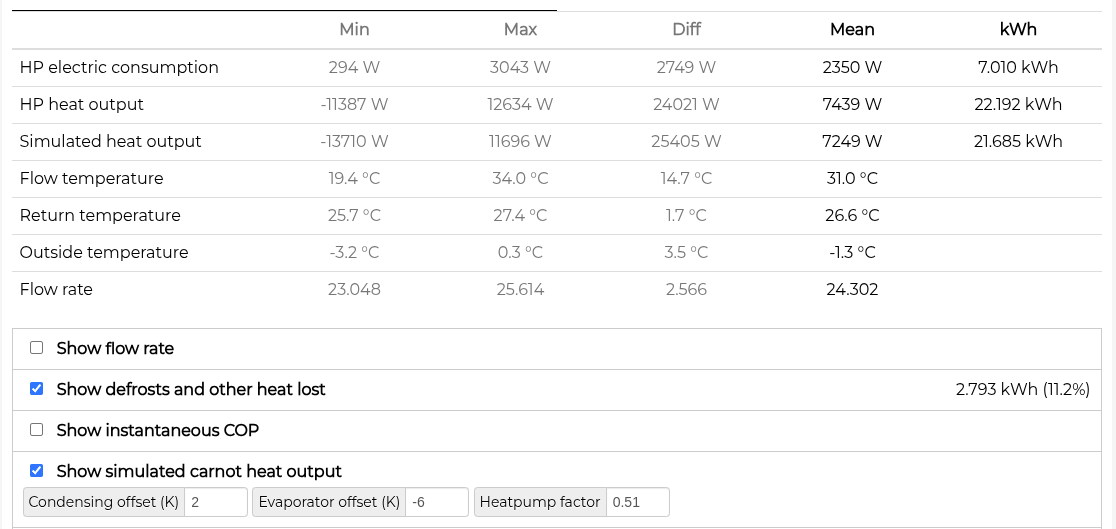
- maximum heat power = 11 kW
- total overall heat output = 22 kWh (average power 7.4 kW )
- total heat lost to defrosts = 2.8 kWh (11%) (average power 0.93 kW)
- heat output is matching the Carnot formula very closely, so no other “losses”
This other random system [#158] defrosting 4 times at -1°C:
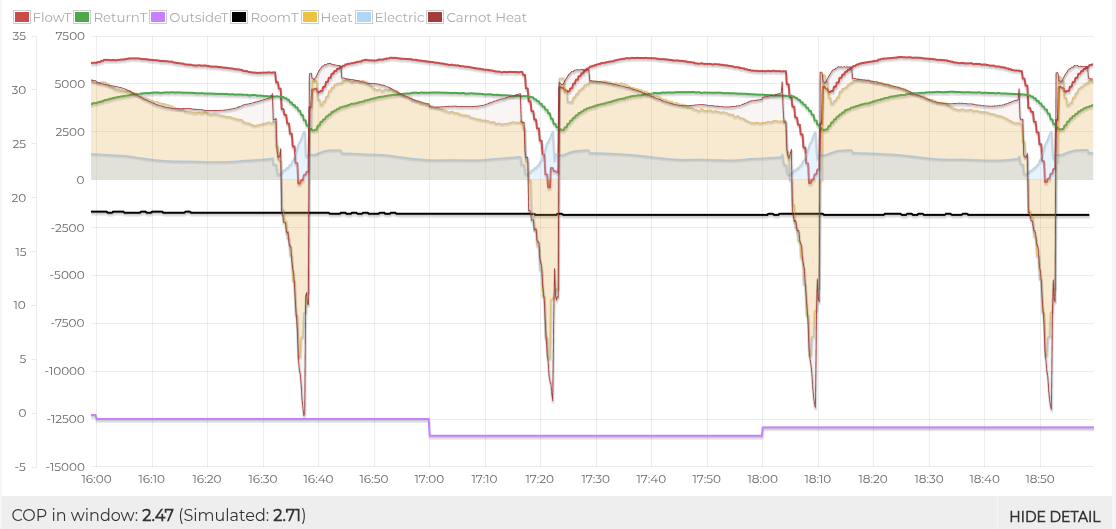

- maximum heat output = 5 kW
- total overall heat output = 8.9 kWh (average power 3 kW)
- total heat lost to defrosts = 1.8 kWh (17%) (average power 0.6 kW)
The Carnot formula does show a drop of performance just before and just after the defrost, accounting for another 0.3 kWh of heat “lost” due to the defrost. Less than 0.1 kWh per cycle.
The same system at +1°C lost just 10% of heat to defrost.
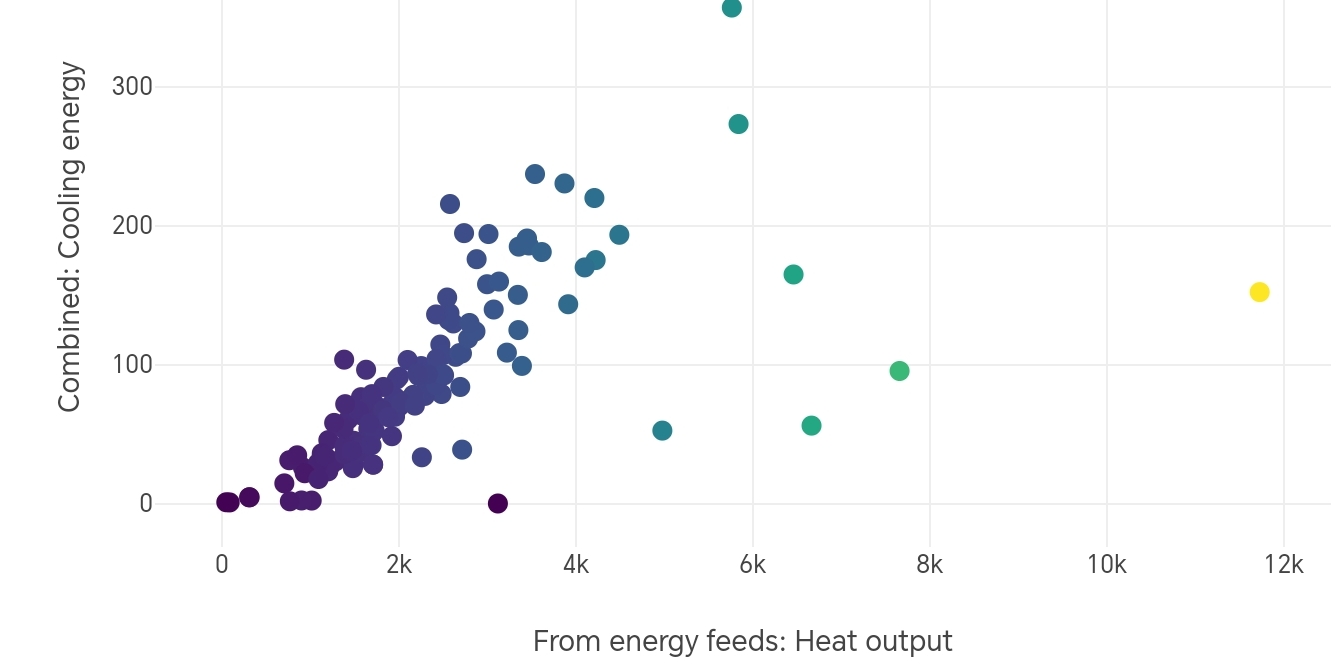
Looking at the aggregate data for 316 systems over January, plotting total Cooling (defrost) energy over total heat output shows a fit gradient of 4%. Some of the most affected systems have defrost energy up to 10% of their heat output. Much easier than examining individual systems.
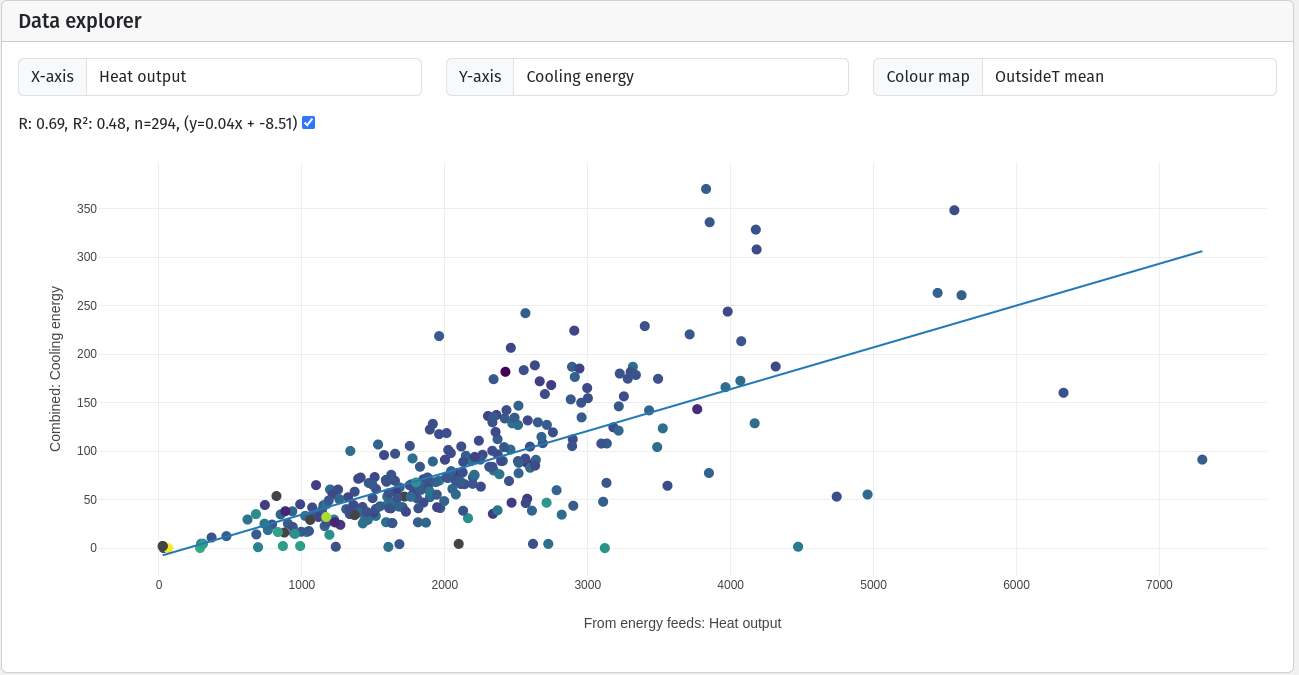
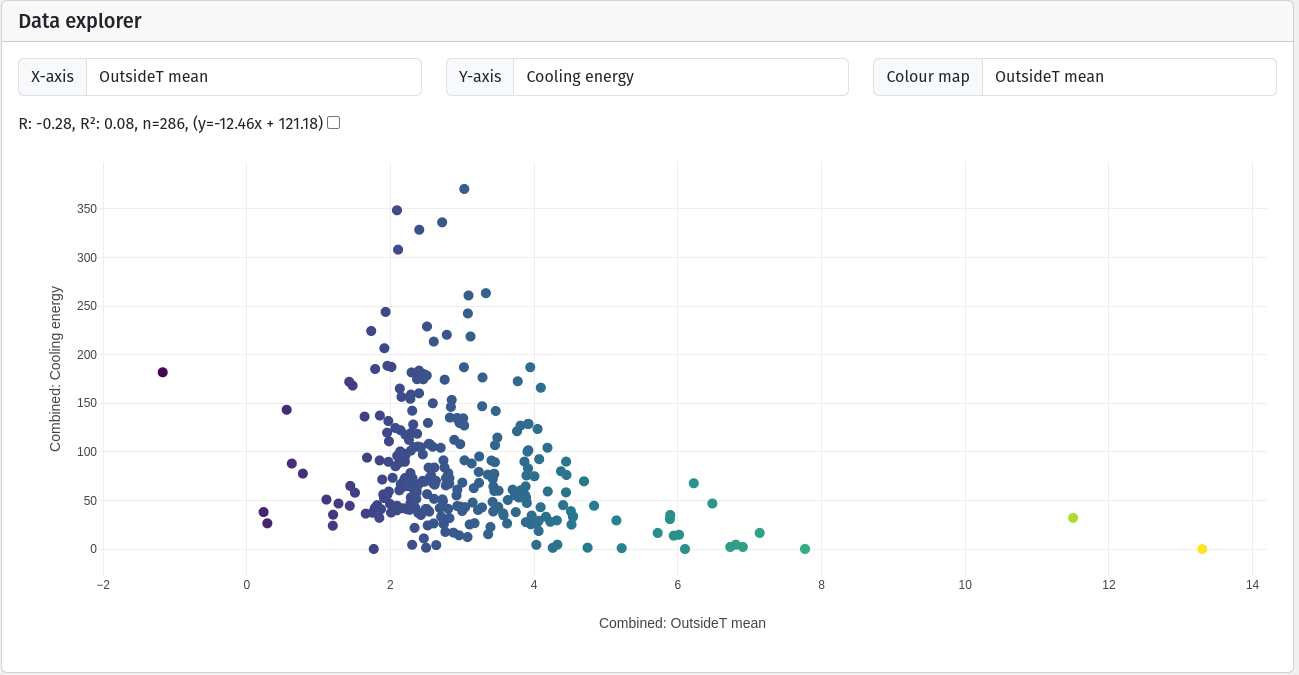
(Plotting against “OutsideT mean” and we’ll see that most systems were running between 1 and 5° ambient, prime defrost temperatures.)
Edit: even amongst only Vaillants, defrost accounts for just 5% on average.
tl;dr heating energy lost to defrosts isn’t nearly as big as you have estimated
4 Likes
Great analysis and very interesting. I was trying to understand the differences and clearly there is some difference due to estimation vs just using the actual data, but was also wondering whether there is also a slight difference in what is being measured/estimated. My understanding of @Simonwhiteley s analysis is that he is trying to get at how much less heat is being delivered to the house (due to direct defrost energy loss and inefficiencies due to frost accumulation etc.) compared to if the system was running at peak output 100% of the time. So a system with a peak output of 11kW would deliver 33kWh in a 3 hour period (were it able to run at 11kW all the time without defrosts or any other degradation in performance). If it actually delivered 22kWh, this would be a 33% “loss” from the theoretical max. (i.e., if you extrapolated from the spec. with no consideration of defrosts). I may well have misunderstood, though!
Thanks Graham- yes that was my approach. So the heat draw during defrost, which Tim correctly says wasn’t estimated (although it does vary a bit between defrosts) is only one part of the total loss because of a defrosting event- the lost positive heat output, plus ramp up back to full power and the ramping down as the next defrost approaches, also added to the total defrost loss. In rough terms the heat draw is about half the size of the other factors combined, at least for this heat pump. And then frequency matters a lot.
2 Likes
keep 5 and add back up heater. We don’t have many issues with the 5kW unit and it gives the same output as 7kW anwyay ![]()
3 Likes