Using an SCT-013 to calculate "low overhead" instantaneous power monitoring, is this method missing something?

Thanks @Robert.Wall …I understand that. I guess what I didn’t expect, is that for my test cases, it seems like ALL loads are steady (obviously resistive loads like crock pots, compressor, hair dryer, fans)…and it seems like it is very easy to obtain accurate instantaneous power measurements at high sample rates AND at “lower than high” sample rates. My “sampling scheme” goal is to take a minimum number of samples necessary to get a TBD accuracy. :wink: But I think I jumped the gun in a couple of those previous posts and would like to back up a bit.

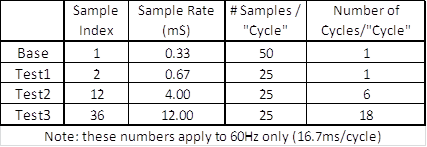
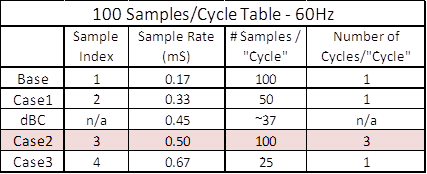
I didn’t explain that table I posted well at all. For the given sample rates, it actually provides the means to ensure this doesn’t happen. However, I didn’t post the entire table, and my explanation was terrible. But I will revisit that a bit later.

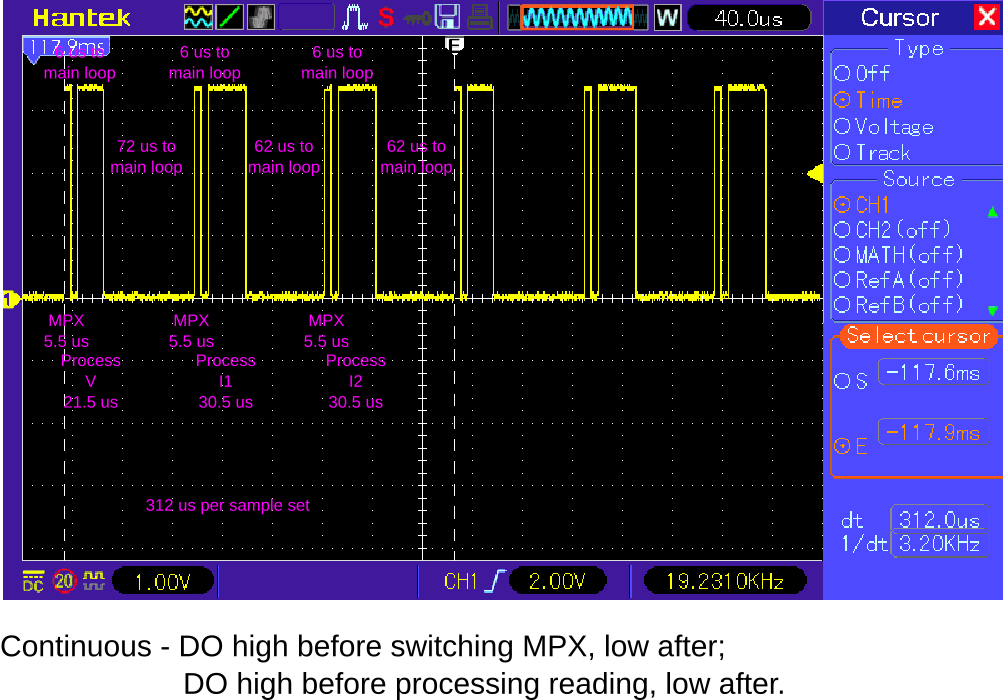
Robert, this is easily solved by ensuring the sampling is not done sequentially (which presents the problem you point out), but more intermittingly: consecutive samples spaced ~3/4 of a cycle apart (best), or various versions of that…even ~1/4 cycle spacing eliminates most of this. But this “example” leads to a question…

Is your concern over the inaccuracy based on a single occurrence of whatever waveform being measured is turned off at the 75% point of a particular “second” (which seems to be somewhat of a wash in a 10-second sample), or is the concern that a device being sampled will be operating consistently (harmonically?) in that fashion and you will accumulate error over a longer period of time?

How does the emonLIB deal with a case where it samples a signal for 200ms and then “something” turns off and is not recorded for the next 9.8 seconds?

Also, I have no clue as to the answer for this: for power monitoring, what is “good enough”? I know that “better” is always better, so more specifically…what are the tolerances/goals for emonLib and emonLibCM in accurately accumulating power usage?

Thanks again for your help, Robert…feel free to cut me loose at any time and let me flounder away, haha.

@dBC, thanks…I read through that post. I had been planning to use the type of measurement you describe there (true average power over the last x seconds) in my pool pump project…but probably with “x” being 0.5-1.0 sec. The reason being is that I don’t think my pump’s GPM output resolution (that I eventually get) will be any finer than that.

Nice job on dissecting the waveform…I don’t see any problem there for getting accurate measurements of that kind of operation using my sketch, based on the results of my test cases. I don’t have a ceramic cooktop, so I am thinking about “inputting” that wave into my sketch in a “simulation” to see how it does based on my “sampling schemes”

Is there a nice example like that for an induction hob?

So I thought about dynamically changing loads and what I could use to test my sample schemes. After running an extension cord to my DeWalt chop saw and getting some samples, I figured out the obvious…use the hair dryer and dynamically/rapidly/slowly turn it on/off/high/low as randomly as humanly possible, for at least until my thumb got tired…which it did.

I’m pretty sure that I got multiple changes in there within a second (at times) in addition to the motor / heating element trying to ramp up and down to keep up with it. I suspect this case is much worse than an induction hob.

I tried to simplify things a bit this time, because I realize I did a poor job of explaining things in my prior posts. Bear with me though, I am probably going to screw up some terminology which is unfamiliar to me. I am also certainly going to mess up some numbers somwhere as I have been testing so many different cases. But here, we are going to test four cases.

image

The Base case is our golden ruler (50 samples/cycle)…to be used as a yardstick to judge our other three test cases. Test1 is a repeat of the Base, except with only 25 samples/cycle. To keep things “easy” the other two cases will also be limited to 25 samples/”cycle”.

“Cycle” is in parenthesis for a reason…Test2 & Test3 samples are not taken over one 16.67mSec cycle, they are equally spread out over multiple cycles. If you start sampling at a zero crossing (I don’t) the sample rate will determine how many cycles are necessary before another sample lines up at the zero crossing (starting a new sample “cycle”).

For example Test 3 has these parameters (from the table):

Column 1 indicates how many multiples of the Base sample rate are sampled…in this case, a sample must be taken at 1/36 the base rate: 36 * 16.67 = so every 12 mSec (column 2). Column 3 is simply the number of samples that must be taken to line up to a new starting point (zero crossing if that is your methodology). Column 4 shows the number of 16.67ms cycles it takes to line-up to that zero crossing again. Here is the relationship:

Col2 * Col3 = Col4 * 16.67 mSec = time for a complete “cycle”

12 mSec/sample * 25 samples = 18 cycles * 16.67 mSec/cycle = 300 mSec for a complete “cycle”

Here’s the results of my latest Dynamic Load testing, and based on the discussion we have, these might be the final tests I run before deploying to my pool controller, haha.

I’ve changed things around a bit to make this easier to look at and hopefully understand. I’m calculating Instantaneous Real Power (IRP, a new term for me, thanks @dBC) at every .25 second interval for all four cases.

For our base case, that means 15 complete cycles are sampled/multiplied/accumulated for each .25 second interval. For the base case only, we are also keeping a record of the lowest and highest IRP values (captured from among the 15) for each .25 second interval, just to get a feeling for how quickly the power numbers are changing. They are changing very quickly as you will see.

In addition, I’ve added a cumulative energy value for each test case. I hope that helps in judging the performance of these cases. It looks like the numbers are good to me, but I have no reference. It definitely worked a lot better than I expected it would. NOTE: there is an error in the labelling…Watts-sec should be labelled Watts-.25sec :smile:

As @Robert.Wall pointed out an earlier post, spacing out the sampling will make the results lag…that is clearly seen, does it matter for most applications? EDIT: trying to figure out how to make this readable…it’s from Excel

For now, I’ve copied to Google Sheets and here is the link…but I think I must figure out a way to do it more directly.

And before I have to go…I want to throw out a guess as to why this works as well as it does, although it’s just based on a low level understanding of what is going on. I’m going to be very busy this week.

All of these power calculations/signals are based on sine waves. Unfortunately, they are not “ideal” sine waves…but many of them are close. With an ideal sine wave, I believe it’s possible to recreate the entire cycle with a SINGLE sample…IF you know exactly where that cycle was taken in the sine wave. Thus the relevance of the tightly controlled sample points in these examples.

So, imagine the case where we are taking 50 samples spread out over 50 cycles, and each of those cycles changes in amplitude. Given sufficient computing power, you could recreate each of those cycles and do the math on them…we don’t have that. But, I believe that there must be an analog version of that occurring through the multiplies and summations.

It’s just a guess…

Sorry I’ve been silent for a while - the hinge on my laptop pulled the screws out of the moulding, so it’s been in pieces for 30 hours or so.

That’s very true. On a phone screen, I couldn’t make sense of it at all.

What my speadsheet was doing was sampling at just less than half-cycle intervals, thereby showing the ‘beat’ effect you get. You’ll still get the same error (in absolute terms, it’ll reduce as a percentage) over any number of incomplete cycles. EmonLib(DS) reckons to average all those errors over an extended period of time - which is indeed what happens. So if you induction/ceramic hob happens to be switched on every time you sample today, it might not be tomorrow nor the day after.

It’s what is good enough for your purpose. If you don’t need the best accuracy, it’s pointless chasing it only to throw it away when you’ve got it.

We have never claimed any. Forum reports indicated that emonLib(DS) could get within 1% of the billing meter over a month or so, I’ve had emonLibCM within 0.15% over a week or so - more by luck than anything else, but I’ve found I can tweak the calibration so that it’s accurate at low loads or accurate at high loads, which I put down to the varying phase error of the c.t.

I don’t do that sort of thing when people are being sensible and trying to learn.

That’s indeed true, But a big ‘IF’. If you stop there, you have apparent power. And if it’s a reactive load, how the phase of that relates to the voltage to get to real power. A second big ‘IF’.

Indeed there is. It happens inside every (analogue) radio receiver, it’s how the broadcast frequency is lowered to an “intermediate frequency” to be amplified before the sound is extracted.

Robert, this is obviously an expansion to my original project, haha. I am confident I can get the accuracy I need for my project. But, based on all my testing, I really think there is something to this “synchronized sampling scheme” and IF THERE IS, it could be applied to many cases…not just to mine.

I’ve read through quite a few posts on these boards and see that a “continuous sampling” methodology is the ideal solution, if it can be afforded. This methodology could make a poor man’s version affordable AND it also could have application at the high end.

So, I am hoping that you and the other smart people on this board can help determine IF this synchronized, sampling methodology is valid in general…here are a few of the reasons why I think is could be very useful (with the caveat, once again, IF it is valid):

  1. I started down this path because I am cheapskate in dealing out my cpu cycles and A/D sampling bandwidth. This opens up the possibility for many similar projects to capture and calculate “accurate” instantaneous power readings…even using chips such as the ADS1115 (which happens to be another chip I really like and am using on my pool controller project)

  2. Obviously, there could be a direct application to such projects as emonLIB where cpu cycles and A/D bandwidth could be divvied out continuously, over time, to do these calculation with a TBD impact on accuracy

  3. I briefly touched on this before, and I am sure that it didn’t make any sense to you. But I am going to give it one more shot…once again, IF THIS METHODOLGY IS VALID, I think there is an application of this technique at the high end of the power metering spectrum. This is a “constructed example” just to make the point. Hopefully it will be understandable.

This example is for a 60Hz system. @dBC is currently involved in a project to increase the power sampling rate in a new project. Suppose the hardware that they are using is limited to taking & processing the samples on all phases to every .45mSec. But the original goal of the project is 100 samples/cycle in order to capture all the power harmonics, etc (I am making this stuff up, I hope it is relevant).

Below are the first few entries of a “100 Sample Chart for 60Hz” with dBC’s case thrown in.

image

So dBC’s project has a choice…do they take 37 samples every cycle to get a randomly scattered sampling of data points across each cycle to multiply and accumulate…OR do they reduce their sample rate to CASE2 and (IF THIS METHOD IS VALID) get a an “effective” sampling rate of 100 samples/cycle.

I don’t have the capability to measure the accuracy and difference of these two cases in my setup, but I am pretty confident that CASE2 would be the right choice.

Based on any “desired sample rate” and frequency (50Hz, 60Hz) a similar table can be constructed, all may not be useful/applicable though.

Your basic assumption is that everything is repeatable and relatively steady-state. And while that’s true, then I’ll readily agree that you can get whatever accuracy you need with the minimal need for samples and their resultant processing, with the result that you can free up processing power for other things. It’s when irregular things happen that you can miss that sparse sampling falls down. The question I’d put back to you is, why do all the metering i.c’s measure continuously, and not do it the way you propose? I’m sure the designers of those are a lot cleverer than I am.

You seem to be inferring that I’m saying “It’ll never work”. I’ve never written that. I’ve tried to point out the shortcomings and the limitations as I see them, and I’ve repeatedly said that if your use case means those either don’t apply or can be neglected, then that’s fine.
If you are content to miss (say) a spike of inrush, and trade that for doing something else, then it’s your decision as the designer. Engineering has always been and always will be a matter of balancing the compromises to achieve an acceptable result.

As you mention emonLib, here’s emonLibCM processing one voltage and two current channels on an Atmel ATMega328P:

The caption tells me that you’re looking at a digital output. It’s been driven HIGH in the code just before it drives the multiplexer to select the analogue input and LOW immediately that is done, then it’s driven high again as it starts to process the reading and low when it’s finished. The difference in the amount of processing of the voltage sample compared against the current sample is clear.

Just looking, the processor is only in the ISR and handling the current and voltage samples for about half the time (and if you add up the numbers it’s less than 40%, but it’d be slightly more with 4 current samples), for the remainder it’s free to do whatever the main loop calls for - like calculating the averages and transmitting them every 10 seconds or so. But for most of the time, it’s just cycling and waiting for the next measurement to be ready.

There’s really no need to reference me in on your hypotheticals. I browse this forum as time permits and reply when I can. I got lost on your first spreadsheet post but decided I didn’t have the bandwidth (pardon the pun) to give it the attention it deserves or inquire further (and I still don’t). If you’ve got any specific stm32 ADC questions, feel free to @ me in to get my attention.

But for the record I’m not doing what you claimed in your hypothetical. I’ve always sampled at 8kSPS, every channel every cycle non-stop and that’s what is used to calculate all the power maths. That’s baked in silicon, there’s nothing I can do to change that. The only thing that’s being improved in my rev 2 is the scope-like display of the signal. Rev 1 only had enough horsepower to capture every second sample for the display, while rev 2 captures all samples… WaveView4K has become WaveView8K if you like, but the power and energy calculations are identical.

I think you’ve received nothing but encouragement here to take whatever measurement shortcuts work for you and your load, but if you want to be able to make accuracy claims across a specified bandwidth for unknown current waveforms there really is no substitute for continuous monitoring. Anything else is a game of whack-a-mole. I post the interesting waveforms I notice and you might be able to test against them and tweak your sampling to cope with them, but for every one I post there are a thousand different waveforms none of us have even imagined. Once you embrace continuous monitoring you simply don’t care what the waveform looks like. Choose your meter bandwidth (2kHz in my case), set your sampling speed appropriately and let her rip. Pure sinewaves are no easier or harder to measure than the most distorted signal you can come up with.

Now looking back at the washing machine for instance:


what if I were to ask you how much energy that load used for the 6 minutes from 10:01 to 10:07? You can scroll back to refresh your memory on how it looked in the msec range…every half cycle had a different amplitude. What if all your loads looked like that all the time? What accuracy claim would you make on your readings?

Some are so bold as to claim 1% say, but when pressed fall back to “1% agreement with the revenue meter over the long term”. That’s actually a surprisingly easy benchmark to meet. I’m constantly blown away by what can meet that benchmark. Even the old CurrentCost with just 2 D-cells and a CT - so just apparent power with no V reference can pull it off once you’ve calibrated its output for your average grid voltage, and your household’s average power factor. So I figure if you’re going to take shortcuts, you might as well take lots of them, and save yourself some money.

2 Likes

You/re absolutely right…sorry about that. The “high end” of this power monitoring detailed in your project is much different than the environment I imagined. The example I gave is totally irrelevant. Thanks for clarifying. And, believe it or not, I do agree that continuous monitoring is the way to go…I guess I am struggling with the definition of “continuous”. Thanks for the input!

Robert, sorry if you got that impression…I have definitely appreciated all your feedback. The fact is, I am really struggling with WHY (if it does) this method seems to works at all. I understand that all my previous tests were on relatively stable signals.

Truthfully, I went into this latest hairdryer turn-off/turn-on experiment with the thought that it was going to fail spectacularly (I finally had what I thought was a “real” dynamic changing load to test). I was absolutely floored when those cumulative power results for all four test cases came back so close to each other.

I think there is probably an easy answer to this…it doesn’t really work OR it’s inaccurate for their purposes.

Thanks for posting the Atmel timings, I haven’t had a chance to look at it detail but I understand that you have plenty of bandwidth left after doing the power sampling/calculations.

We have four grandkids 24/7 this week and I only have a bit of time in the morning (before they get up)…the rest of the time I am utterly exhausted. One is getting up now, haha. Thanks again.

I think in order to meet their claimed accuracy specs, they have to assume totally arbitrary waveforms. Each half-cyle is a brand new day with no relationship to the one before it or after it.

The “1% agreement with the revenue meter over the long term” mob are really saying I’ve no idea how much energy your washing machine used during those 6 minutes but check back in a month and you won’t notice because it’ll have been swamped by all the loads I can measure.

The project I’m currently working on reports energy in WattSeconds and updates its user-facing registers every second so If I’m to have any chance of making any accuracy claims I really need to have measured all 50 (60 for you) cycles, I don’t have the luxury of assuming it’ll all come out in the wash (another lousy pun):