Today I spotted a freak value in some temperature data and decided to try and correct the one bad datapoint using vis/editrealdata. This way of editing values has always been a bit temperamental and I may have stumbled across some useful info whilst making my correction.
For this particular project I am recording csv locally and also sending to a self-hosted emoncms. It was in emoncms that I noticed that one of 34 temp sensors momentarily read -2043.125°C, thinking that was a tad chilly for this time of year I checked the local csv and found the spike was prior to sending and not an emoncms issue.
This is a snippet of the csv file, at the end of the 3rd line you can see the offending value.
1535463900.0,"w1_bus_23",21.75,21.562,21.312,20.937,21.625,21.687,21.625,21.812,20.687,20.312,20.687,21.75,20.937
1535463930.0,"w1_bus_23",21.75,21.562,21.312,20.937,21.625,21.687,21.562,21.75,20.687,20.25,20.687,21.75,20.937
1535463960.0,"w1_bus_23",21.687,21.562,21.312,21.0,21.625,21.687,21.625,21.75,20.687,20.312,20.687,21.812,-2043.125
1535463990.0,"w1_bus_23",21.687,21.562,21.312,21.0,21.625,21.687,21.562,21.75,20.687,20.312,20.687,21.812,20.875
1535464020.0,"w1_bus_23",21.687,21.562,21.312,21.0,21.625,21.687,21.562,21.75,20.687,20.312,20.687,21.812,20.875
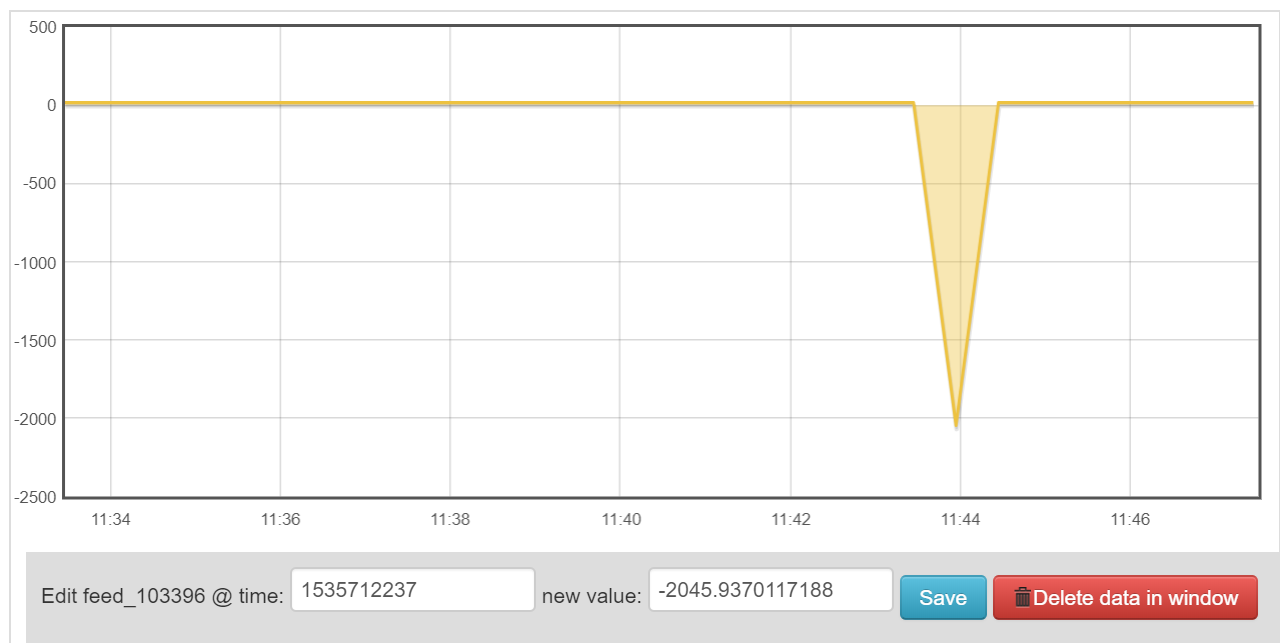
This is what it looked like isolated in emoncms/graph and below is the csv created by the graphs page.
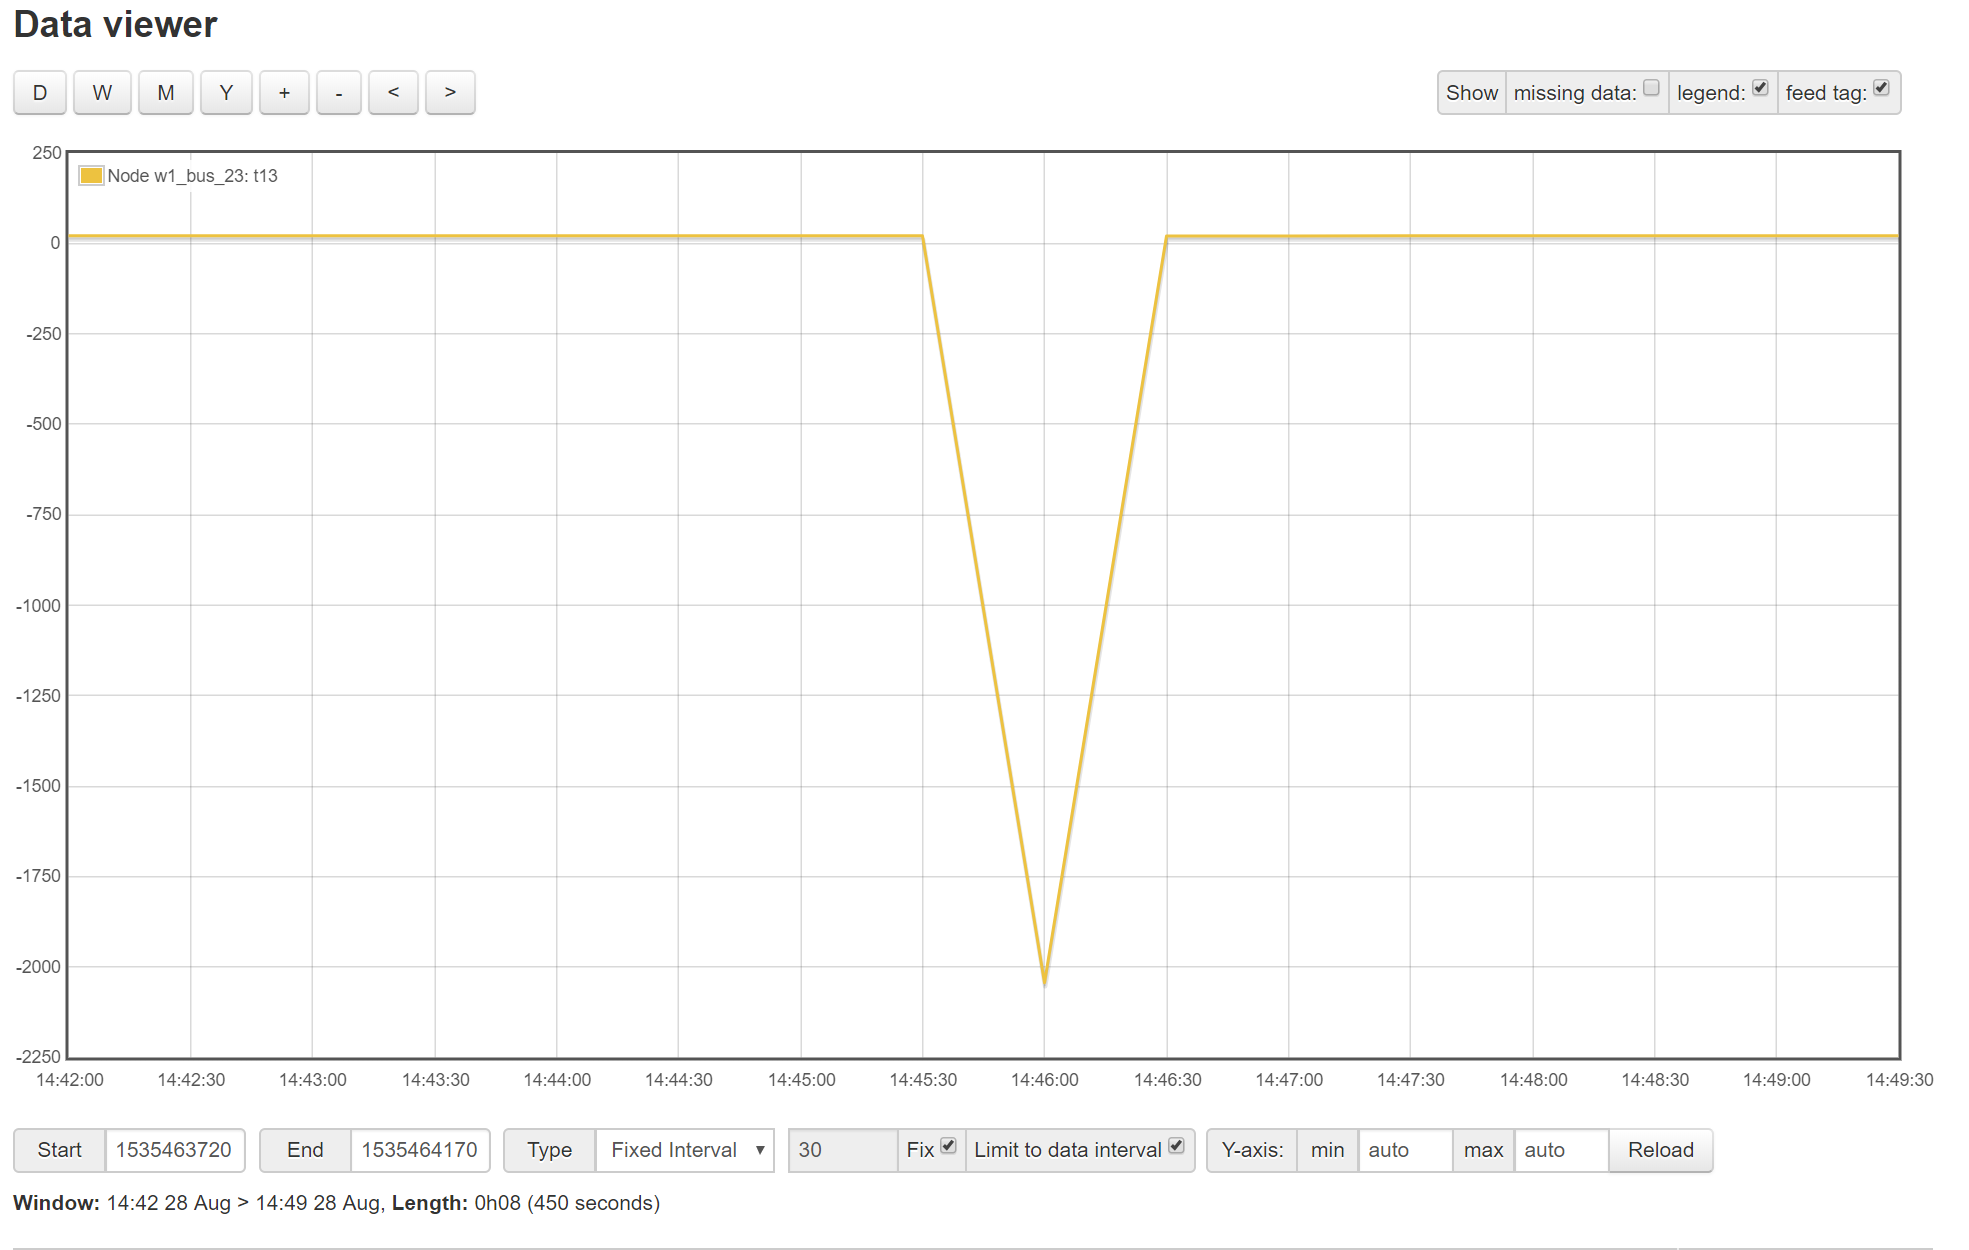
the timestamp and the value are recorded and reported exactly as posted from the csv above.
1535463720, 21.000
1535463750, 21.000
1535463780, 20.937
1535463810, 20.937
1535463840, 20.937
1535463870, 20.937
1535463900, 20.937
1535463930, 20.937
1535463960, -2043.125
1535463990, 20.875
1535464020, 20.875
1535464050, 20.937
1535464080, 20.937
1535464110, 20.937
1535464140, 20.937
1535464170, 20.937
1535464200, 20.875
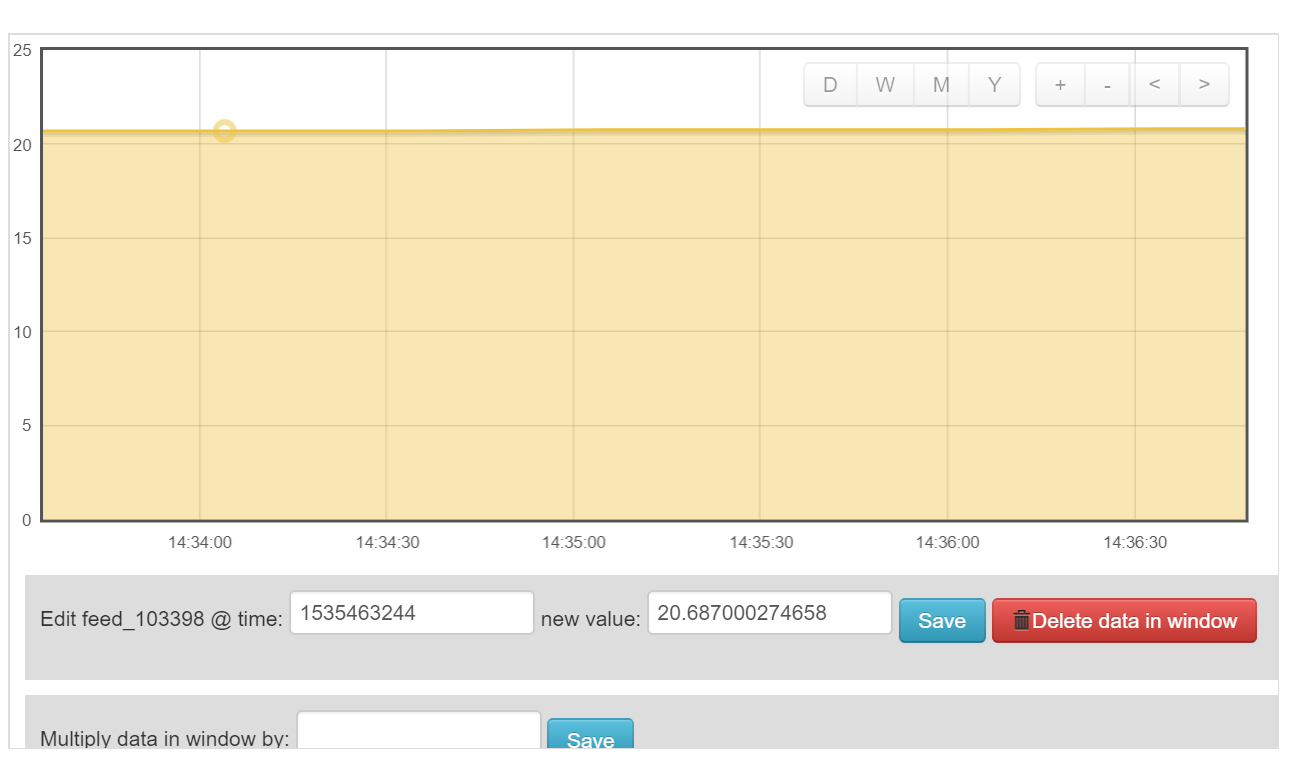
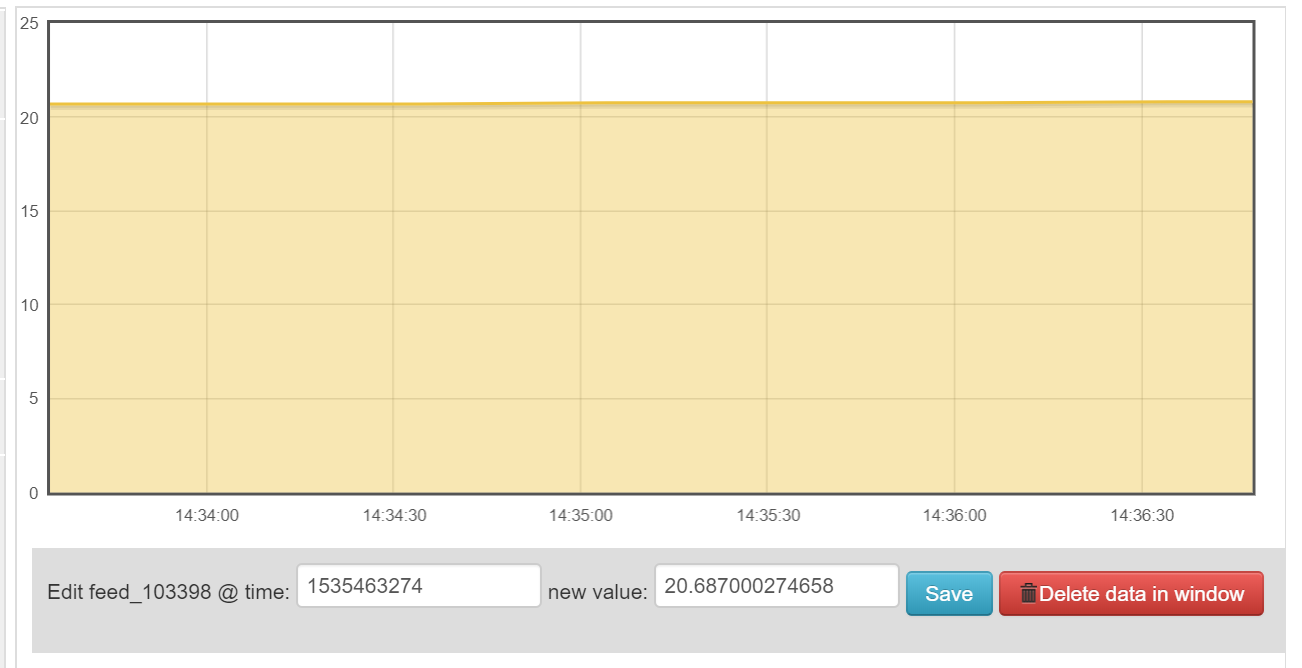
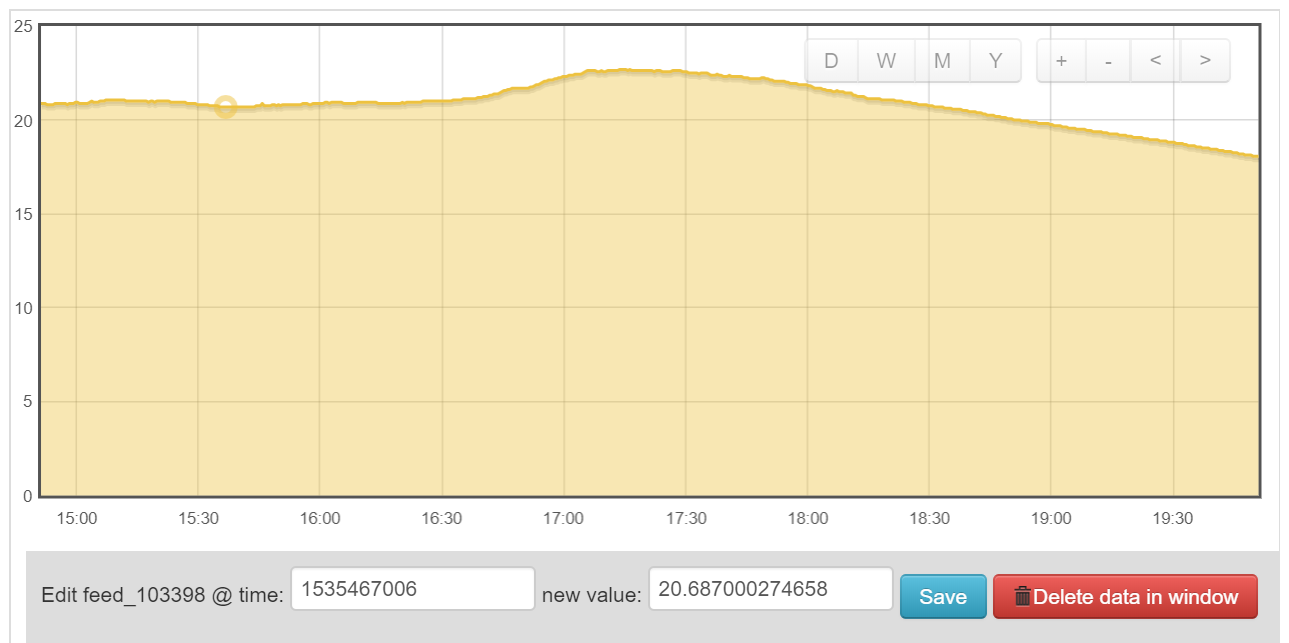
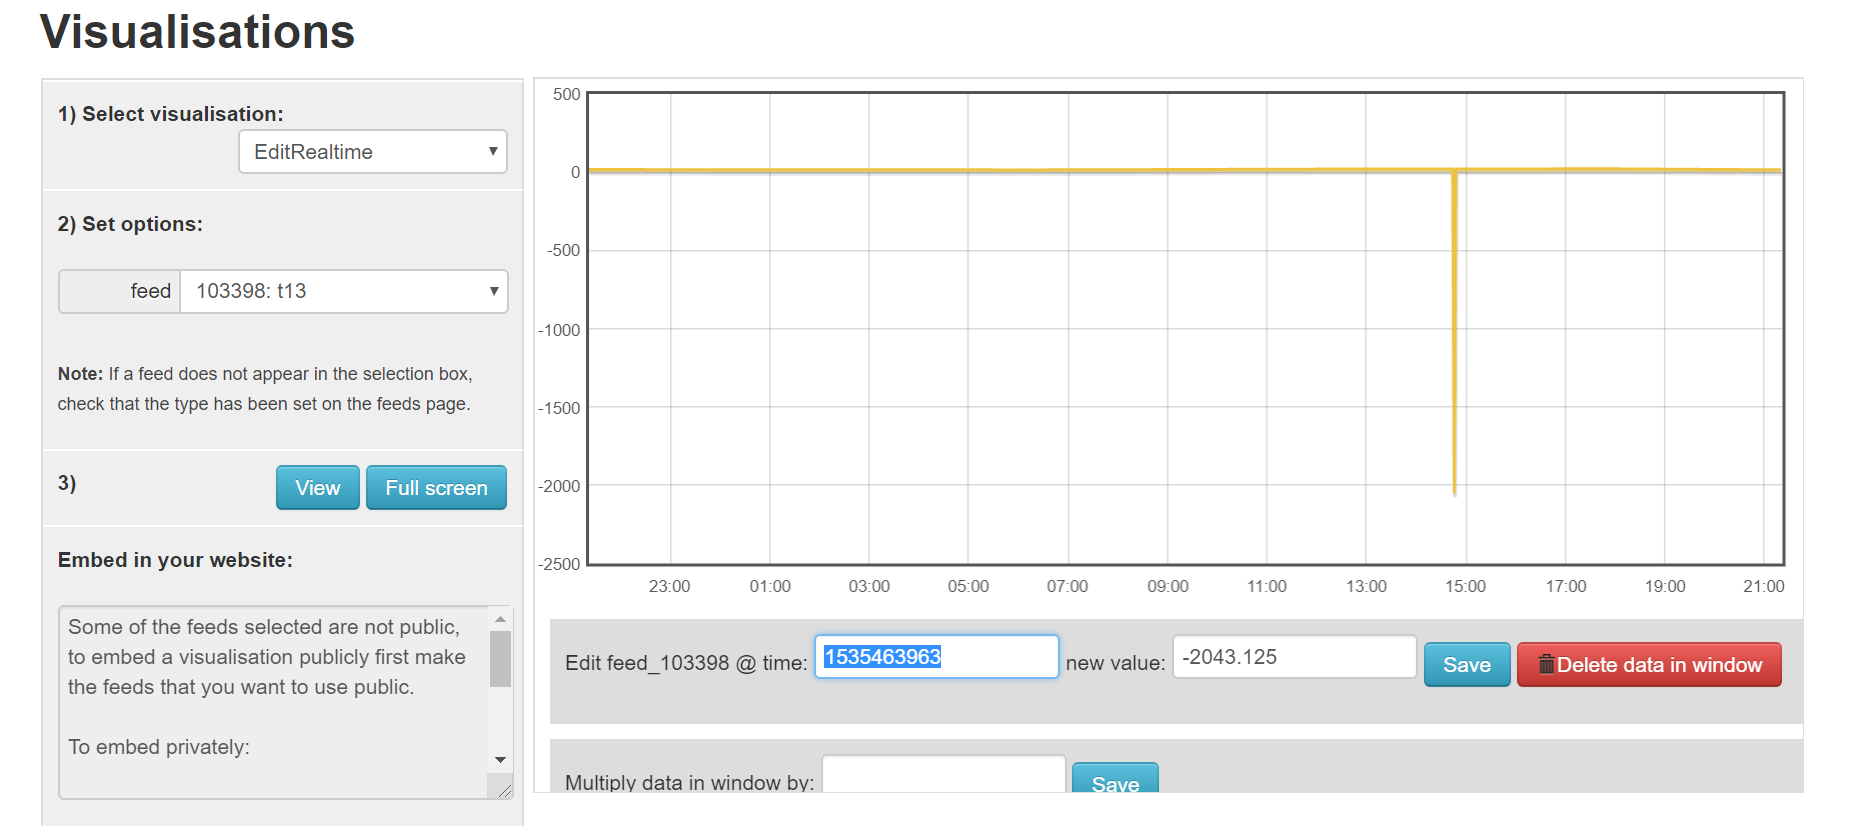
When I went to vis/editrealtimedata and searched for that timestamp I was surprised it wasn’t found, but I picked out the obvious spike from the graph and it apparently had a timestamp that was 3 seconds later at 1535463963 not 1535463960 as expected.
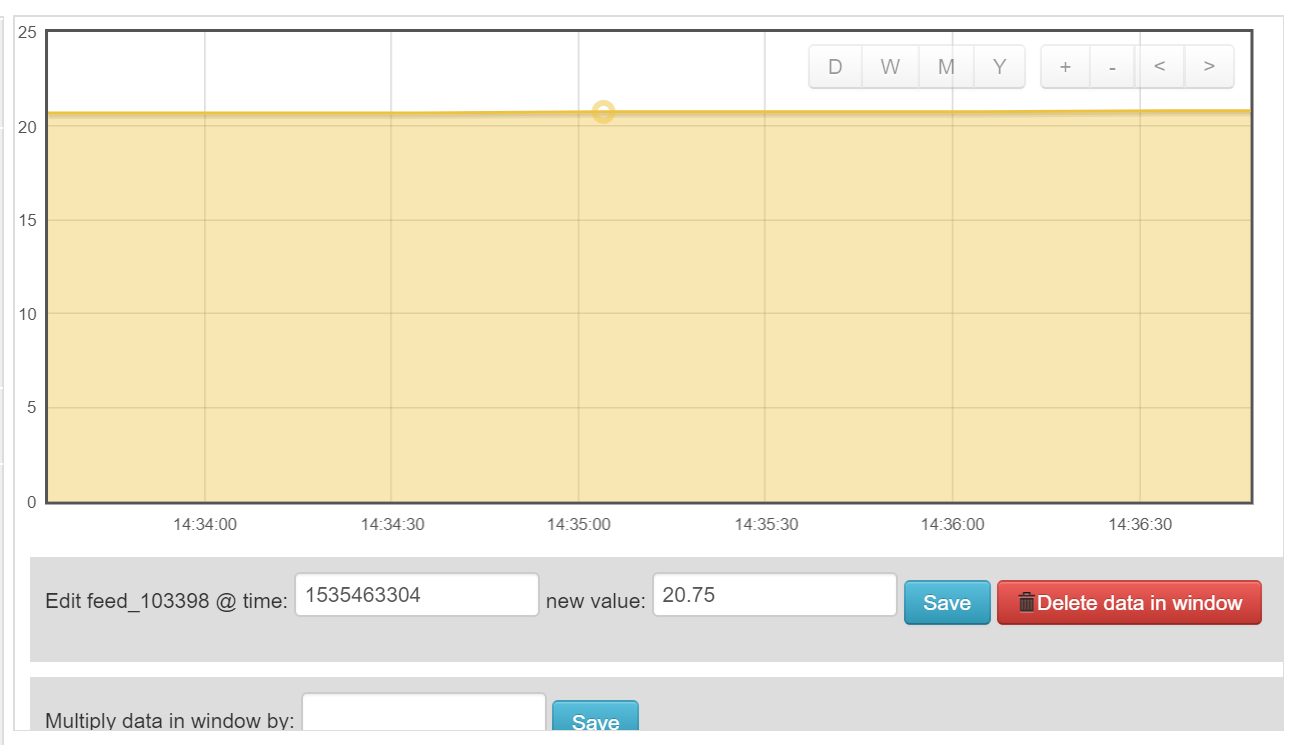
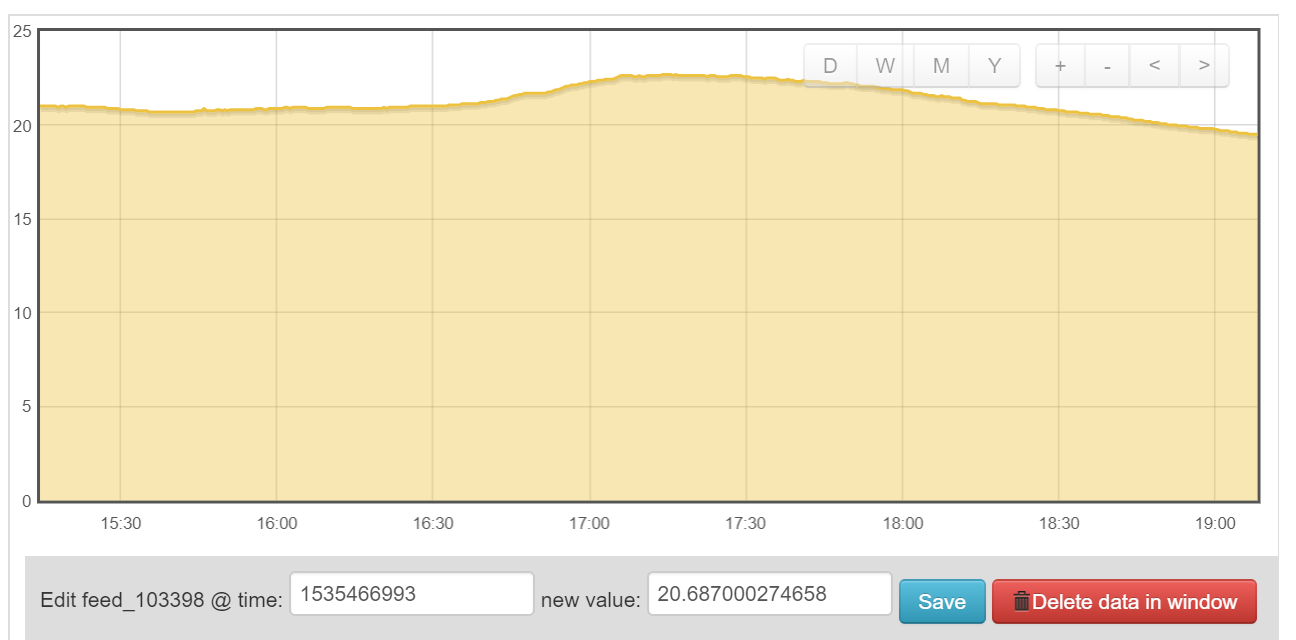
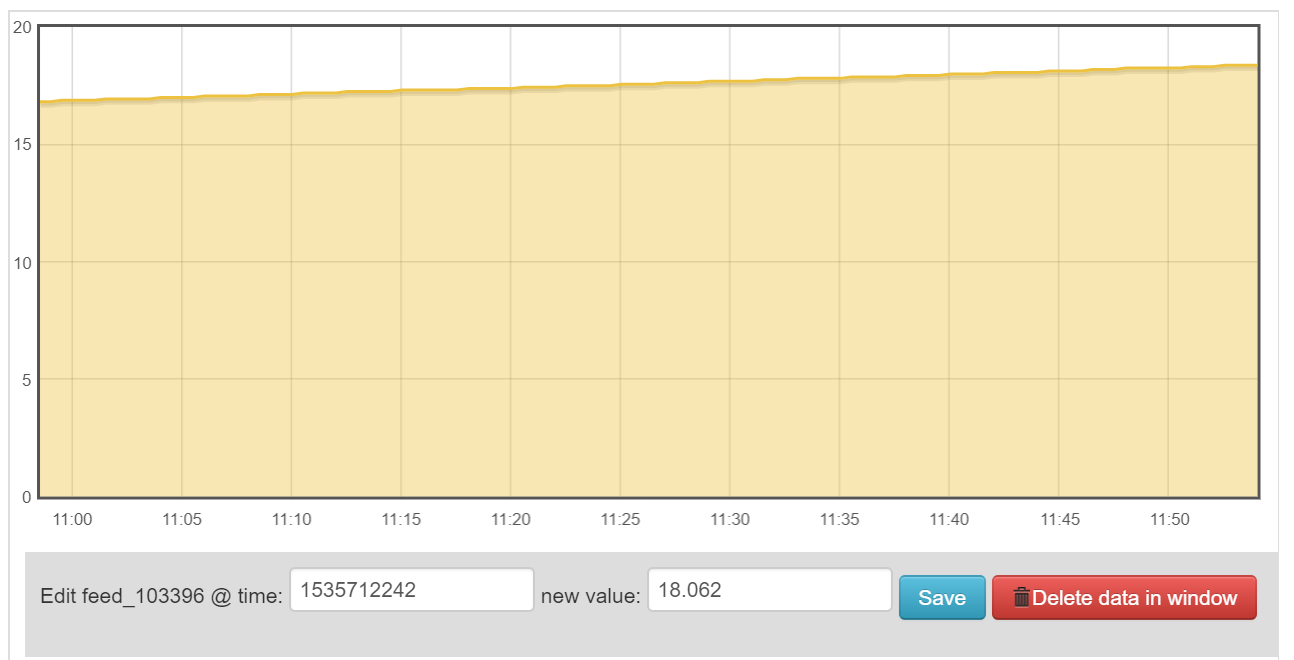
once I had the spike selected it corrected without a problem
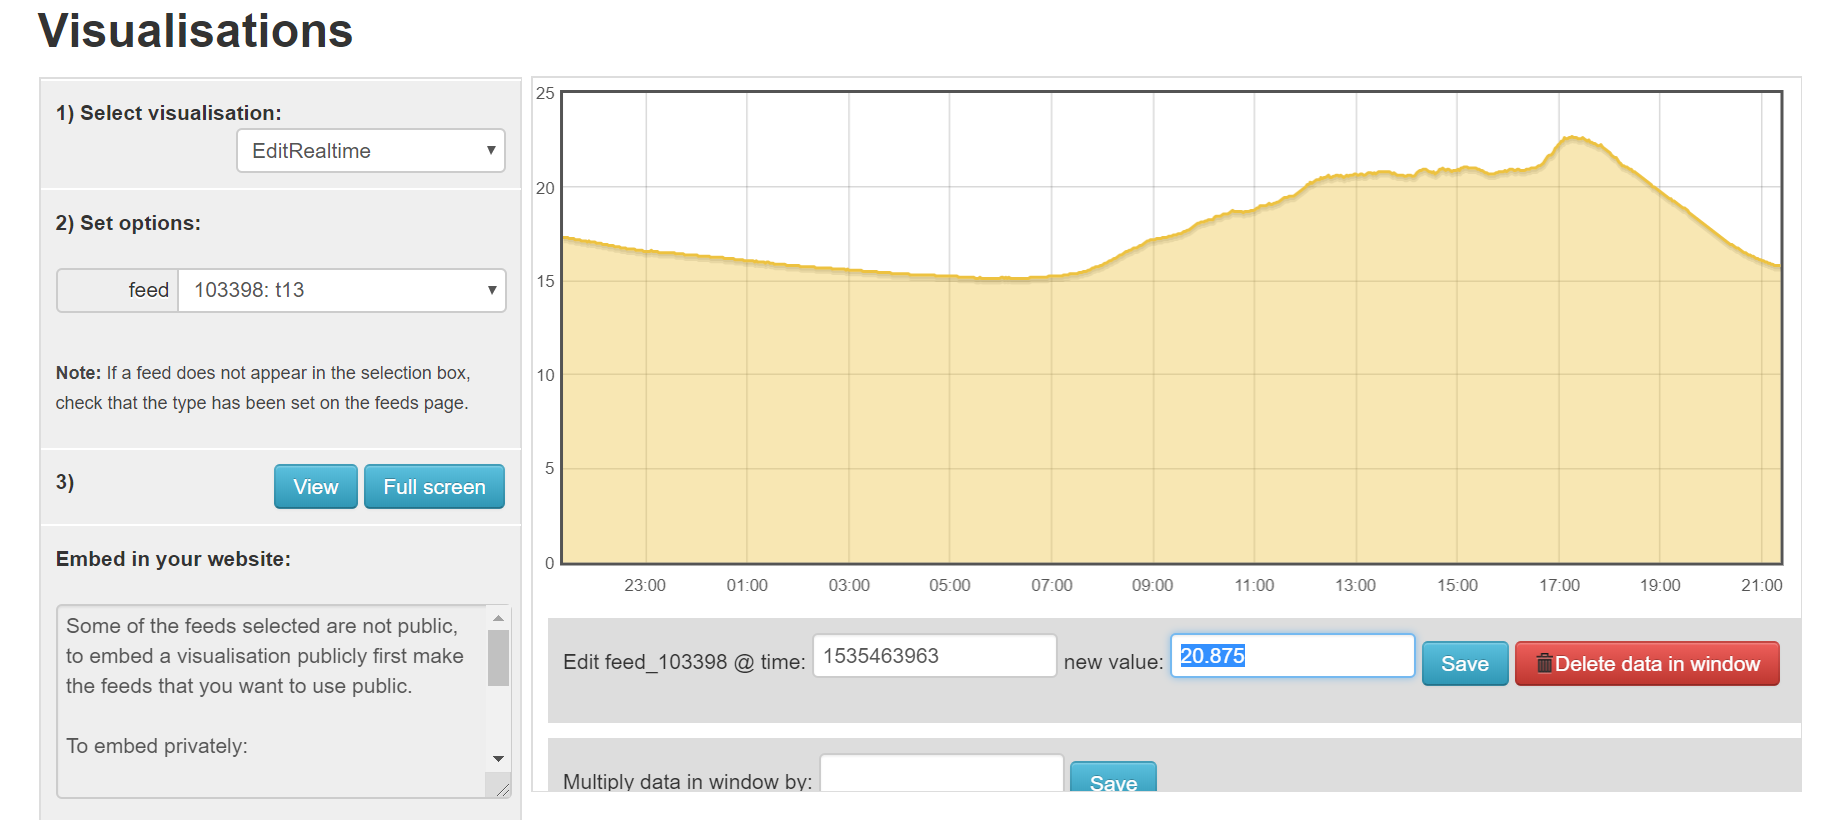
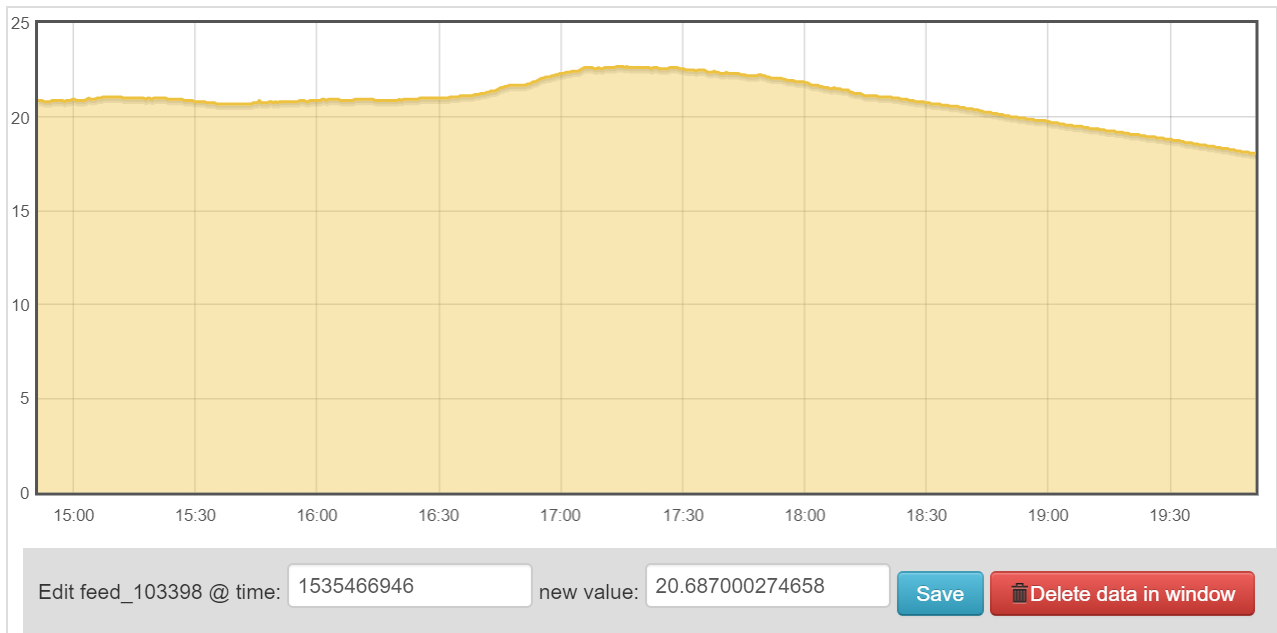
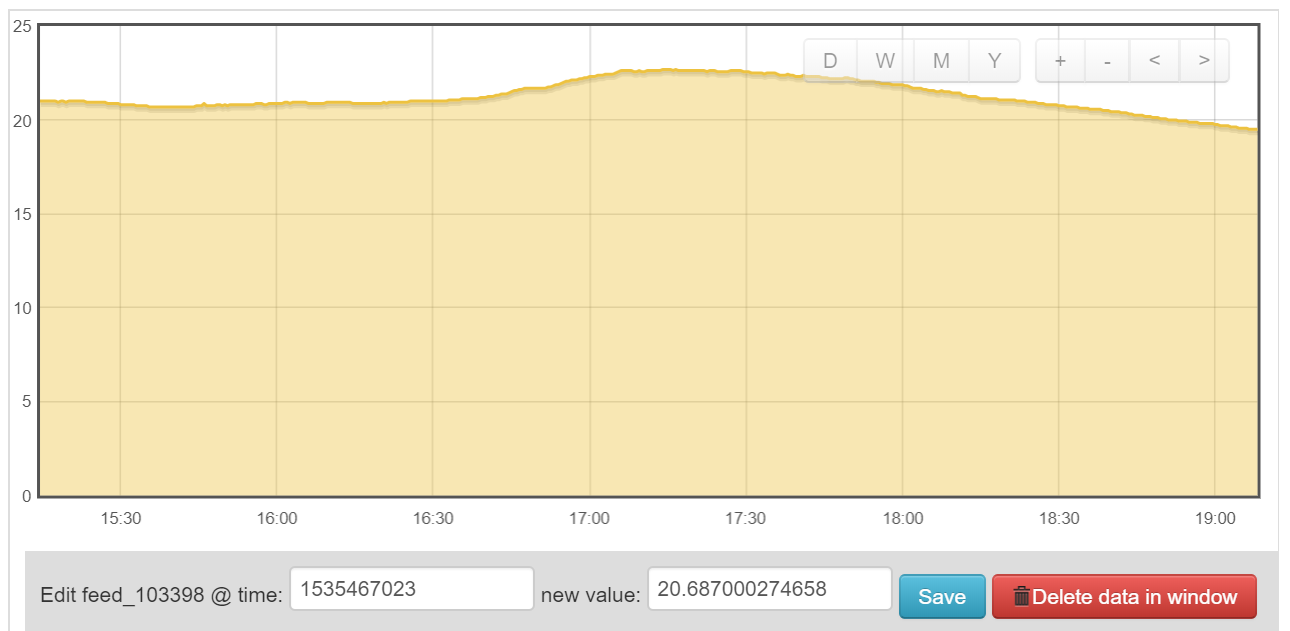
here’s the graph reloaded (still open in another tab, nothing changed just clicked “reload”)
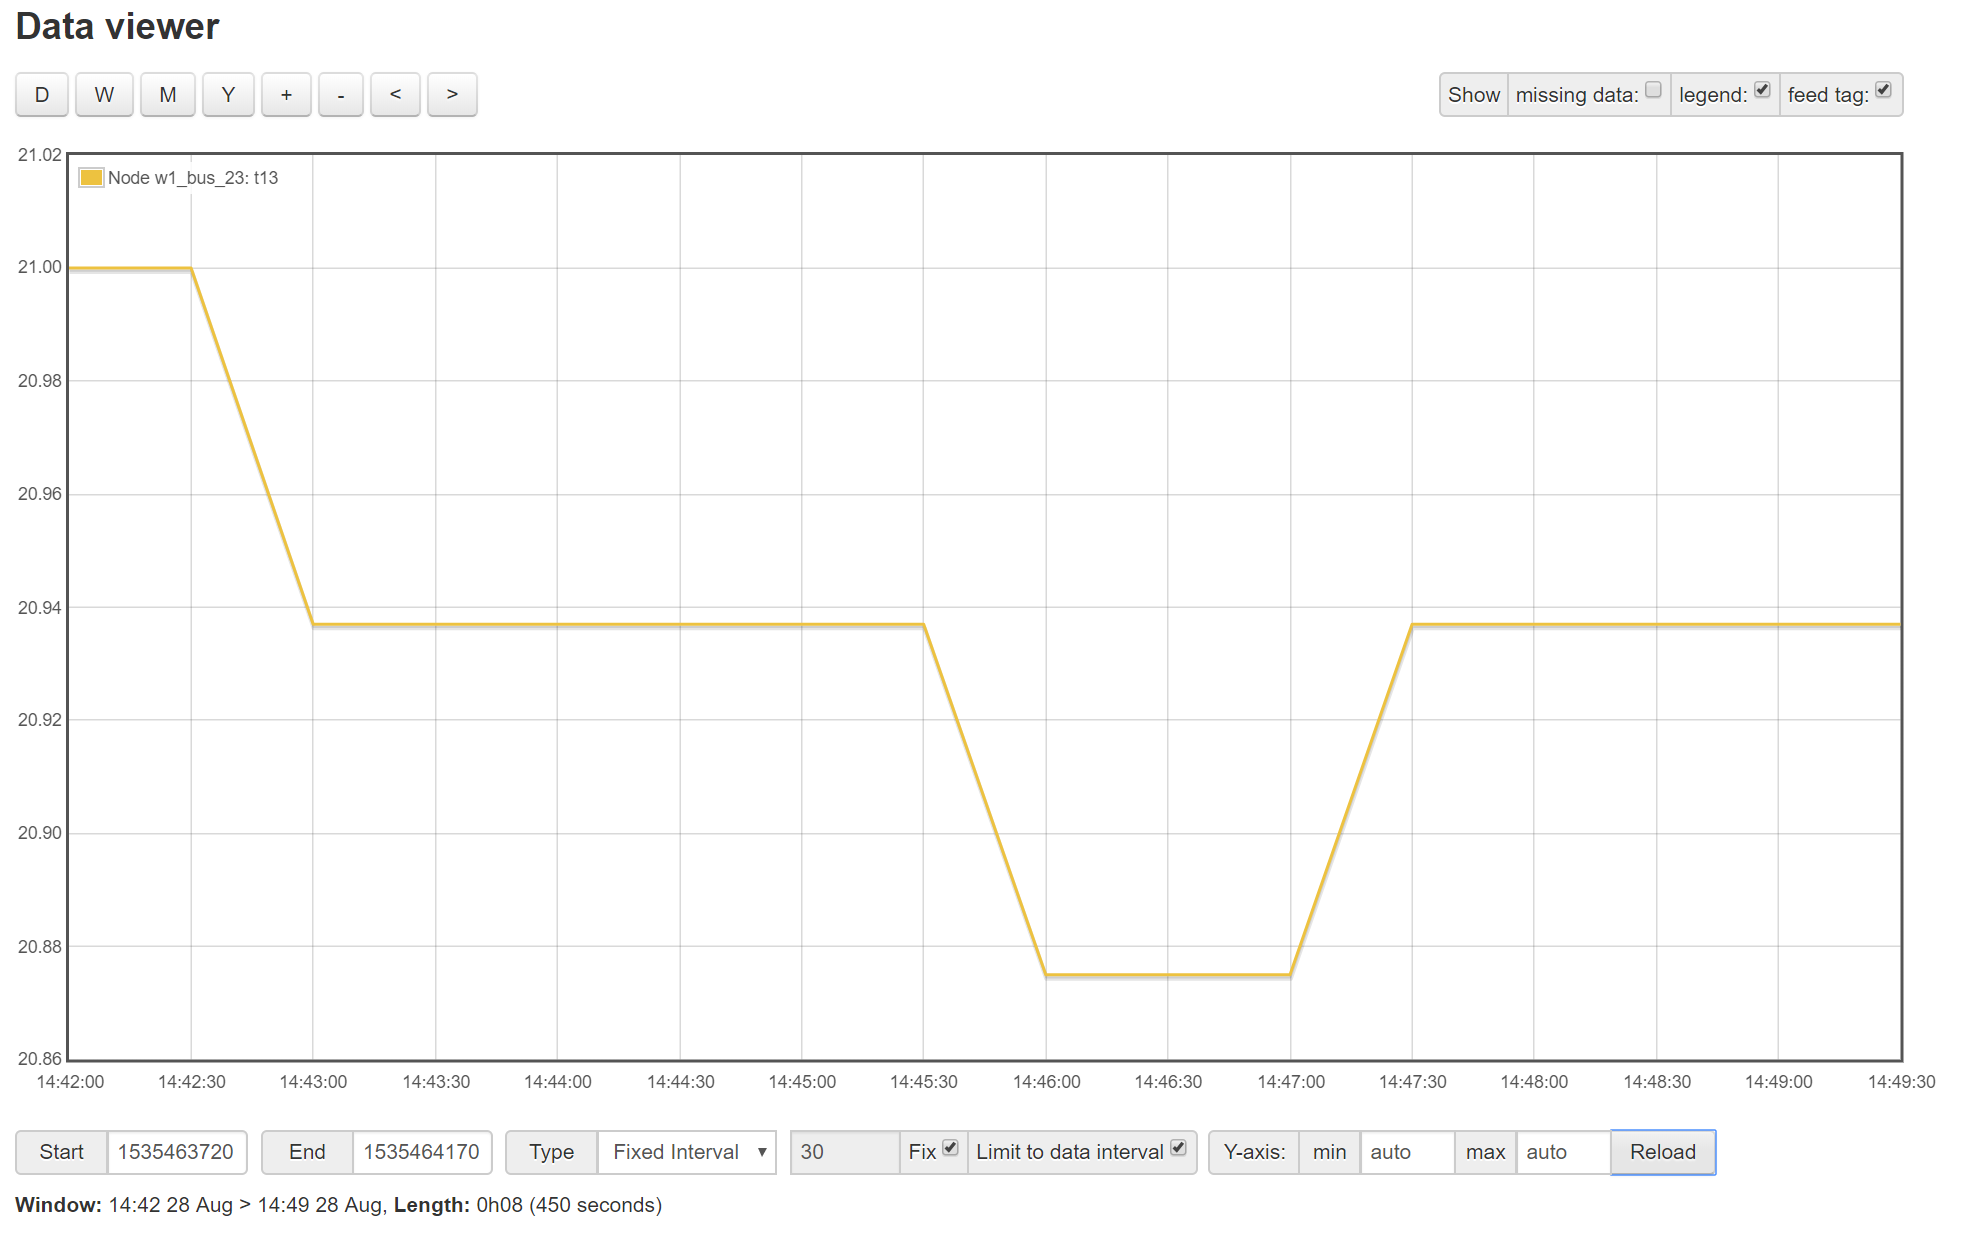
and the csv also confirms the spike has gone.
1535463720, 21.000
1535463750, 21.000
1535463780, 20.937
1535463810, 20.937
1535463840, 20.937
1535463870, 20.937
1535463900, 20.937
1535463930, 20.937
1535463960, 20.875
1535463990, 20.875
1535464020, 20.875
1535464050, 20.937
1535464080, 20.937
1535464110, 20.937
1535464140, 20.937
1535464170, 20.937
1535464200, 20.875
This only really stood out because I know all my posted timestamps are exact multiples of 30 and I use the “time=0” arg with the bulk upload and all the feed start times (30s phpfina) are an exact multiple of 30 too (therefore every recorded data point is too), so I know the 1535463963 datapoint doesn’t exist.
Where did those 3 seconds come from???
Is this possibly why when ever I try to correct a particular data point it fails (because the datapoint with the selected timestamp doesn’t actually exist to edit)???
Right now I’m more interested in finding what caused that freak temp reading, but I thought I would post all this here as it may help debug or improve the editrealtimedata functionality.
[EDIT] Issue raised at An anomoly with editrealtimedata timestamps · Issue #1006 · emoncms/emoncms · GitHub