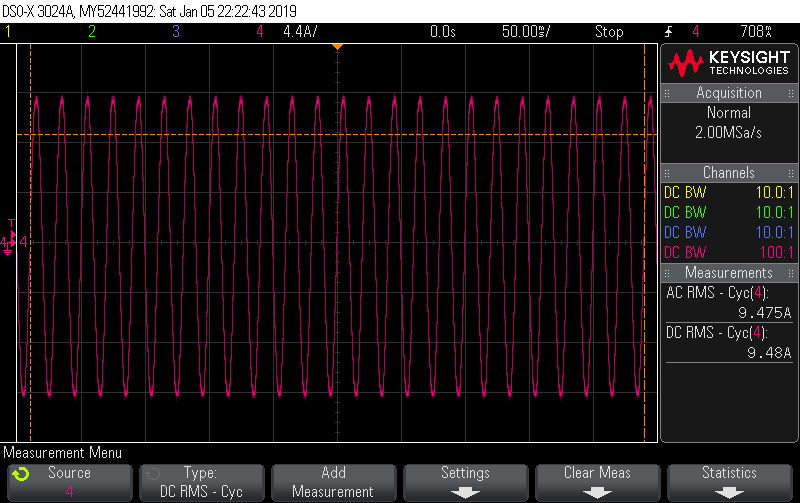
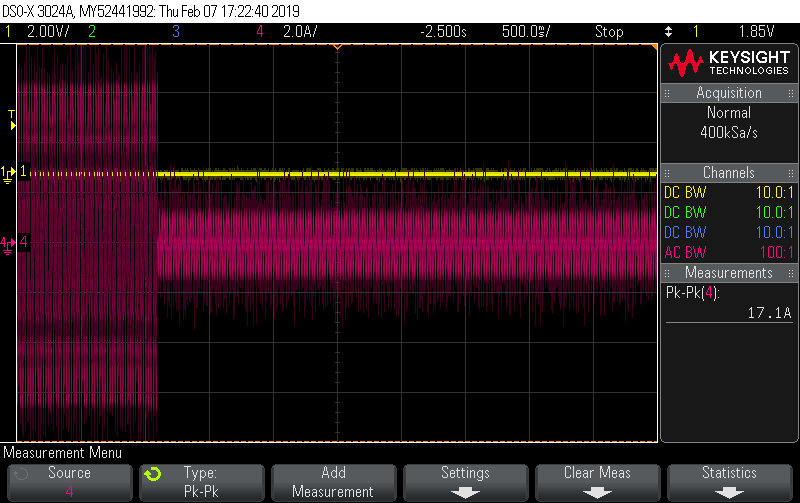
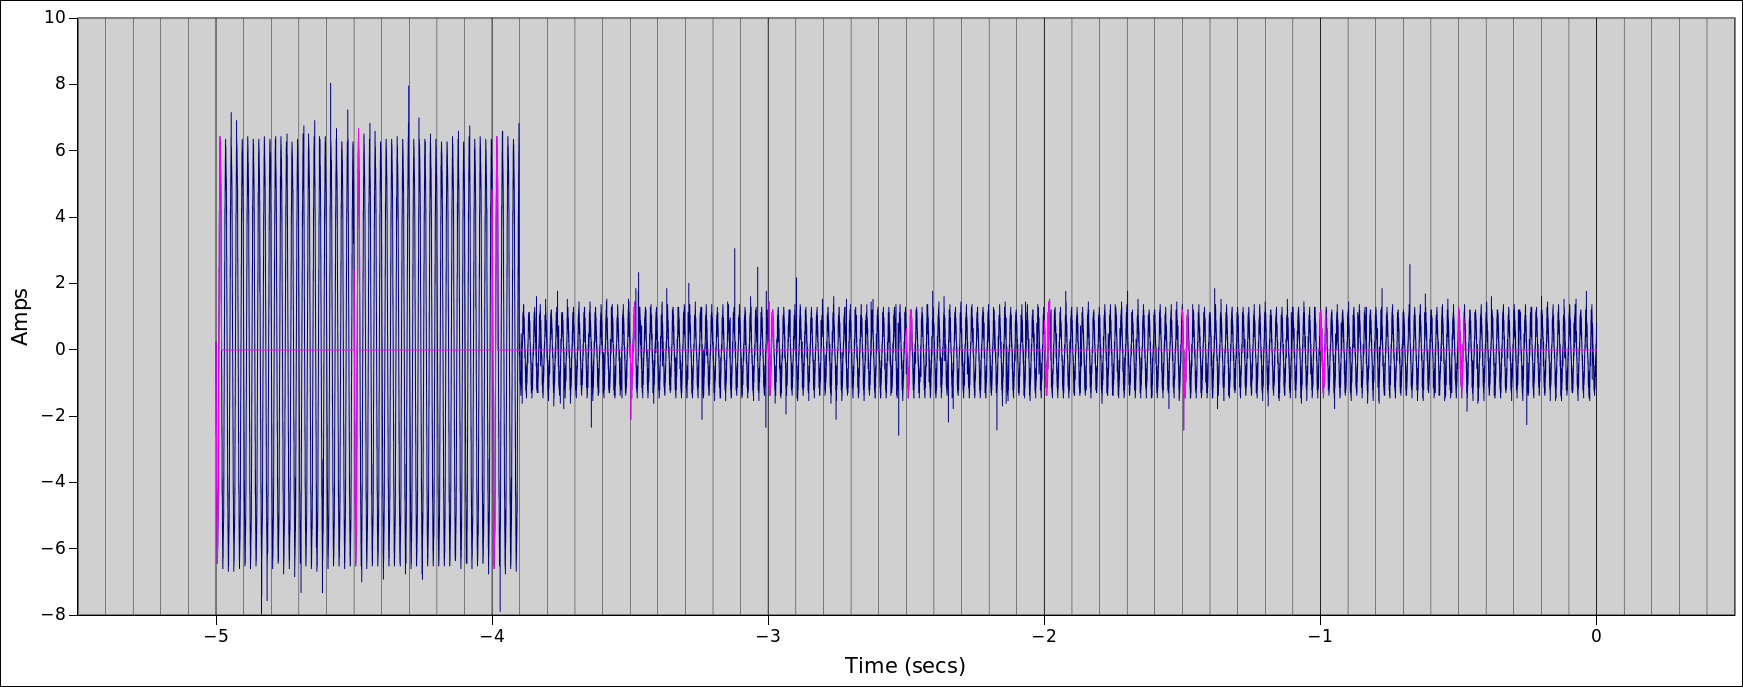
I got a chance to put a scope current probe on a 2200W induction hob recently to see for myself why it’s often quoted as an example of a load where true continuous sampling is required for decent accuracy. You can see just how much the current draw changes from cycle to cycle here:
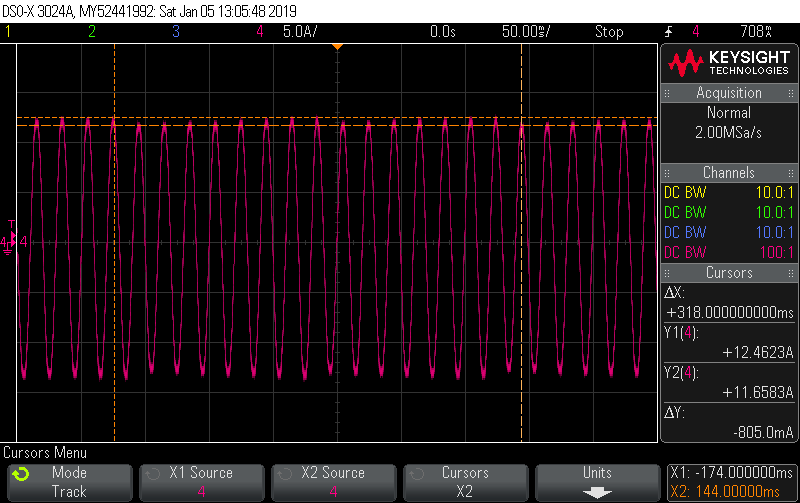
There’s close to 7% variation in cycles in this snapshot of 25 cycles, with the lowest having a peak of 11.658A and the highest a peak of 12.462A. If you’re doing true continuous sampling then this is a pretty unremarkable load to measure; it has very little distortion and almost no phase shift giving it a unity PF to two decimal places. It’s as easy to measure as a 2200W resistive load.
If on the other hand you’re doing “round robin” sampling, whereby you intensively sample one channel for 2 or 3 cycles, and then assume the signal is the same for the next half-second or so as you sample the remaining channels, you run the risk of some significant errors creeping in, all depending on the luck of which 2 or 3 cycles you picked up. And in this case it’s a significant load, the old motto of “big loads are easy to measure” doesn’t always apply if you’re not doing true continuous sampling.
In an ideal world you’d have a dedicated ADC for each channel, and that’s how the pro energy ICs work. If that’s out of reach then a close second is to step through the channels on each sample. Provided your sampling rate is fast enough for the job at hand, you’ll still get enough bandwidth out of each channel and you won’t have any half-second deaf periods where you’re not looking at the signal at all. I believe that’s how Emontx3-continuous and the new EmonLibCM V2 both work, and it’s also how the stm32 example code works. I think that’s a step in the right direction for improved accuracy.
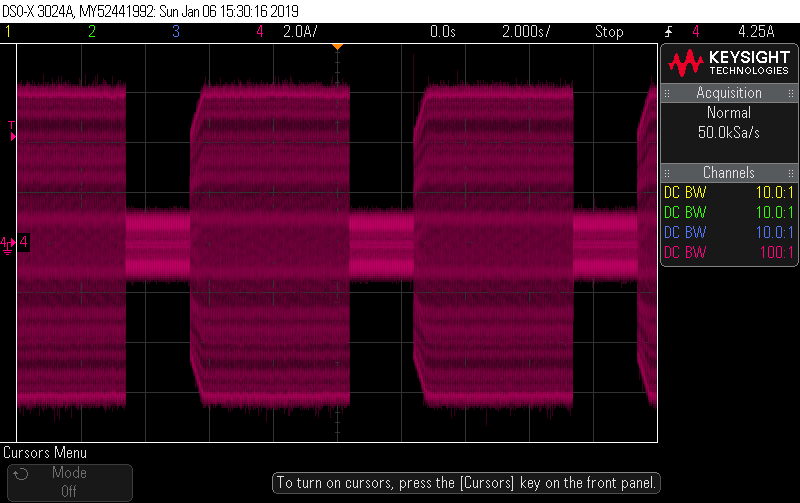
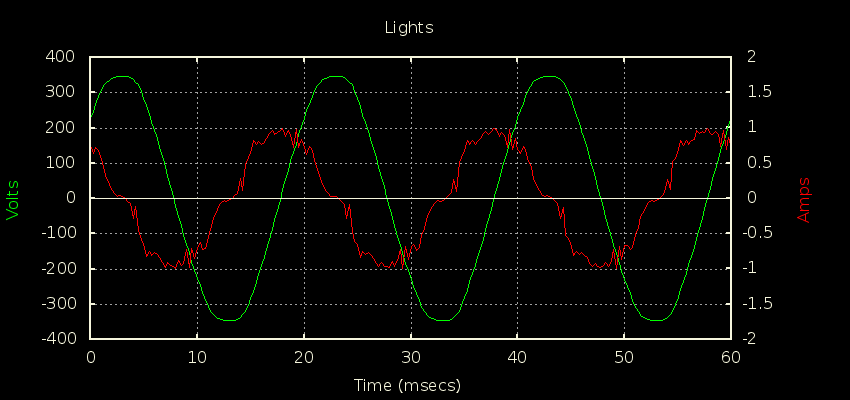
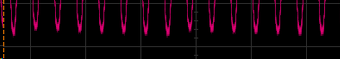
By comparison, here’s the same set up as above but measuring a simple electric kettle of roughly the same wattage. In this case you can see each cycle is pretty much an exact replica of the cycle before it, so the assumption that the signal will be the same for the next half-second or so is a fairly safe one, regardless of which 2 or 3 cycles you measured.