Hello @overeasy, Id like to clarify that the reason your original post was removed was that it contained unhelpful ad hominem attacks, a constructive discussion on here about the relative merits of different approaches to measurement is fine, but making comments such “these guys make a lot of arguments with oscilloscope traces and convoluted analysis” are unhelpful.
Thanks Trystan. I guess it would only be helpful if it caused
them to stop doing it. Which doesn’t seem to be the case.
Thanks @overeasy. I think your misunderstanding @dBC and @Robert.Wall’s intention. The discussion, from my understanding is intended to be a technical discussion on sampling techniques not an attempt to pick holes in specific hardware. I really hope we can all do our best to de-escale any argument here, keep things to the technical discussion.
Well Trystan, you see what you want to see. Where else have I seen that 25 samples per sample number…
I am almost sorry that I restarted this discussion with comments I made on another thread. I vaguely remember it when it first started, but I can that there are still some very heated feelings on this an both/all sides of the argument.
My take is that @overeasy believes and has generally documented that his approach is generally within 1% of a revenue grade meter for normal household loads over some period of time. I generally believe this to be true.
The other side I have heard is that for some loads there can be an error that is greater than 1% possibly as high as 17% for some very small period of time. I also believe this to be true for certain specific cases.
So, could it be possible that both of these are true? Absolutely.
As others have said, engineering is always about making tradeoffs. Over a year ago, I looked at the options. I chose the IoTaWatt and few months ago I bought a second one. I did this because it provides a good easy to use solution to my problem at a reasonable price. Would I have preferred a solution that used dedicated energy measurement ICs that continuously sample every channel all the time? Yes, but such a system does not exist off-the shelf.
Perfect (in the future) is the enemy of good enough.
Plus, the sampling method is just one (important, yes) part of a product. I believe @overeasy chose this method to allow easily compensating for differences in the phase response of different CTs and VTs. This choice leads to much easier usage with different CTs on different channels, which is a huge win in usability.
I am not sure how much value this “technical” discussion has. Most people have already made up their minds and are unlikely to change them based on anything that is said here. Increasing the accuracy of the ADC measurements isn’t going to improve the overall accuracy unless you also have excellent accuracy and calibration of all the sensors.
But, it all comes down to what decisions are you going to make with the data you get and how does ANY inaccuracy in the data impact those decisions?
Many people say they want perfectly accurate, but few are willing to pay for what it takes to even come close to that.
This forum is as at least as much for designers as it is for buyers, and this topic is certainly aimed at the designers not the buyers. I wouldn’t expect your average buyer to have any idea what this thread is about.
I know almost nothing about IotaWatt and its accuracy, others are way more qualified to speak on that topic than I am.
Now, back to my Ch1 / Ch2 experiment above, and your comments about accuracy claims. I agree, accuracy specs should and often do come with footnotes, a very common one you’ll find on meters is something like “1% accuracy at PF > 0.5”. That’s something a user can work with.
Now, if I were tasked with putting an accuracy spec on my two channels above…
Ch1 - I’d probably be comfortable claiming 1%, subject to a lot more testing first
Ch2 - where to begin?
I know I’d have to say at least +/- 32% because I’ve seen it spit out 287.9W when the correct answer was 217.29W. It’s entirely irrelevant how often it’s wrong by 32%. Error specs are all about worst case unless as you say, the worst cases are exempted by footnote. All the end user gets to see is 287.9W and they want to know how close to reality that is. They’re not going to be considering whether or not it’s their lucky day.
Now I could say something like +/- 5% provided the load is constant for > 30 seconds. Personally, I’ve never seen a footnote like that on a meter. If I need to average 6 consecutive readings to get to my 5% I’d be better off doing that averaging internally and just spitting out the result every 30 seconds. What’s the point of me spitting out 287.87W? What use is it to anyone if they need to wait for surrounding readings and do their own averaging before they can use it with confidence?
Even then, I’m basing all my worst case estimates on one particular load I managed to get my hands on. Who knows what other loads out there interact with my 1-in-25 cycle choice even worse. The easiest way to have confidence in my accuracy specs is to determine the accuracy for a single cycle, and then measure every cycle. Ch1 is measuring the signal, Ch2 is estimating it.
That was by design (of the experiment). I wanted to see the data that caused Ch2 to get the answer so wrong.
I’m not sure what you’re referring to there. The period of the full thermostat cycle is 7 seconds (you can see it in a pic much earlier in this thread).
This is reminding me of amplifier power ratings of the 70’s before the FTC clamped down on them. Many amplifiers can deliver an unbelievable amount of power, at an equally unlistenable level of distortion, for an equally unbelievably short period of time before they destroy themselves. The FTC put out rules for how this should be tested, which brought power levels down to where they were actually useful for comparison. Perhaps we need something like that for this discussion?
I can relate to that, when trying to calibrate an emonTx using my mains supply that bounces around all over the place. The only realistic way to get close is to set it to measure and display the value as nearly as possible at the same rate as the reference digital multimeter updates its display.
Yes, one of the biggest advantages of a signal generator or calibrator is that you know you’re going to get the same signal, cycle after cycle, day after day. Although in this case, such a rig would have given me a very false sense of security about the accuracy of my Ch2.
Unless of course it was the programmable kind and you wanted a repeatable emulation of your hob. Then a trace of the elusive 40% error would have been easy.
1 Like
So I went back and read the original post. While it is true that it does not mention Iotawatt, and maybe it was not meant to imply that Iotawatt is doing it wrong, I can see that many people, not just Bob, would infer that.
Yes, loads can display complex signatures. Yes every measurement system has inaccuracies, some might even be large. If the point of this thread is that continuously measuring all channels all the time gives you a better answer, I’m pretty sure we would all agree. Back when I was in Test & Measurement and working for Hewlett-Packard, we used to always talk about the $100 measurement, ie you have $100 to spend on making the measurement, how do you allocate the money. Do you spend $95 on the ADC and $2.50 on the VT and $2.50 on the CT, leaving nothing for anything else?
I don’t believe anyone here is making a revenue grade meter. If you are, you know there are several choices for energy measurement ICs that make the job easy. Some are very inexpensive at $1/channel. I don’t know no one is talking about them. They are way better than any of the other devices mentioned here. But, they are just parts not a complete solution.
I have been in T&M for a long time and while it is interesting to have these technical discussions on the merits of particular techniques and I believe we can all learn from each other, I am not quite sure I understand the point that people are trying to make here.
I get some people think it is not worth measuring if it isn’t continuously. That is an opinion (which might be true for a particular person) not a fact for every person. Any measurement is a representation of “reality”. For a “good” measurement the representation is “close” enough to reality to be useful. How to define good and close is left as an exercise to the reader 
This discussion seems to be: for some loads discontinuous measurements will provide an inaccuracte representation of reality. I think there would also be a general agreement that is true. I believe the difference of opinion is in how applicable/likely these loads are in time and the universe of likely measurements, and what decisions will be impacted by the results of the measurements.
Of course, this is the beauty of having choice. If you don’t think something is accurate enough for your needs, get something else that is.
Good points @Frogmore42. I agree generally in terms of discreet vs continuous approaches that errors in individual readings will likely converge to a smaller error over longer time scales with normal household loads. My reading of the above is that we are all in agreement on these points.
Ideally yes adhering to a specific standard for measurement accuracy is the direction and goal we hope to achieve with OpenEnergyMonitor hardware going forward and @dBC and @Robert.Wall are helping to clarify what this would entail. We need to really understand the implications of measurement approach, load types (edge cases or otherwise) on final accuracy. There are many details there that I did not originally appreciate.
I think as we move to continuous sampling firmware as standard on the EmonTx and future STM32 hardware this component becomes less important. There is still value in understanding the implications for applications such as EmonTx battery powered applications where the discreet sampling approach is needed to save power, but this source of error will become less of a factor for most users.
I guess a key challenge with identifying the accuracy claimable with a discreet sampling approach is that its going to rely on some pretty complex statistical analysis?
We need to have a statistical model for the distribution of household loads and an understanding of how error in individual readings converge over time.
I think its clear that the error in any given reading can be significant e.g a potential double digit error in a 10s period. Can we assess the potential error over: 5mins, 30mins, 1h, day, week, year?
Perhaps that is what we need for the discreet sampling approach, we all want high frequency (10s) updates on power readings and perhaps we accept that those readings may have a large error in them, whereas for the more important energy use trends there will be convergence and the error will be much less, can we get an indication of what that would be? Assuming a degree of drift in the position of the discreet measurement vs any short periodic variation in the current and voltage waveforms being sampled.
Amen to that! I feel like my work here is done… although I suspect I was always preaching to the converted in any case. Yes, with the exception of the battery operated stuff, there doesn’t seem to be any downside.
I’m more a measurement kinda’ guy, so I’ll leave the stats analysis to others. But if it helps anyone, I’m happy to capture and upload a csv file from the scope that captures a full hob thermostat cycle. At 10 seconds wide (to capture the full 7 seconds) the resolution won’t be great but it might give you something to experiment with. Obviously it’s just one specimen so caution would be required.
In case anyone is confused, I think Trystan means “discrete” (meaning separate and distinct), and not “discreet” (confidential or concealed).
1 Like
I agree that this is no longer productive. So since it’s time for closing arguments:
I believe the title of this post, by using the word importance, implies a superiority that hasn’t been proven. I have not argued that the CM technique is inferior, only that the “discrete” method implied as used in IoTaWatt is not inferior. I believe those were nearly my exact words in the deleted post. I also stated way back then that I though it was implementation specific, and that relatively slow devices may indeed be inferior.
The initial example is probably more typical of an induction cooker and the statistical handling of that relatively steady state mode is unremarkable. This thread pivoted to the very low power mode where it appears the cooker needs to revert to PWM in order to reduce further. To have a discussion that purports to examine the relative differences of two technologies using such an example is, IMO, hyperbolic.
In asserting a seven second cycle, reference was made to an earlier trace. That trace appears to be another PWM trace but at a higher power where the Highs are dominant. It’s interesting that was not explored further, because the extremes would not be as remarkable as the last example.
Finally, this discussion has much broader implications. The “discrete sampling” (DS) as compared to “continuous sampling” (CS) was shown to produce clear differences in five second measurements.
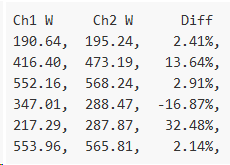
The author says that these wildly varying 5 second numbers do converge to within 4% over 30 seconds. But what I’d like to point out is that both sets of measurements vary wildly within their own sets. The CS from 190-553, and the DS from 195-568. In fact, they both vary over a range of nearly ±100% from their averages.
I have to ask what is the value of these 5 second measurements individually?
So that brings me to the broader implication. In this forum, the most probable destination for these numbers is Emoncms, where they will be uploaded and stored in a power feed. The way Emoncms works, if you plot the power usage of that appliance for a day, you will get a plot of discrete 10 second samples, taken every 120 seconds. You can ask for them to be averaged, but who does that?
With that in mind, the values shown on an Emoncms plot of power sourced from an unaveraged CS device, will look for all the world just like those from an unaveraged DS device. If you were to look at the power integrated in Wh from that data, you would get exactly the same kinds of errors that are being attributed to the DS method here. Don’t be alarmed, my statistical argument says the result will still be accurate. In fact, Emoncms has been relying on this, perhaps unwittingly, for years. You can drill down to 5 second intervals, and they will still look pretty much the same. I’ll concede that in theory you can take comfort in knowing that the wildly varying intervals of CS are correct, while the DS numbers are only accurate in the broader context of a longer interval.
If you want to smooth it out and turn on averaging, both methods will behave much better, and I still maintain that over a 120 second average interval, they will be indistinguishable. So we go back and forth from CS to DS as the data moves up the pipe. I will put in a plug for IoTaWatt here to say that it is consistent at using DS with averaging from cradle to grave - averaging is automatic as an attribute of how the data is stored, and that daily plot will always represent the 120 second average.
I know you consider that cherry-picking. I consider it a form of stress testing… testing the corner cases. Error analysis is all about identifying the worst case scenario and testing that. Even in software testing right? A good tester will say… hmmm… I wonder what happens if I pass this function a zero length string. I’m sure you wouldn’t accept “well, you deliberately passed it a zero length string, it would have worked fine if you hadn’t done that” response from the programmer.
I would encourage you to do the same in reverse. Capture a trace from a real load that demonstrates when DM performs better than CM. At least then we’d have something in each hand as we weigh the balance of the virtues of each. At the moment it seems to be all downside in one direction, and all upside in the other. People speak of the “cost” of doing CM. The only cost I can identify is to channel bandwidth (*).
Of course, because that’s what the load is doing. There’d be a big problem if they weren’t.
To an end user trying to monitor their energy usage… absolutely none. To a meter designer trying to accurately track what’s going on… heaps.
When I claim 1% accuracy on anything I design, that means every number it spits out is 1% accurate, all the time. When I discover some corner cases where that can’t be true, I simply footnote them rather than de-rate my entire accuracy claim for something that hardly ever happens (classic example found on meters: 1% accuracy at PF > 0.5).
The stm32 is certainly not slow; we’re busy dividing the ADC clocks down to hold it back. But even there there’s no doubt in my mind that CM is better than DM as demonstrated in my Ch1 / Ch2 experiments above. One accurately measures what the load did over the last 5 seconds the other doesn’t. One requires a bunch of longer term averaging to converge on an accurate result the other doesn’t. One requires a quite complex analysis to write the footnotes, the other has no footnotes. As a designer I know which I’d go with, solely to make my life easier.
(*) battery operated devices excluded.
I rest my case.