Hi all, thanks @TrystanLea for starting the discussion, and thanks @Timbones @Rachel and @johncantor for sharing your thoughts already. There are (obviously) a lot of directions this could go in over time. My initial thought with this was similar to @Timbones’s point on aggregating daily data to understand usage patterns across time and across different users, but I think the leaderboard and linking to the heating system ‘meta data’ are also important aspects.
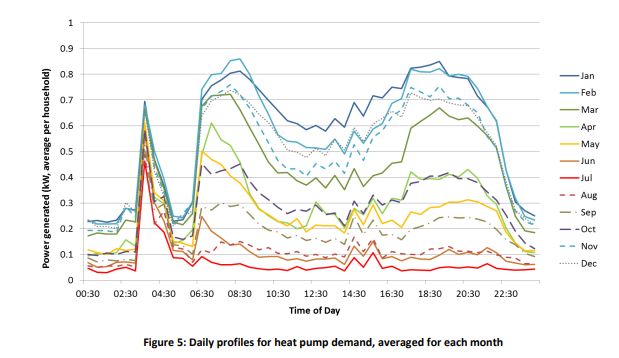
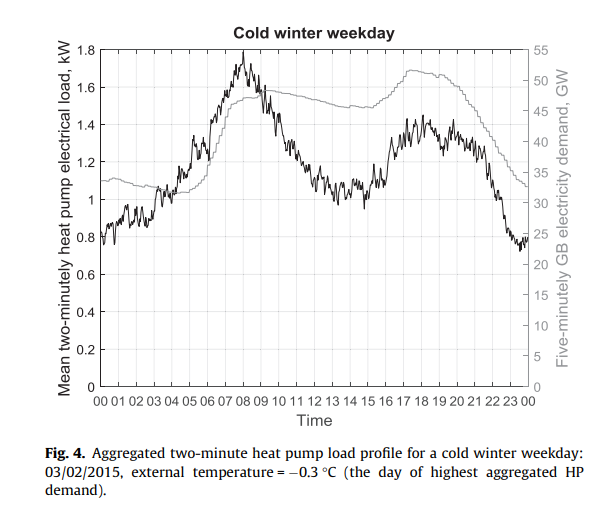
Right now there are a few studies which have used measurements to develop diurnal profiles for heat pumps, but there’s not much/any information behind these about the installation or controls. And these tend to look “peakier” and more “boiler-like” than what I’ve seen from OEM users and others posting about their high-performance installations.
@TrystanLea or @johncantor do you have thoughts on the pictures below based the data you’ve seen through the years? My theory is that high-performance, weather compensated installations might look somewhat different to these.
Screenshots taken from these pdfs:
http://www.networkrevolution.co.uk/wp-content/uploads/2015/01/CLNR-L091-Insight-Report-Domestic-Heat-Pumps.pdf
I can put together a few more thoughts on this later in the week and post for comment. Then maybe the next step is more discussion (or even a brainstorming zoom) on what are the most important aspects to start with / what would be a reasonable “minimum viable product.” Then could plan what makes sense to be within emoncms.org vs potentially on another platform. Happy to hear thoughts on process as well as on the dashboard idea!