SCT013 value consistently too low

I have “ported” (almost nothing to do) EmonLib to Raspberry Pico (RP2040) and integrated in vzlogger (volkszaehler.org) - works nicely generally.
There are two issues remaining related to the measurements:

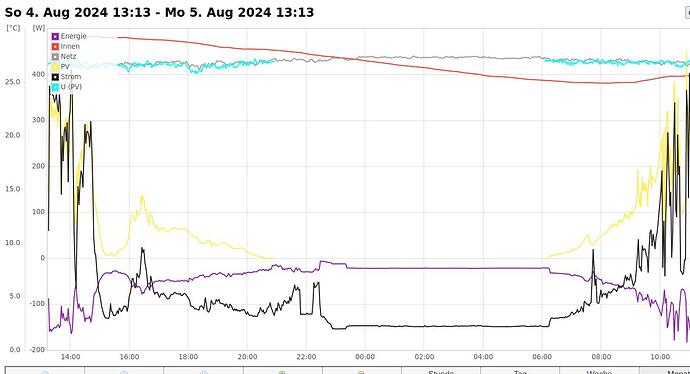
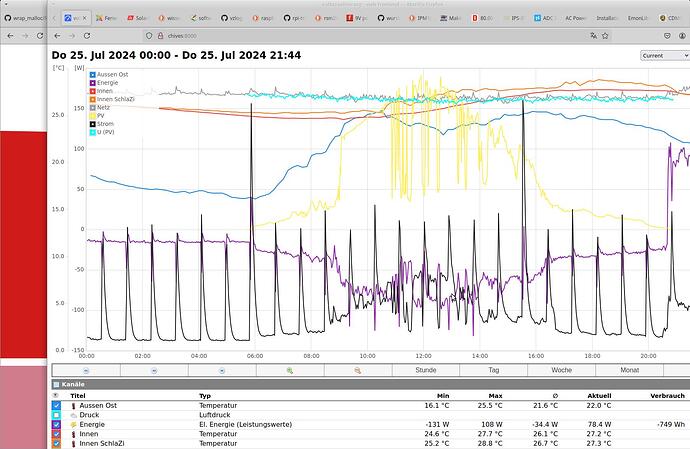
  1. At night the P-curve is nicely flat but at ~15W negative (i.e. feeding PV energy into the grid). Is that possibly caused by “uneven” resistors that are supposed to lift the X-axis of the sine curve to 3.3V/2, so that the resulting AC voltage of the SCT013-30 is a bit too low? Or what else might be the reason + how to fix? Just correct this by a software “offset” and always add, say 30W?
  2. The original vzlogger is not made for microcontrollers and runs into out-of-mem regularly which I caught (for now …) and trigger a HW-reset - these are the spikes in the black Irms-curve. After each HW-reset, the Irms takes a quite long time to “normalize”. Actually the purple P-curve is also affected. Why is that + how to avoid?

The curves as of today look like this (grey is U, black is Irms, purple is P, lightblue is U as queried from the inverter, yellow is P from the inverter):

The calls to emonlib are mostly as in the examples:

emon.current(pinI, 30); // Because SCT013-30
emon.voltage(pinU, 247, 1); // vCal measured, phaseCal not determined yet
and
emon.calcVI(20, 2000);

At earlier attempts I used emon.calcIrms(1480) and item (2) above was a lot better - so it seems as if the “offsetI” needs many cycles to go down?

Many thx in advance + even more thanks especially for the excellent documentation (with AC theory etc)!!!

I doubt this is really the problem, but when I quickly look at section 4.9 of the data sheet, you must check both the digital and analogue supply voltages to determine where the “mid-point” voltage should lie.

It is much more likely that your 15 W “night generation” is due to a phase shift in the measurements. There are three errors which can combine to make a very low power factor load appear to be a generator. This can happen when peak of the current wave is so close to the zero of the voltage wave that a small shift moves it from the consuming quadrant and into the generating quadrant. The three errors are the phase error of your current transformer, the phase error of your voltage transformer, and the time between reading the corresponding samples of voltage and current. The two transformers will have a phase lead, i.e. the sample appears to have been taken before it actually was - so it is the difference between the two phase errors which is important. The time between samples also appears as a phase error - 20 ms is equivalent to 360°. The way to compensate for the combined effect of these 3 errors is to generate a voltage sample by interpolating between the present sample and the previous sample, so that the new sample appears to have been taken at exactly the same instant as the current sample. Ideally, you do not extrapolate (you can swap the order in which you take the samples - this will probably help).

All I can say about this is obvious: the programming is faulty! My first and only suggestion, because I know no Python and almost nothing about the Raspberry Pi, is that there is a routine (perhaps more than one :unamused:) somewhere which is called regularly, it requests a block of memory, uses it and then fails to free it. It is called a ‘memory leak’.

Naturally, the power will be affected if current is affected - the power calculated by emonLib is the average of each pair of samples multiplied together (voltage sample × current sample).
If the voltage to the analogue part where your c.t. and v.t. voltages are conditioned to sit at the mid-point of the supply is switched or disturbed, or the memory of this voltage (offsetV, offsetI, which must be subtracted from each sample) is forgotten there is nothing you can do except cure the original problem - which is the memory leak.

Thank you very much already!!! Here is an update:
Finally I really found my mem-leak (excuse: the RPi Pico is not a classic RPi with Linux and all the tools but rather another microcontroller, so it was more difficult to find it) and now it keeps running.
Regarding the initial questions:

  • The nightly “power generation” did not go away - however I just set the phaseCal=1.28 as a first try. I inserted some tracing into EmonLib.cpp and can now see, that one inner calcVI() loop takes ~205-210ms, taking ~5200 samples. I tried to measure the time before the measurement of I and U (5-7 microsecs - is that possible, considering that 205ms/5200 = 39.4 microsecs?). Also, the EmonLib page regarding phaseCal says “wave is sampled about 53 times per cycle” - with numCrossings = 20 that would be 10 full sine waves (?), so 520 samples per wave … ??). Is that correct? And, is there something like a formula that produces with those numbers an appropriate phaseCal? I’d hope that this makes it easier to understand … :slight_smile:
  • The initial spike is not important anymore once the device keeps running - nevertheless: My question aimed at the spike at start-up, specifically I (and therefore P, U also shows this but at a much smaller scale). I worked around this now by discarding the first 5 measurements, but still I’d like to understand … With some more tracing a can see that the offsetI starts with 2048 (the Pico ADC has 12bits), then drops immediately to ~2000, then slowly nears ~2050 again. Is that normal?
    Many thx again!!! Thomas

Correct.

Also correct (approximately).

No. You need to know four quantities: the phase error of your voltage transformer, the phase error of your current transformer, the time between the voltage and current samples and the time between consecutive voltage samples. The two transformers will almost certainly have a leading phase error, so the sample appears to have been taken before it actually was. You need the difference between the two, convert this into degrees (one full cycle of your mains (20 ms?) = 360°), and convert the two times into degrees. Now draw a diagram and work out where the current sample appears to have been taken in relation to the voltage sample and the ones before and after it.

The way phasecal works is, it creates a voltage sample between the two actual voltage samples that is at exactly the same instant as the current sample appears to have been taken. It does this by interpolating between those two voltage samples. Because you have a very high sample rate compared to the Atmel '328P, it is likely you will need to store some samples, current or voltage, so that you can choose a current that lies between a pair of voltage samples that you can interpolate between. 'phasecal should lie between 0 and 1 for accuracy, values outside this range mean extrapolation which leads to an inaccurate voltage. ‘phasecal’ is where the new sample lies between the two real samples. The Docs Explanation of the phase correction algorithm — OpenEnergyMonitor 0.0.1 documentation explains a little more.

I have not done a timing diagram for you, you get a pair of samples about every ½° depending on your c.t. you could have a phase error of maybe 3°, so you might need to store 6 or 7 samples. This is getting complicated. Alternatively, you might be able to slow your ADC to reduce the number of sample pairs per cycle to be more like the '328P for which emonLib was written.

I don’t know - I have never checked in detail. There is another way – the way it is done in emonLibCM. There, we subtract the nominal offset (2048 for you) and accumulate all the V and I values so that, at the end of the averaging period, we know the true offset remaining. We then use the maths of rms averaging to correct the error in the rms value for V & I, or the ‘offset power’ to correct the power. To be accurate, this means the offset should only change slowly, which will normally be true.

Seems as if slowly getting closer to understand the theory part … :slight_smile: and the current graph looks much better, still with nightly generation though:

Btw, I learned in school (while ago), that voltage is “U”, is that maybe a German thing?

Anyway, to my understanding, we don’t need to worry about the vCal nor iCal - vCal is the result of a bit of trying and comparing the results of EmonLib::calcVI() with measuring the grid voltage with a multimeter (in addition I have displayed, what my inverter tells me (light-blue)).
Same for iCal (in my case a a fix 30A/1V SCT013 model, so iCal = 30).

But in both cases what would be the phaseCal to consider?
How would I determine the phase error of the V and I transformers?
I read this (and actually, all the other docs)
Different AC-AC Power Adapters — OpenEnergyMonitor 0.0.1 documentation
but that does not help as we don’t see the graph of the primary side - or am I missing something?
(nevertheless, which software did you use to take those pictures?)

My understanding so far:
With 50Hz grid frequency (i.e. 50 full sine waves per second) and requesting 20 crossings when calling calcVI() which equals 10 full sine waves, that calculation always takes 1/5 sec, i.e. 200ms, in practice ~208ms.
The number of samples taken during that time depends on the speed of the microcontroller.
Now, regarding the phaseCal - with in my case (and, in theory with this particular type of microcontoller, namely the current RPi Pico, this also should always be the case) ~6000 samples and a measured time of 208ms for the 10 full waves, we have 208ms/6000 = ~34.7 microsecs per one calcVI() cycle, and therefore also between two readings of V (and I).
Then:

  • one full sine wave 360° = 1/50s = 20ms, therefore 1° = 20ms / 360° = 55.5microsecs
  • taking time before measuring I and V shows that between both there are ~5 microsecs (so, ~30 microsecs for the rest of the calculations in calcVI - is that possible?)
  • so one calcVI cycle equals 35 / 55.5 = 0.63° and the measure ~5 microsecs = 5 / 55.5 = 0.09°
    All of that is almost constant per type of microcontroller and grid frequency(?)

Can that be correct? If so, is it really possible, that the deltaT of 5 microsecs = 0.09° between sampling V and I has that much of a influence? The faster the controller is, the less the phaseCal problem should be, at least the deltaT between sampling I and V (?)
In any case, would that be then a phaseCal of 0.91 (or rather 1.09)?

Some real samples, now with phaseCal=0.89, which I think look generally quite reasonable:

TGE PIN I: 0, U: 1
TGE ADC range: 4096
TGE Supply: 3300mVu, phaseCal: 0.89
TGE start 351113 Timeout: 2000, now: 351120 → 7ms
TGE startV 1846
TGE start Offsets: I: 2070.42 U: 2195.34
TGE end meas loop: 206ms NumSamples: 5931
TGE Raw samples V: ADC: 540 (deltaT: 10) filtV: -1653.73 (delta 0.00), pcFiltV: -1514.37 → -301.36
TGE Raw samples V: ADC: 530 (deltaT: 4) filtV: -1662.10 (delta -8.38), pcFiltV: -1661.20 → -330.58
TGE Raw samples V: ADC: 538 (deltaT: 4) filtV: -1652.49 (delta 9.62), pcFiltV: -1653.53 → -329.05
TGE Raw samples V: ADC: 511 (deltaT: 5) filtV: -1677.85 (delta -25.36), pcFiltV: -1675.11 → -333.34
TGE Raw samples V: ADC: 528 (deltaT: 4) filtV: -1659.22 (delta 18.62), pcFiltV: -1661.24 → -330.58
TGE Raw samples V: ADC: 516 (deltaT: 5) filtV: -1669.59 (delta -10.37), pcFiltV: -1668.47 → -332.02
TGE Raw samples V: ADC: 525 (deltaT: 5) filtV: -1658.97 (delta 10.62), pcFiltV: -1660.12 → -330.36

TGE Raw samples V: ADC: 2395 (deltaT: 5) filtV: 391.02 (delta 16.62), pcFiltV: 389.23 → 77.46
TGE Vrms: 226.03V
TGE Irms: 0.36A

The numbers above are:

for(int i = 0; i < 200; i++)
{
printf(“TGE Raw samples V: ADC: %d (deltaT: %d) filtV: %.2f (delta %.2f), pcFiltV: %.2f → %.2f\n”, samplesV[i], samplesDeltaT[i],
filtV[i], (i == 0 ? 0 : (filtV[i] - filtV[i - 1])), pcFiltV[i], (pcFiltV[i] * V_RATIO));
}

Interesting the samples around a zero-crossing - shouldn’t that be ADC=2048?
The ADC values are in a range of 474 … 3613 which yields a “center value” of 2043.5

TGE Raw samples V: ADC: 2467 (deltaT: 4) filtV: 89.80 (delta -17.09), pcFiltV: 91.64 → 18.24
TGE Raw samples V: ADC: 2450 (deltaT: 5) filtV: 72.73 (delta -17.07), pcFiltV: 74.57 → 14.84
TGE Raw samples V: ADC: 2430 (deltaT: 5) filtV: 52.68 (delta -20.05), pcFiltV: 54.84 → 10.91
TGE Raw samples V: ADC: 2412 (deltaT: 5) filtV: 34.64 (delta -18.03), pcFiltV: 36.59 → 7.28
TGE Raw samples V: ADC: 2400 (deltaT: 5) filtV: 22.62 (delta -12.02), pcFiltV: 23.92 → 4.76
TGE Raw samples V: ADC: 2378 (deltaT: 5) filtV: 0.62 (delta -22.00), pcFiltV: 3.00 → 0.60
TGE Raw samples V: ADC: 2364 (deltaT: 5) filtV: -13.37 (delta -13.99), pcFiltV: -11.86 → -2.36
TGE Raw samples V: ADC: 2342 (deltaT: 5) filtV: -35.33 (delta -21.97), pcFiltV: -32.96 → -6.56
TGE Raw samples V: ADC: 2328 (deltaT: 5) filtV: -49.28 (delta -13.95), pcFiltV: -47.78 → -9.51
TGE Raw samples V: ADC: 2315 (deltaT: 5) filtV: -62.22 (delta -12.94), pcFiltV: -60.83 → -12.10
TGE Raw samples V: ADC: 2297 (deltaT: 5) filtV: -80.15 (delta -17.92), pcFiltV: -78.21 → -15.56

Hmmm, hmmm, still no clue, what might be wrong …
It is indeed. I’m happy for you to use U, if this is what you learned.

But you DO. VCal & ICal are applied to the voltage, the current and the power calculations separately. You should not need to adjust ICal, but the European a.c. adapter requires a different VCal to the UK one (which is the default value in the sketch), in addition to it’s output being subject to a tolerance of ± 3%, so you will very likely need to get the correct value for this by measurement and comparison with a known good meter.

You either get it from the manufacturer, or you measure it - and this is the hard part. You can read how I tested the UK a.c. adapter here: Ideal Power 9V AC-AC Adaptor (Voltage Transformer) — OpenEnergyMonitor 0.0.1 documentation and the SCT-013-000 current transformer here: YHDC SCT-013-000 Current Transformer — OpenEnergyMonitor 0.0.1 documentation

I didn’t – those are Megni pictures from their Digital Storage Oscilloscope.
Since I did those tests on the Ideal v.t and YHDC c.t’s, I’ve got a two channel DSO too (not the same make), and I now use it to record the two waves (primary side and secondary side) and I use a FFT in a spreadsheet to determine the phase error. It is much more precise than trying to read the time difference at the zero crossings: ZMPT101B, powerfactor and current shown - #52 by Robert.Wall and the rest of this thread is well worth reading too.

Yes to the first part, but it reads both V & I in this 34.7 µs. It’s true that there is 34.7 µs between one V sample and the next, it will not be true that there is 17.35 µs between V & I samples.

This does look reasonable to me. But the next part is wrong - with 0.63° between samples of the same V or I, and maybe 0.09° (though I suspect it might be a little longer) between V&I) you still have something like an angle of 2° difference between the phase errors of the two transformers, and it is this error that is the principle part of the total phase error. (2° comes from my test results in the links above.) You cannot have a phasecal of 2 / 0.63 = 3.17 and not have a huge error in the synthetic voltage sample that’s created in the interpolation maths (it is now EXTRAPOLATING). As I suspected, you will need to store some samples, or slow the rate at which your version of emonLib reads the sample pair.

MANY THANKS again!! Quick comment for now: “not worrying about vCal and iCal” means not in general but rather regarding our topic here. I’d hope that I have them more or less correct.
One more thing: I determine the deltaT between measuring I and V like this and at least it is very consistent 4 or 5:

gettimeofday(&t1, NULL); // TGE
sampleV = analogRead(inPinV); //Read in raw voltage signal
gettimeofday(&t2, NULL); // TGE
sampleI = analogRead(inPinI); //Read in raw current signal
samplesDeltaT[numberOfSamples - 1] = (t2.tv_usec - t1.tv_usec);

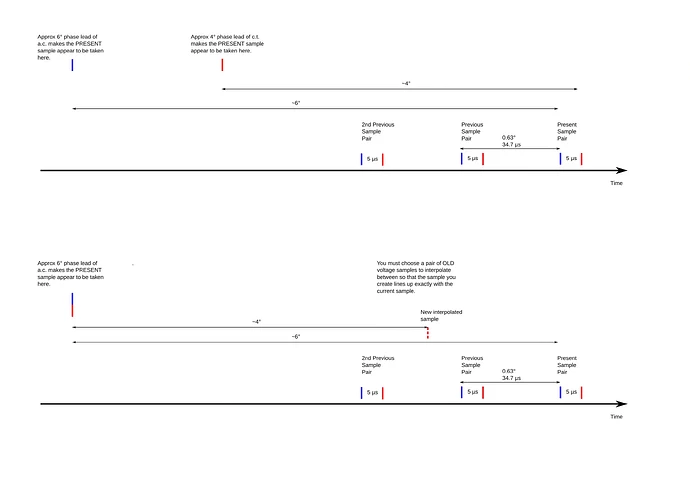
I’ve tried to illustrate how the transformer phase errors make the samples appear to have been taken at different times (top part of the diagram), and how you need to choose the correct pair of voltage samples to interpolate between (lower part of the diagram).

NOTE: The diagram is NOT TO SCALE. You choose the voltage samples based on the magnitude and direction of the difference between the two phase errors


.

Thank you so much again for your efforts!! Hoping that I’m not the only one that slow, an essence of this might go into the Doc?
A few more thoughts:

  • The purpose of the phaseCal is not just correcting the deltaT between sampling I and V in the calcVI loop but at the same time the phase errors of the transformers - is that correct? In my case (and with any faster devices) the deltaT (and therefore also deltaV) is so small, that phaseCal does not have the originally intended effect anymore. The deltaT-error is not that large anymore with fast devices, but the transformer errors are still the same.
  • I already contacted sbd who owns an oscilloscope to find out the phaseError of the V transformer … let’s see whether this leads anywhere

In an attempt to make phaseCal more effective, I inserted an 100microsecs sleep in the calcVI loop, so now there are ~1500 samples with ~133microsecs in between.

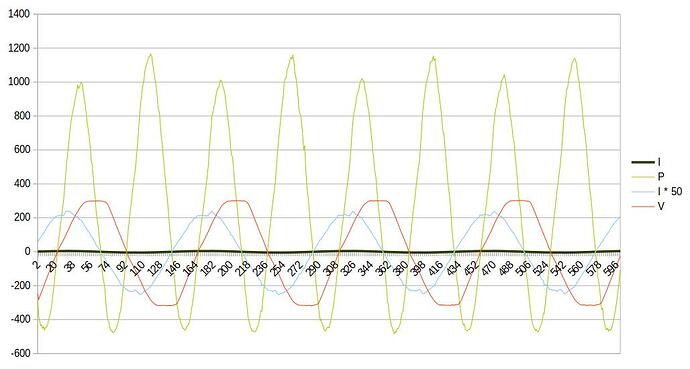
I ran a few tests, with PV on or after sunset, with small load and with a 600W toaster - most interesting is maybe the last.
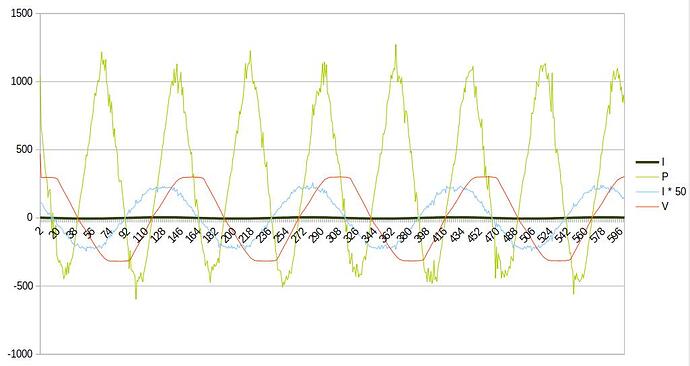
Irms is about right (~3.3A), whereas P is completely wrong (~260W). Lightblue is I (but multiplied with 50 to see it better).
What does that mean now - am I phase-calibrating into the wrong direction?

Btw, the actual data comes from calcVI (collect 600 samples and afterwards print then as CSV, then load into spreadsheet). I is calculated as filteredI * I_RATIO, V = phaseShiftedV * V_RATIO, P = I * V.

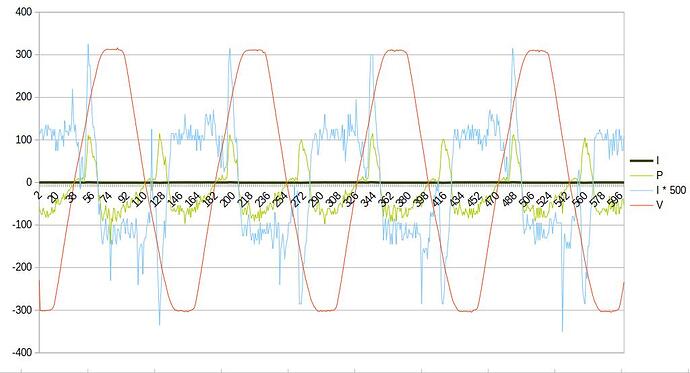
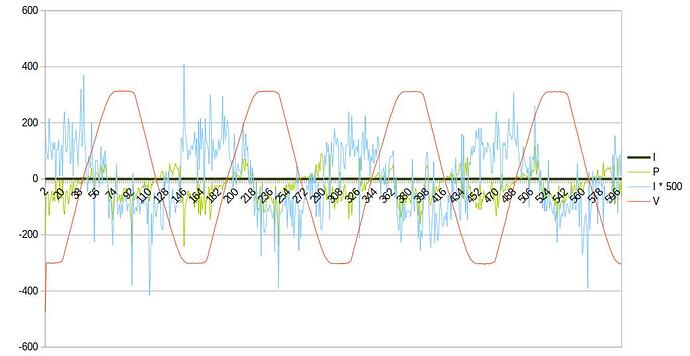
Another example (No PV, no major load - laptop and such) - here we have a magic 20W nightly-power-generation. Maybe this is the solution of all energy problems of the world :slight_smile:

One more try with phaseCal=1.5, with toaster:

Interesting now the not-so-smooth I-curve (this time I had the microcontroller on the USB port of the laptop, otherwise at another RPi - both to be able to capture the output).
With phaseCal=0.8 the first crossing of V is at sample 93, and I at 67 (i.e. delta=26), whereas with phaseCal=1.5 that delta is 117 - 89 = 28. Hmm, not any better.

No toaster, no load (even laptop on battery, but device on laptop USB again):

Exactly.

As for the screenshots etc, it will take me a while to work out what’s going on. Try redrawing the diagram I gave you above to scale, then you’ll get a better idea of what you need to do.

[Edit]
Having had little more than a quick glance at your spreadsheet picture, it didn’t make sense. I’ve looked a bit more closely now, and it still doesn’t make sense.
In post no.9, you say a 600 W toaster and “a small load”. I think there has to be something you’ve forgotten, because your current is shifted around 55° from the voltage, implying a power factor of 0.57 (and post no.11 is essentially the same, but “only” about 30°). There’s no possible way this could be the difference in the phase errors of the transformers. The current is leading the voltage, I think there’s a substantial capacitive load somewhere that you’re measuring - appliances on standby with just time clocks running, for example?

Where are you in the world (it’s not in your profile, and I don’t know of a country where the supply is ~180 V), and what are you using for the voltage transformer supplying the V to calcVI( )?

In post no.10, I can see exactly why you think you’re generating 20 W overnight -the current wave has shifted almost completely into phase opposition to the voltage.

I’m assuming you have the SCT-013-000 on the supply incomer to your house, and I think this is confusing things. I think until you have everything calibrated correctly, you need to move it to a test coil using your 600 W toaster as a load. If you’re on a 120 V system, that’s 5 A, so a coil of 10 turns (of 0.75 mm² copper minimum) would give you a test current of 50A. If you’re on a 240 V supply, the current is exactly half of that so you’d need 20 turns to show as 50 A. If you do this, only pass the current intermittently, and keep a careful watch on the temperature of the coil where the wires are bundled together. Stop and let it cool if it gets noticeably warm.

What you’re really interested in the difference between the phase errors of the two transformers, and knowing which direction it is. It’s a reasonably safe bet that both are leading, i.e. the output wave appears to be ahead of the input wave that creates it, and I’d hope and expect that the v.t. has a phase error not more than a few degrees, in other words, barely noticeable on a 'scope.

Hmm, all very mysterious …
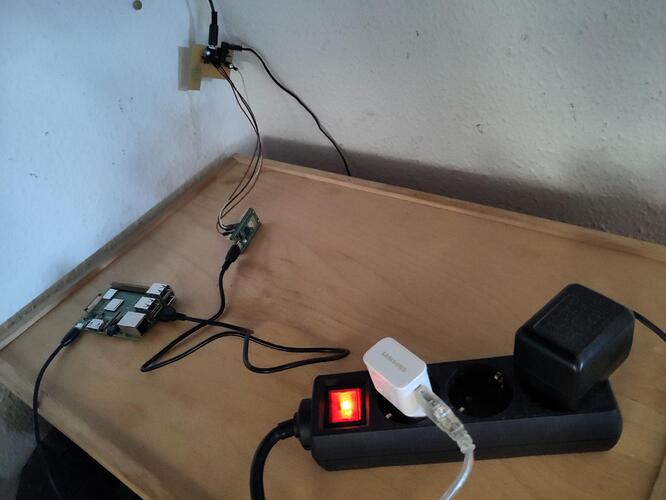
I’m in Germany, so 230V AC, 50Hz, the SCT013-30A (1V at 30A) is in the fuse box around one of the phase wires. My whole setup looks like this:


At the wall the “adapters” as described here: https://docs.openenergymonitor.org/_images/ct-sensors-circuit2.png and https://docs.openenergymonitor.org/_images/voltage-circuit2.png, the small device is the RPi Pico where everything happens, the larger one a “normal RPi” to capture log and CSV output.
The Voltage transformer belonged to an old phone, I did not even bother searching on the web for any documentation …

Regarding any “hidden loads” - the only one which came to my mind is the PV inverter. I will plug out everything later tonight (no PV anymore).
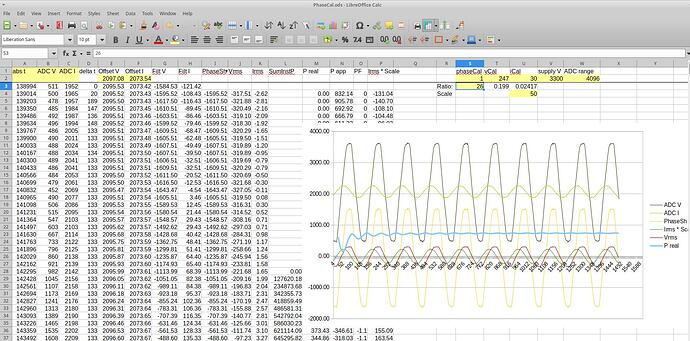
Furthermore I created a “simulator” - basically a spreadsheet I feed with the ADC samples (plus initial offsets and vCal etc) with the almost same math as in EmonLib:


Actually I was expecting that changing phaseCal moves the phaseShV and Vrms curves but it does not significantly …

I also reviewed the “hardware” again and noticed that as capacitor in the V-adapter for whatever reasons I used a 100uF, whereas in the I-adapter there is only a 10uF one … could this cause all the problems? I’ll replace it and check …
If so, already now my apologies for such an embarassing mistake …

Nope, that was not it. I also unplugged everything, the PV inverter, the laptop, even the smallest USB chargers … now there is almost nothing left. Still -15W.

Thinking about even the load caused by the toaster shows the same phase shift between V and I, wouldn’t that mean that also the toaster contributes to that, which is impossible (just glowing wires inside)?
Actually all the values appear reasonable - except that phase shift, which leads to wrong P.

Last update: just turned off the fuse of the washing machine … now +8-9W … that could almost be.
Assuming, that is it - is there anything we can do?

It’s most important to know this. I had been assuming - as this is a UK website and there was no other indication - that you were in the UK and had the standard 240 V single phase domestic UK supply. Now that I know you have a 3-phase 230 V supply, this changes many things.

Will you update your profile, please?

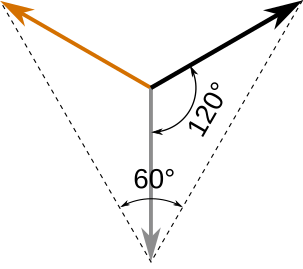
You must monitor voltage and current for the same phase. If you don’t, there will be a 120° approximately phase shift between voltage and current, and you won’t read the correct power. With a pure resistive load (your toaster) and a 120° phase shift you should read exactly half the correct power and with the wrong sign (negative/generating rather than positive/consuming).

Note, if your voltage is monitored line-line and the current is in a d phase-neutral load, or vice-versa, you’ll have a 30° phase shift between voltage and current - which is close to what we’re seeing on your spreadsheet. Could this be a possibility?

Do you know in general how 3-phase supplies work?

That’s a consequence of your high sample rate. Changing PHASECAL from zero to 1.0 makes a one sample shift of the voltage wave.

You have removed the rectifier and all other components, and you’re using only the simple isolating transformer? There’s nothing that looks like a filter, which would inevitably introduce a phase shift?

No. The two will have a small phase shift, which will be different for the two inputs, but the higher the bias resistor values, the smaller this phase shift (and hence the difference) will be. It will also be slower to settle on power-up, so you’ll have wrong readings for longer until it’s reached its operating point.

Hmm… Does the washing machine have a clock (to run overnight on cheap electricity)? It could also/instead be interference suppression components that are always connected. Either or both could be drawing a relatively high current but little to no real power, but because of this phase shift we’re trying to locate, it’s showing as generation.

I don’t suggest this as a permanent solution, but if you introduce or extend the delay you had in calcVI( ) so that it reads approximately 2535 pairs of voltage & current samples per second, then it should work almost exactly as it did on the Atmel ATMega 328P processor in the emonTx V2 & V3, and the original emonPi.

You would then see the effect of PHASECAL on the power factor it reports, and be able to adjust this to give a power factor of unity with your toaster.

Again thanks a lot for all your time!!! Normally I like these kinds of riddles, but eventually I also want the solution.

The washing machine is 1-2y old, probably full of electronics. However, even entirely disconnecting it and mostly everything else the spreadsheet graph shows a large phase shift between V and I.

With a calcVI delay of 340us I get those ~520 samples mentioned somewhere in the docs (= ~2500/s), also now playing with phaseCal moves the V curve slightly but by far not enough to compensate the actual error.

What remains? The C.T probably not, the V.T maybe - I did not try to open it yet. It says “out 9.5V AC” and we clearly see AC, but do these things possibly contain anything causing these effects?
I’ll have a closer look tomorrow …

Regarding 3-phase-power (I believe that I at least sufficiently understand it). The V.T is a normal plug-in device with 230V input, i.e. must be L1-N and not L1-L2 (if this is what you mean?).

Is the C.T and V.T on the same phase? I had some short doubts but am certain now - the C.T is around the black main cable (let’s call this “L1”, then there is brown “L2”, blue N and y/gn). All the cables leaving the fuses are black (except one brown towards a stove), so I was thinking that they are also L1. This is certainly wrong, because I don’t see the fridge nor dishwasher in my curves, so obviously they are on L2 …
So, for testing I plugged the V.T in a wall socket in the kitchen (presumably L2) - now P drops to -35W, that does not seem to be it either.

Plugging in the V.T the other way around reverses the P-curve - now the toaster turns into a large power generator :slight_smile:

This is exactly what I had hoped for. It should and would have given you a big enough phase shift had the phase shift between V & I been what we expect.

This is what I thought. Normally, I would expect to see a 230 : 9 V transformer, and nothing else (it’s likely to have a thermal fuse buried in the winding). You might get a 5° phase error, but 30° or 60°? I do not think you would see anything close to that

Correct. This is exactly what I was thinking - if you look at a phasor diagram. you’ll see that a voltage L1 - L2 is 30° shifted from both L1 - N and L2 - N currents. It should have been a silly thought, but when we have checked all the sensible things, it is time to look for the silly ones.

3-phase_3-wire.2

You have those the wrong way round - L1 is brown, L2 is black and L3 is grey.

This is with the 600 W toaster? If everything was correct and there are no phase errors anywhere, your toaster should read 600 W using the correct phase voltage and -300 W (generating!) using the wrong phase voltage. (You can see in the phasor diagram above, if you say the current is the black phase, the brown phase voltage projected onto the line of the black voltage is the dotted line, and where the black voltage meets it is is exactly half the length but in the opposite direction - so half the power and negative.)

Can you post (or PM) your modified emonLib so that I can check it.

Were you able to check this?
Some years ago, I measured the phase errors of the OEM a.c. adapters. These are an isolating step-down transformer in a case with a lead. The phase errors at worst were less than 6° for the Mascot and less than 8° for the TDC/Ideal.

I hope we are getting there … had the following thoughts:

  • we don’t need to care about what’s inside the washing machine etc - that’s the way it is and also what the meter in the basement will see
  • we have to compensate errors introduced by the “measurement framework” (CT+VT and the home-made adapters - of course assuming everything is connected correctly)
  • took me a while but now I was able to grasp what you suggested in post 8. In my spreadsheet I modified the formula which calculates “sumInstP” (in EmonLib lines 129-135) to not use “filteredI” of the same pair of samples but rather as of 26 samples in the past. The number 26 comes from the two I and V samples which are closest to zero:

(hope it’s readable … once we are done with all this I’ll be happy to share the sheet) - which is row 44 for V and row 18 for I. I can enter that “offset” into cell S3 and play with it, but actually don’t need to:
I doublechecked the toaster with some basic energy-meter, it even draws ~688W (on the label it says 750 :-)) with a PF=1. And voila, as visible in the curve, P is in around 700-720.

I did not alter the resulting curves for Irms and Vrms, so the graph still shows them misaligned.
I still suspect the VT, but ultimatively it does not matter … if all of that is right, that might be a valuable outcome: The calibration procedure might become much easier:

  1. plug everything together and let it run + record a set of samples
  2. load them into the spreadsheet and tune the calibration values

I will modify the EmonLib code correspondingly, let’s see …