It seems that when ordering I overlooked the fact that the SCT-006-000 is not compatible with the emonPi. I have connected it anyway, and it gives a reading that is way to high. Is using the SCT-006 simply a matter of adjusting the calibration? And if so, should this be done by modifying the firmware here:
?
Or it it preferred to perform the recalibration in emoncms somehow?
There is a 71R burden resister in the CT which when in parallel with the emonPi’s inbuilt 22R burden will give you just 16.80R which is way too low. You should be able to use the SCT-006 if you remove the onboard burden(s) and then recalculate and edit the Ical value(s).
Er, you may have that confused with another CT Paul. The SCT006-000 that OEM is selling has no internal burden. It has a turns ratio of 800. So if it were used in place of a 2000 turns SCT013, the result would be 2.5x the actual value. That doesn’t include any additional error for different phase correction, but you would have to consult the experts for that.
It is supported with a simple menu click in IoTaWatt.
I’m no expert in modifying the emonpi firmware, but the new calibration should be 36.36 if you can figure out where and how to do it.
My bad! I went to the datasheet looking to see if it had a burden pre-fitted and mistook the 71R internal resistance of the sec winding for an internal resistor.
In which case you can just edit the Ical or if you really wanted/needed better resolution you could replace the 22R burden with a higher value.
Thanks, worked perfectly. I needed to change the firmware anyway to also get the voltage reading at the same level as the IoTaWatt, which I calibrated using a (cheap, unfortunately) multimeter. I think I will leave the burden resistor alone
I’ve just noticed that the YHDC data sheet specifies 5 Ω as the maximum burden resistance. If correct (and I question it, as it doesn’t tie in with the rest of the YHDC range, especially the voltage output types), then the VA rating isn’t enough to drive the voltage necessary for the emonPi and emonTx inputs, and heavy distortion is likely.
I just tested, comparing a IoTaWatt circuit with a circuit on the emonPi (with adapted calibration), both using the SCT-006, and I found a 30 W difference for our vacuum cleaner (1430 W using the IoTaWatt, 1460 W using the emonPi). Would this be a likely cause for the difference, or is it more likely something like voltage calibration?
edit: this was using our vacuum cleaner as test object, maybe not the most stable source.
To put this in perspective, that’s a 2% difference. Most likely calibration in one form or another (VT, CT, reference voltage in the Pi). Also, if you are doing this simultaneously, you would have two different CTs which can vary somewhat.
If you can manage to extract Vrms, Irms and RealPower out of the two monitors it should give some clues as to the source of the discrepancy. I’m not familiar with the IoTaWatt or the emonPi so I don’t know how easy that is.
If they agree on Vrms and Irms but not on RealPower then the discrepancy is a bit more interesting and probably warrants further investigation. When I saw “vacuum cleaner” I initially wondered about phase errors, but I’ve just checked two here and they both have surprisingly good PFs and don’t show much current lag at all, although that’s not to say yours is the same.
Provided you weren’t actually hoovering at the time, i.e. it was just sitting there running in steady state with nothing to suck on, then I’d expect it to be quite stable, both mine are. Once I start restricting the air input flow, power drops quite significantly.
[EDIT] Or, if both monitors already report Vrms, RealPower and PowerFactor, then you can calculate Irms with Irms = RealPower/(Vrms*PF)
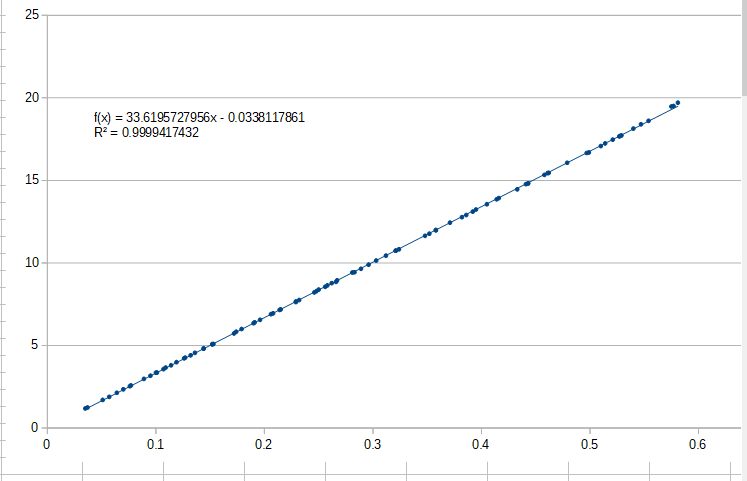
The function developed by the spreadsheet has a slope of 33.62. Multiply that by the burden value and the result is 807, which is within 1% of the CT spec of 800:1. It’s not shown here but the numbers go north very quickly after 20A primary, indicating saturation.
With regard to distortion, I think this indicates that the device is capable of developing it’s secondary current against a 24ohm burden. I’ve published this plot before to answer similar speculation about this CT. It is what it is: an small inexpensive CT that does a decent job of measuring currents under 20 Amps. The phase shift isn’t as low as better CTs, but is on a par with the SCT013-000 below 15Amps.
Depending on the power factor, phase correction could account for some of your discrepancy. At a power factor of .90, 3 degrees of phase shift could introduce a variation of 2%. IoTaWatt does a pretty good job of correcting for phase shift. Whether your changes to the EmonPi firmware address this, I don’t know. In tests that I have done of EmonPi vs IoTaWatt, there has always been a different variance with non-unity power factors. IoTaWatt vs revenue grade meters, not so much.
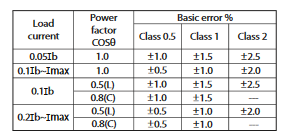
I don’t think it’s realistic to expect these two devices to agree within 1% across a varying current range and with varying power factors, but I do think it’s realistic to expect IoTaWatt to be within 1% of a 1% revenue grade meter in those varying conditions. Critics will cite extreme cases of current waveforms, but even the revenue grade meters have limits to their accuracy in outlier conditions. Here are the specs for one of the meters I use to test IoTaWatt accuracy:
My meters are accuracy class 1. Ib is 1 Amp. So there is no spec below 50ma, which at 240 volts is 12Watts. Below 200ma (48 Watts), the accuracy is +/-1.5% for non-unity loads and +/-1% for unity loads.
The point is that accuracy is subjective, and variation can be attributed to a combination of several factors. I don’t put a lot of emphasis on matching other devices. Instead, I measure energy over time and compare that to these meters. Two channels reporting slightly different instantaneous power can end up being the same kWh over time. The emphasis with IoTaWatt is to try to get those kWh measurements to be within 1% of various revenue grade meters. It does that pretty well, even with devices that have non-sinusoidal current waves and various CT and VT phase shift.
I calibrated IoTaWatt voltage with a (cheap) multimeter, and then the emonPi to match the IoTaWatt voltage. I just checked, after 1 month they are still the same up to the displayed digits (0.1 V). On the other hand, this is a three phase system and as it happens my test circuits were not on the same phase (and I was indeed using two different CTs).
So far, the IoTaWatt overestimates (compared to the official meter) the total energy usage by 0.17 % after 1 month. There was a peak in the error of 1.8 % after two weeks, but it has been declining since and I expect the error to oscillate slowly and stay below the 1 % mark. These results surpass my expectations, so I am very happy.
Anyway, thanks for the detailed replies, I was a bit concerned that the two circuits on the emonPi might be totally off, but I don’t think I need to worry about it.
I’m very happy to hear that. I agree that staying within 1% of the meter is an excellent result. I would consider 0.17% exact for practical purposes. For the benefit of those unfamiliar with this installation, it is an IoTaWatt in a three phase environment with three VT references.
Thanks for your work and feedback in the three-phase arena. I don’t have easy access to do this.
I must point out that the graph in post 10 was recorded in the 60 Hz world. For those wishing to use this in the 50 Hz world, you should note that the VA rating is proportional to frequency, therefore it is a more realistic representation when you scale both input and output by 50 ÷ 60, i.e. the maximum input is 16.666 A and the corresponding output is 0.5 V.
Until I have concluded the measurements I am presently engaged in making, all I am saying is that the graph in post 10 was recorded in the 60 Hz world. For those wishing to use this in the 50 Hz world, you should note that the VA rating is proportional to frequency, therefore it is a more realistic representation when you scale both input and output by 50 ÷ 60, i.e. the maximum input is 16.666 A and the corresponding output is 0.5 V.
Given one is just the time integral of the other, that tells you something is out of whack, and as you say, it may be your reference meter that is wrong. Ideally you’d be comparing with a meter that is 10x more accurate than what you’re aiming for. What sort of %-age discrepancy do you see in the instantaneous power readings? Two possible explanations come to mind:
given enough time, the heaviest load(s) will tend to dominate the result and they’re typically the easiest to measure accurately. In the case of whole-house measurements for example, my particularly ugly non-linear lighting circuit represents just 2% of my energy usage, so I could be seriously out in my measurement of that and it would have little impact on a periodic comparison to the revenue meter. The same principle applies if you’re doing per-circuit comparisons with a trusted meter. My dishwasher for example has some very reactive (i.e. poor PF) pumps which are easy to get significantly wrong, but the total energy consumed is totally dominated by the big fat resistor in the bottom that heats up the water.
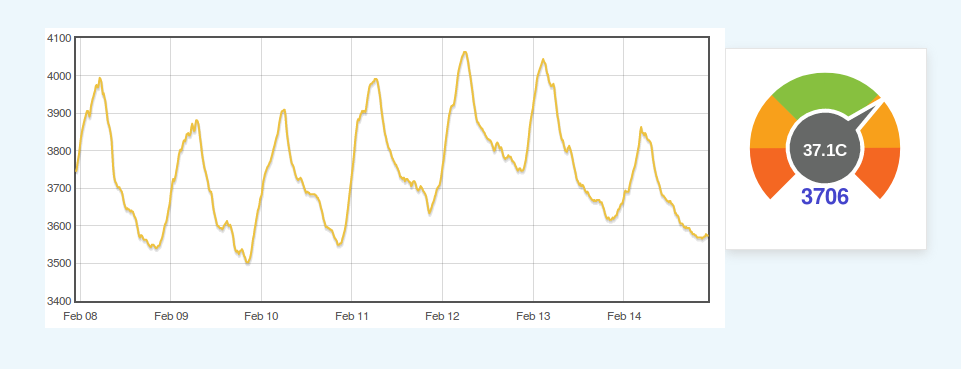
temperature variation. Depending on where your monitor is located, it can be subject to big temperature variations. I’ve got a temp sensor on mine, and it’s located in a closed box, outside and at risk of copping a bit of western sun in the afternoon and here’s what it sees:
You can design for that with low temperature coefficient for resistors that matter (shunts etc). I always aim a hairdryer at the relevant bits of the board to ensure the readings don’t vary significantly.
In summary, providing instantaneous power readings on interesting loads under varying environmental conditions is a much more challenging task than giving a daily or weekly energy consumed reading. Any accuracy claims made need to be met for all the provided readings (unless otherwise stated), not just a periodic energy tally.
What quantity is the graph showing? How much is the error due to the temperature variation? My setup is in the garage (in the insulated shell of the house, but not heated), so while temperature varies slowly, there will definitely be at least 10 °C difference between summer and winter, with some peaks larger than that.
Anyway, most of the circuits I’m monitoring are just to get a good idea of the relative importance of each, except for the heatpump where I would like to know the absolute consumption with some accuracy (say 5 % error). This also is a load with low PF, so maybe I’d better find a way to check this separately.
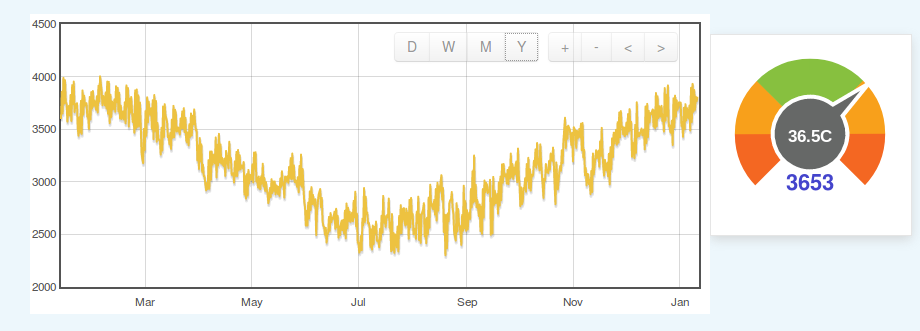
Apologies, that graph could definitely use some labels. It’s just a plot of PCB temperature in my home-brew energy monitor… it doesn’t show any errors. The units on the y-axis are 1/100ths of a degree. Here’s the annual version:
Total temperature range since I screwed it to the side of the house in 2015 is 19.5C to 40.7C.
I’ve never seen an emonPi (or an IotaWatt) let alone tested one, so take all this with a grain of salt. I’m merely offering two common causes of the “wobble” - where instantaneous power tends to drift relative to a reference meter, but long term kWH tallies are a good match.
Depending on what Robert finds with his CT testing, CT saturation and associated signal distortion would open up a whole bunch of wobble opportunities.
Out of interest, how many watts is your heatpump and what sort of PF do you see on it? Does it cycle in and out like a fridge, or does it slowly wind power down/up to control temperatures?
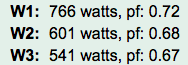
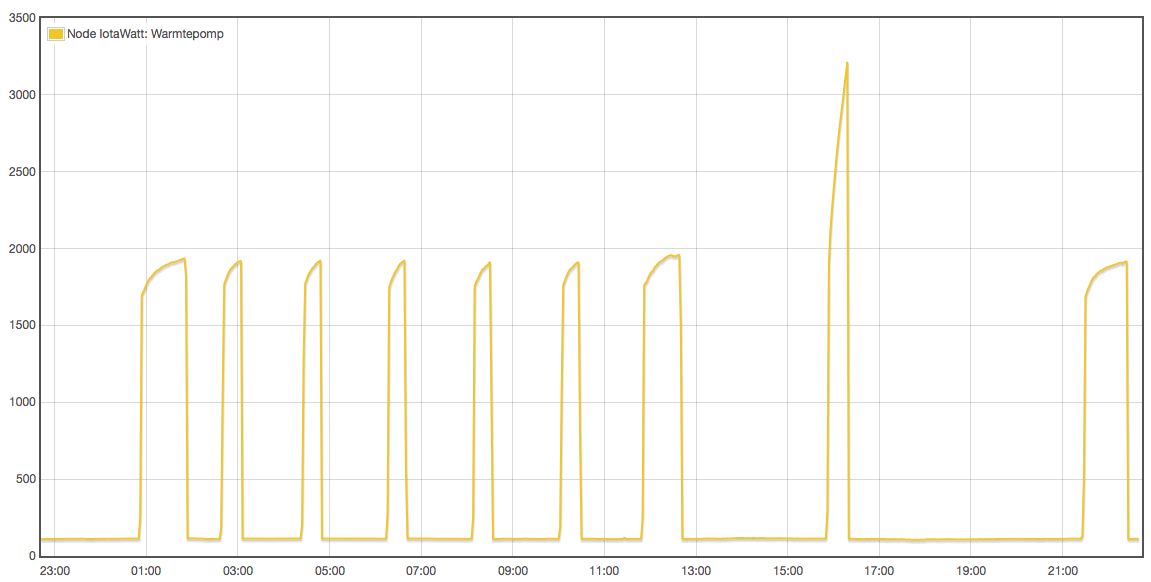
Nominal electrical power is rated to be 1.8 kW for the heating itself and 10 W for accessories/electronics (1000 W max). One interesting thing I noticed is that the idle power is actually 110 W, so that certainly needs further investigation. The jumps to +/- 1900 W are heating cycles, the peak over 3000 W is to heat the hot water boiler. The pump itself is a Viessman Vitocal 222.
Indeed. It’s hard to believe that could comply with Euro standby power regulations. Is there any chance there’s still a fan or something running during those periods or is the unit completely quiet? It would be interesting to know how that 110W is spread across the three phases. Any chance you could get a 3x Wattage/PF display of it in that state please?
Out of interest, which of those three phases is the one connected to the IotaWatt’s “official” voltage input jack? The schematic shows a 10uF series cap on that voltage input that presumably doesn’t exist on the other two that come in via the adaptor cable and CT inputs. If I’ve done the maths correctly, that would introduce a 1.4° phase shift on that voltage signal that’s not on the other two (although that may be compensated for somewhere else). Don’t be tempted to add a 10uF cap to the other two as the series resistance on those inputs is much lower (312R Vs 13K) so doing so would introduce a massive phase error.
A general rule of thumb for meter design (I think I first heard it from the energy IC manufacturers) is to put the exact same filters on all your inputs: I and V, across the board. That way any phase error introduced by the filters will be nominally the same on every channel (Vs and Is).
One really simple test would be to choose one of the phases that comes in via the adapter cable and move both its VT and its heatpump CT to the phase that comes in via the “official” VT input jack. Don’t just re-assign the CT to the other VT, but rather leave the config unchanged and physically move both the VT and the CT. That way we know both VTs are measuring the exact same voltage signal and both CTs are measuring the exact same current signal. Since it’s a class 1 meter, they should each be ±1.5% of reality, so worse case should differ by 3%, so about 23W if it’s the phase with the electronics or 18W ±1% of reality, so worse case should differ by 2%, so about 15W if it’s the phase with the electronics or 12W if it’s one of the other two (do it while the heatpump is running rather than standby). That would rule out any basic calibration/configuration issues. Unfortunately, it would completely screw with the power readings for any other circuits on that phase, so you might want to turn logging off while you do the brief experiment. [EDIT] Since you have to disturb your logging to do this experiment, it might even make sense to do it for all 3 phases at the same time. Put all three VTs on the one phase, and all three CTs on the heatpump feed that corresponds to that phase.
Assuming that all checks out ok, there’s then a 60W difference between your two phases that don’t power the electronics and accessories. That might be down to a voltage imbalance, so knowing the three phase voltages at the time might also be useful. If it turns out there is a voltage imbalance, then the 60W imbalance may just be the way the 3-phase compressor reacts to that, or it may be that the VTs are sliding around on their PhaseError Vs Voltage graph. You can see pictures of that in various reports here: