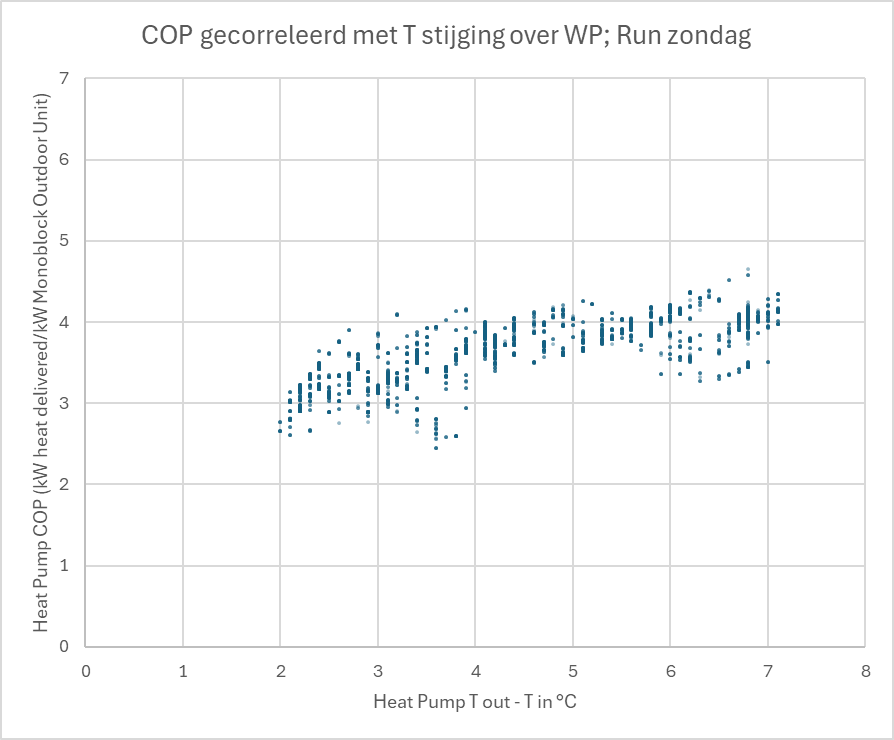
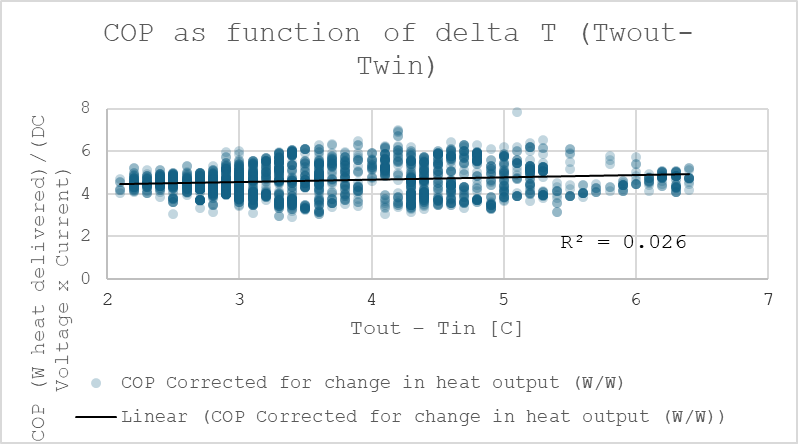
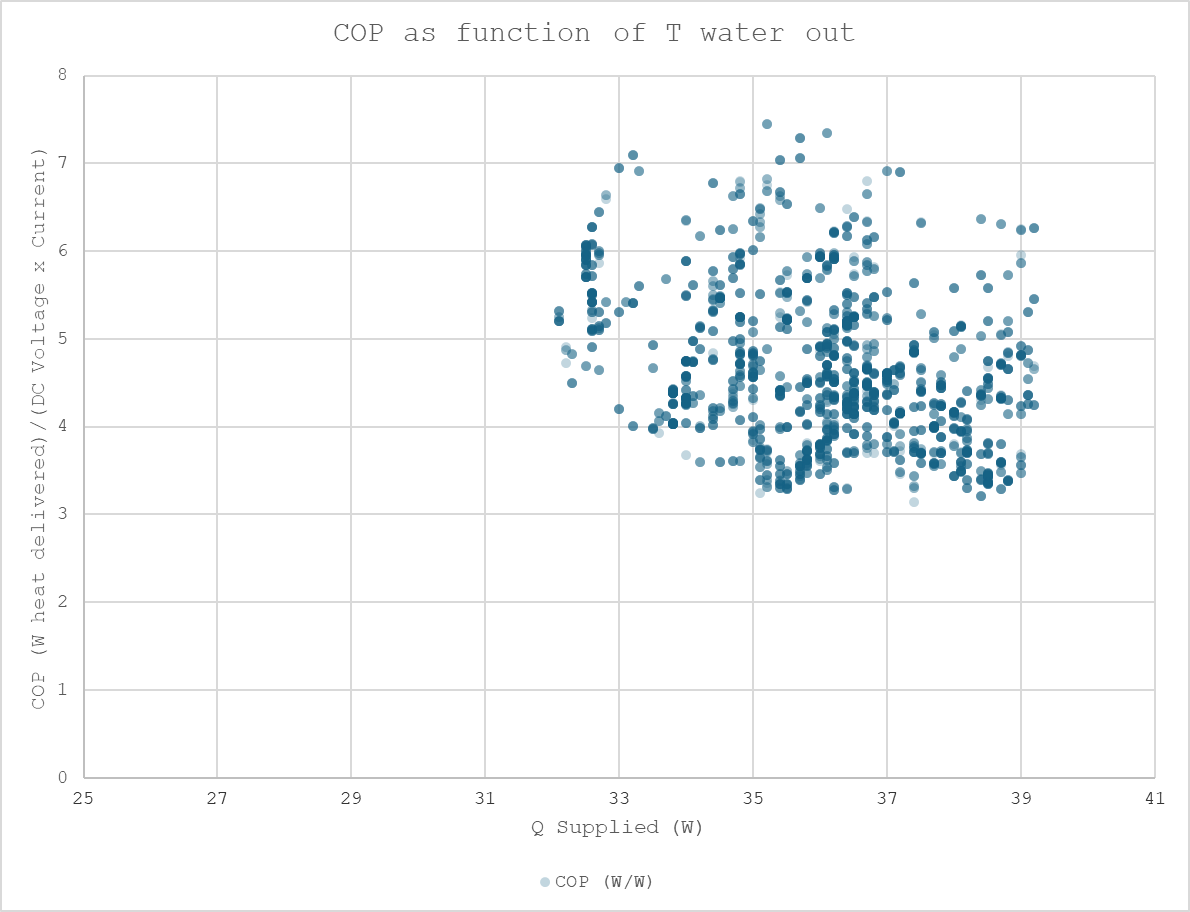
Here is an update of the COP vs T increase graph by the way: I omitted the first 700 values to get rid of the more dynamic part of the graph. Now the high spikes are gone.
A 2nd degree polynomial seems to give the best fit as trendline (R^2>0.7) but only marginally better than a linear fit (R^2 ~0.68)
I had a bit of a chat with google gemini on this subject and Gemini suggests that the EEV Valve’s purpose should be to guarantee superheating at the evaporator outlet in order to guarantee dry vapor entering the compressor. This should be with the goal of protecting the compressor.
If that is what it is a lack of liquid refrigerant (which can be approximated by the total mass of refrigerant present in the system) could lead to uncondensed vapor from the condenser entering the evaporator and end up being recompressed. This in turn would lead to high compressor power and then a low COP.
Sarah could you check on your heat pump how the correlation is between EEV valve position and superheat at evaporator outlet? (Or maybe change of EEV valve position compared to the previous position in relation to superheat at evaporator outlet?)
I will check the same on my heat pump.
Remove on/off switching.
Remove all extra pumps post buffer to zones.
Install a high KV value 3port.
Pipe buffer as volmiser.
Make system as much open loop as possible.
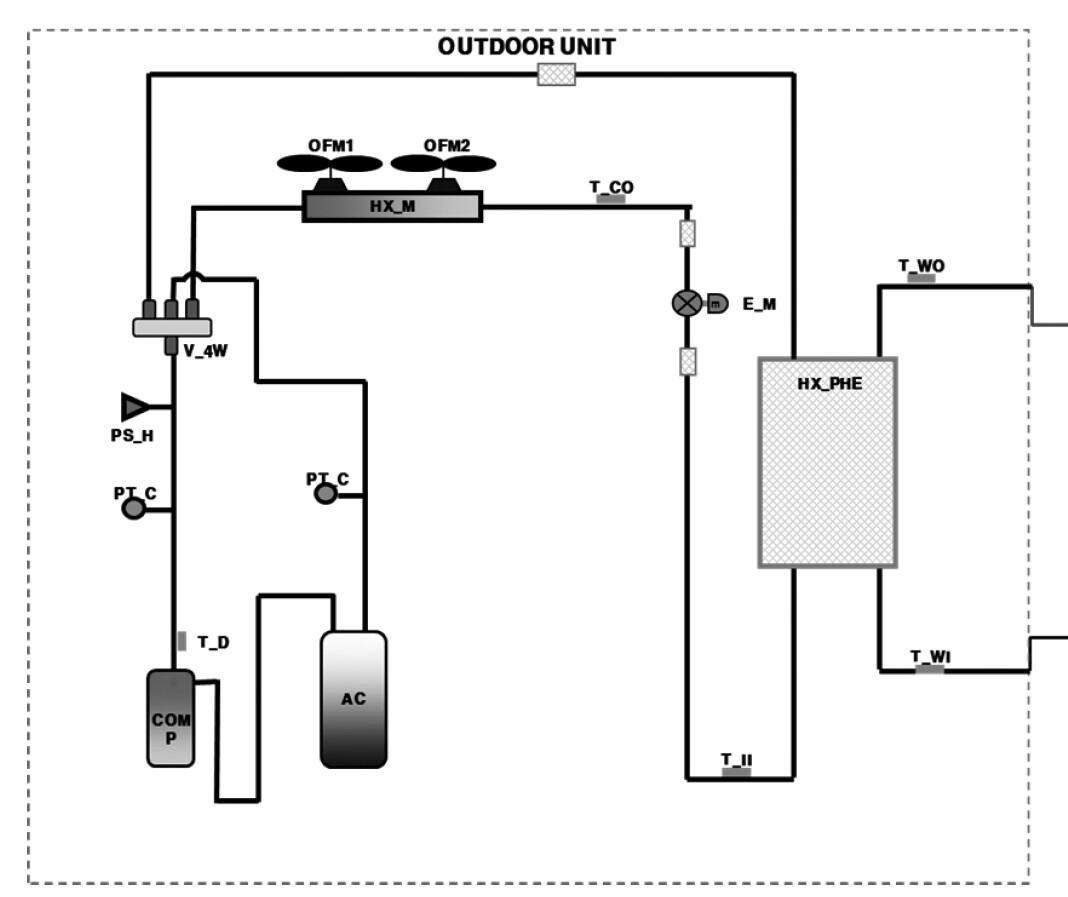
I took a deeper look at the construction of my heat pump @SarahH to get a better understanding of the EEV valve.
In this picture one can see the locations of installed temperature sensors in my heat pump. Now with 1 valve you can control 1 condition at 1 point at a time.
So the EEV valve is between 2 sensors: T_II and T_CO.
Other temperature sensor installed is: T_D (Compressor discharge temp).
There is a pressure switch but no pressure sensor is installed. So the heat pump does not measure compressor inlet or outlet pressure (at least: Not as far is visible in Samsung Snet).
T_Co is the 2-phase temperature in the evaporator (a heat pump should flash slightly subcooled liquid over the EEV valve for maximum COP). And it makes most sense to control that temperature using the fans.
T_D is influenced most directly using the compressor.
So my guess is that the EEV valve labeled E_M in this scheme is set to control T_H. It would make most sense to control it to having a small temperature difference between T water in (T_WI)_and T_H.
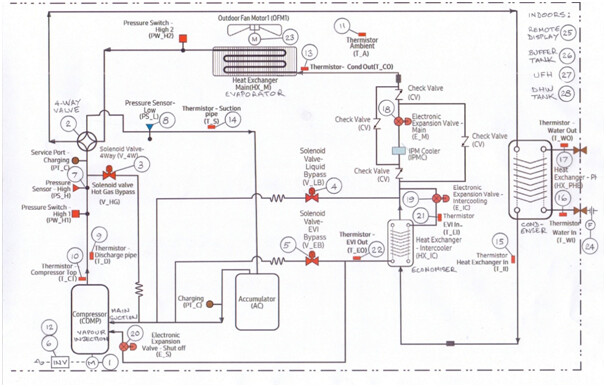
My experience with Samsung ASHPs is limited to the AE080BXYDEG (the HTQ series) which differs from the AE160RXYDGG in at least one important respect - I have a vapour injection circuit whereas yours (and all the other Samsung ASHPs I believe) does not. This may mean that the Outdoor Unit (OU) instrumentation may also differ. In addition, Samsung publish a lot more information about the HTQ series OU than other series. For example, here’s the PFD of my ASHP, taken from the Samsung EHS Data Book, marked up with balloons showing the instruments that SNET-Pro2 displays:
You will see that the compressor suction and discharge pressures (8 and 7 respectively) and temperatures (14 and 9 respectively) are available, along with the R32 temperatures leaving the condenser (15) and main EEV (13).
You say you use SNET-Pro to monitor your OU. I use SNET-Pro2 and this may reflect other differences in the respective data that we have available. The Pro2 display includes the calculated R32 dew point temperature at the compressor discharge pressure (which the controller uses to set the latter to ensure complete R32 condensation - with minimum subcool - against the water RWT), and the calculated R32 bubble point temperature at the compressor suction pressure (which the controller uses to set the latter to ensure complete R32 vaporisation - with minimum superheat - against ambient air in the evaporator.
This is one of the most important controller algorithms, though I observe a significant anomaly - the Pro2-reported figures are not the same as for pure R32 (see more on this below), and I speculate that this may be either 1) a margin that Samsung add to the respective bubble and dew point target temperatures to guarantee complete condensation and evaporation, or 2) an empirical allowance for the effect of the oil that circulates with the R32 on mixture vapour pressure.
I hope we are agreed that, between them, the main EEV position and the compressor speed are used by the controller to adjust compressor suction and discharge pressure per the above algorithm, which minimises ASHP energy requirement. I’d accept that the evaporator fan speed may also have an effect, but I suspect that this is less significant on overall energy efficiency.
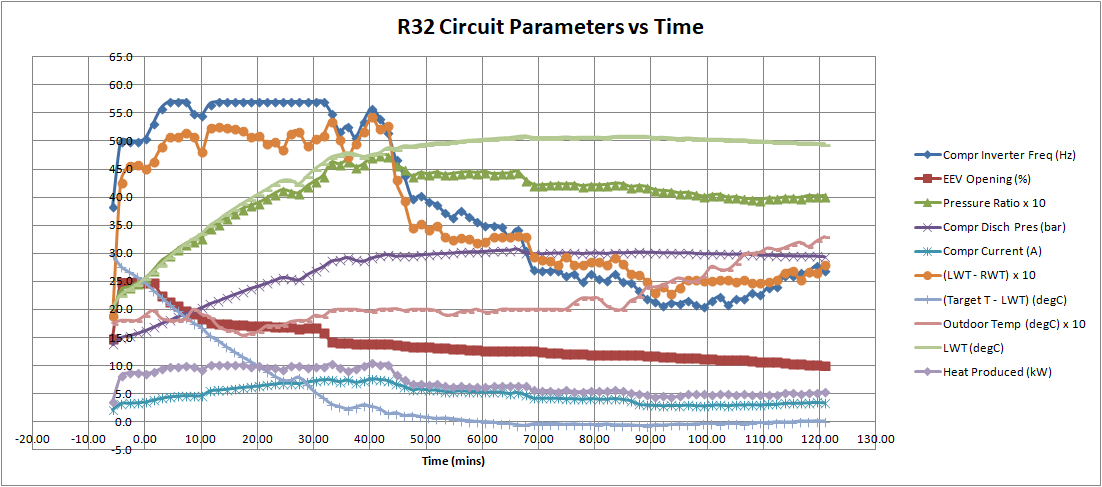
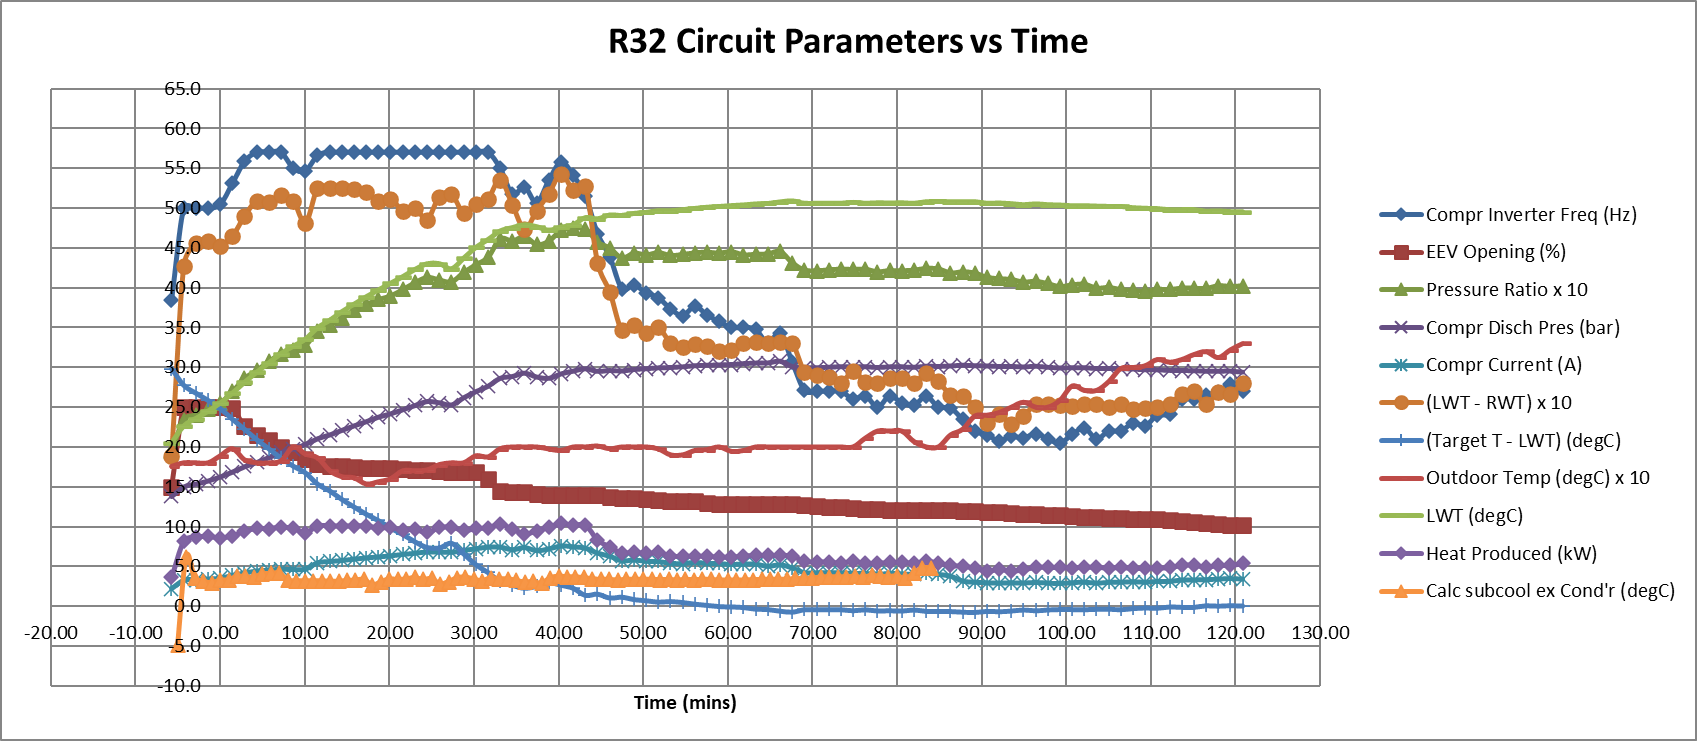
Using SNET-Pro2, I recorded a recent startup run (from cold, following a night-time setback) for about 2 hours and got the following results: (This was a fairly low ambient temperature, with a fixed speed water circulating pump, on Water Law control.)
(I set the time axis to show zero when the controller started its “Normal Operation” control - the negative times are the prior 5 minutes or so when it is in “Safety Start” control.)
There are some helpful conclusions to be drawn from this graph, and I urge you to take some time to study it carefully:
During Safety Start, the inverter speed is limited to synchronous (50Hz). I surmise that during this time, the controller is calculating the correct maximum Normal Operation speed (probably based on the initial temperature rise rate in the circulating fluid - from which it estimates the speed that will give ~5degC between LWT and RWT).
Once Normal Operation starts, the key control factor seems to be (Water Law target - measured LWT). When this is >2degC the compressor speeds up to the pre-calculated maximum (57Hz) and stays there until (WL Target - LWT) falls to ~2degC (around minute 32), after which the controller gradually reduces compressor speed.
There is clearly some 2- or 3-term controller action here - look at the LWT line, the slope of which is reducing as it approaches the target 50degC.
The main EEV is slowly closes a little after Normal Operation starts, but I can’t see from this graph the interaction between the compressor speed and EEV controls - I assume that these are programmed into the controller algorithm (opaquely to us - Samsung protecting its commercial assets I guess).
~45 mins after Normal Operation, the water has reached its WL target temperature, and the ASHP heat output falls from ~10kW to ~5kW. You could calculate the thermal inertia of the water system (water/piping/radiators/buffer tank) from this if you wanted to.
The Pro2 spreadsheet that gave this data is here: OEM Startup Study.xlsx (84.0 KB)
If you go the right end, you’ll see some calcs I did calculating the difference between the Samsung-predicted saturation temperatures, and those I estimated for pure R32 - only a few degC, but I won’t be happy until I’ve resolved the discrepancies. Any thoughts welcome!
Nice long read, I will try to comment on as much as possible;
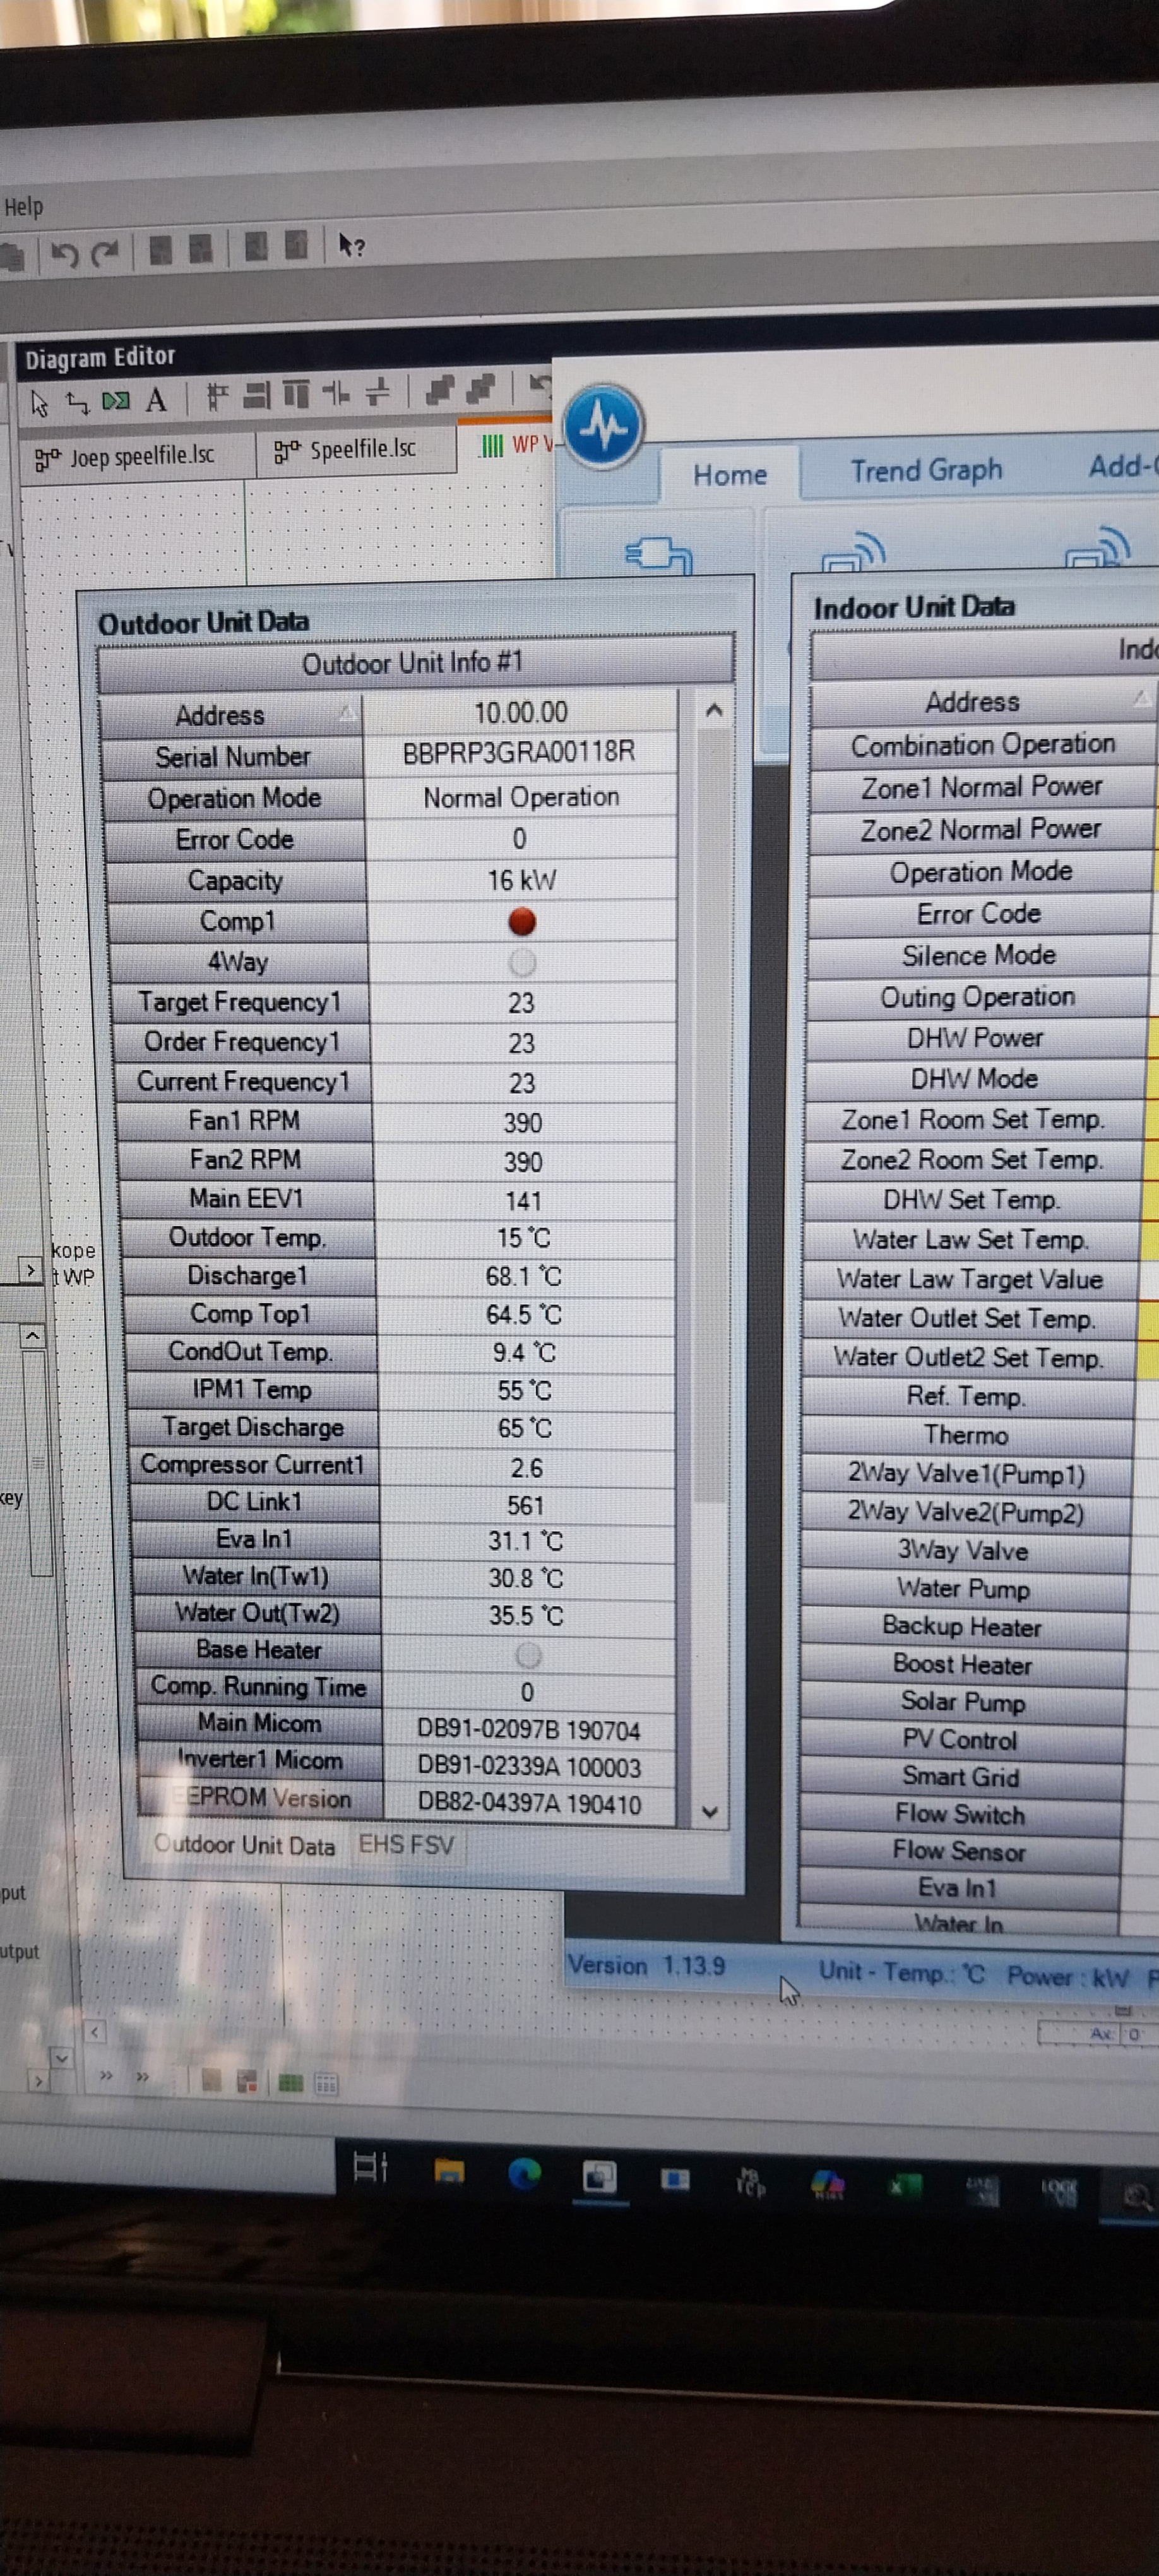
1: I checked my version and I also have SNet Pro 2; My heat pump (also according to the manual) just has less sensors. As far as I can see all the sensors present in the manual also pop up in Snet Pro 2
2: See above.
3: I did a small check on your data by replacing the logged pressure with (Pressure -1) to see if there was an absolute vs relative pressure thing in the calculation but that just sort of flips the error. My best guess is that this is to account for traces of oil in the R32.
4: On this point we may have different algorithms. Your heat pump has more instrumentation and therefore more possibilities to control the EEV valve on. I do not have any pressure sensors in my heat pump as far as I can see.
5: If you could add standstill data well before the start this may also give some info on any pressure-temperature mismatches without influences of the heat pump running (and with less dynamics)
On the studying points:
Safety Start: I read info on the site of Copeland (a scroll compressor manufacturer) They also have some time running at fixed speed in their documentation before variable RPM comes into play. My guess is that this is (at least from the compressor point of view) to guarantee sufficient lubricant circulation as soon as possible. I would not see much point in pre-estimating speeds.
Normal operation: I found on my heat pump that this occurs after a fixed time. On my heat pump the routine is: 30 sec of water pump rotation. Then compressor starts rotatig at fixed speed until 2min 40 secs. Then the variable speed comes in. If I set the output temp to 25C it will continue to rotate at minimum speed until 5:00 and then shut down. After this 5:00 it always shuts down very soon after reaching T setpoint + 1C. But again we may have different control algorithms here. On my heat pump I sometimes suspect that it tries to run at certain preferred frequencies (or maybe it just avoids a few that cause resonation/sound issues in the heat pump?) but I did not check to confirm that in S-net data yet.
On the EEV Valve: As soon as the compressor runs column AQ shows a calc subcool ex Cond’d of about 3-4 °C. I added that parameter to your graph for illustration. It seems fairly constant and from a thermodynamics point of view I would still see that as the more logical parameter to control for that valve. As soon as you switch to any algorithm with a risk of vapor coming through the COP would drop significantly. So guaranteeing pure liquid at the condenser outlet is of utmost priority. 3-4 °C margin is sensible to stick to.
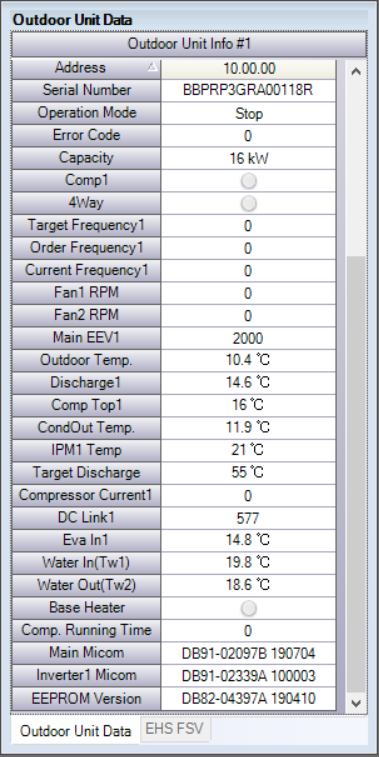
Below is S-Net Pro 2 output of my heat pump after a night of standstill by the way…not all temperatures of refrigerant filled lines are equal, which suggests some tolerances between the sensors (presuming there is nothing that heats specific parts of the heat pump that is).
Yes I can see from your Pro2 output that your OU has less instrumentation than mine, and can only conclude that the algorithms must be different too.
I suspect that the HTQ series was something of an experiment on Samsung’s part. Several research papers were released between 2000 and 2010 which showed all sorts of benefits of a vapour injection (VI) circuit, and Samsung changed their design accordingly for the HTQ series - with the necessary additional instrumentation - only to quietly drop the idea for subsequent ranges. Certainly when the VI circuit starts the compressor gobbles up a lot of extra energy - adding about 1.5A to Compressor Current - though it does offload the evaporator R32 flow, and is another way of guaranteeing no R32 liquid at the compressor suction. It also reduces defrost frequency - I hardly ever get one.
I had been thinking of starting a separate thread on the forum, called Samsung ASHP controller algorithms (what we know and don’t know but suspect) or similar, but the fact that they may be more range-specific than I had assumed would probably make this a bad idea.
You obviously know a lot more about the engineering behind Samsung ASHPs than I, so please keep us informed of any new insights…
Thermodynamics is a big part of my normal job.
That said I am mostly involved in steam boilers at power stations, waste incineration or other larger industrial plants. But then I did get the basics behind thermodynamics of various cycles among which heat pumps during my education.
Having the education on the basics is off course not the same thing as knowing by heart how all heat pump suppliers chose to make the best possible use of the laws of physics until the last level of detail. I may just be a bit faster than the average user on understanding what happens, or may come up quicker with workable ideas on “how would I do this if I were the manufacturer”.
But beware; Off course that does not mean I am right or have the best ideas all the time
So don’t hesitate to keep coming up with your own ideas.
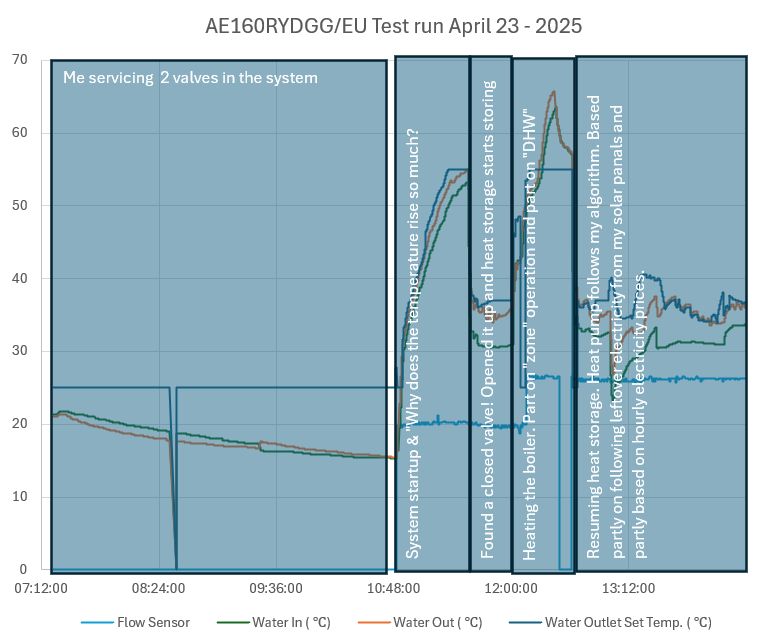
My log of today…increased the pump speed during the day and lowered the minimum temperature difference (water out - water in) in my PLC program from 5 to 3 C.
Those results are weird!
I can see that you increased your water flow from 20 to 26lpm at about 12:09.
But what happened at 12:37??
Your Water Outlet Set Temp (whatever that is…) dropped from 55degC to 25degC in the space of 9s, and a few seconds later your LWT dropped from 57degC to 44degC within 3s! (The RWT dropped even more - by 16degC!!!) I’m really struggling to picture how this can happen, unless there’s something about your setup that you haven’t told us about.
I’ll be very interested to see your analysis…
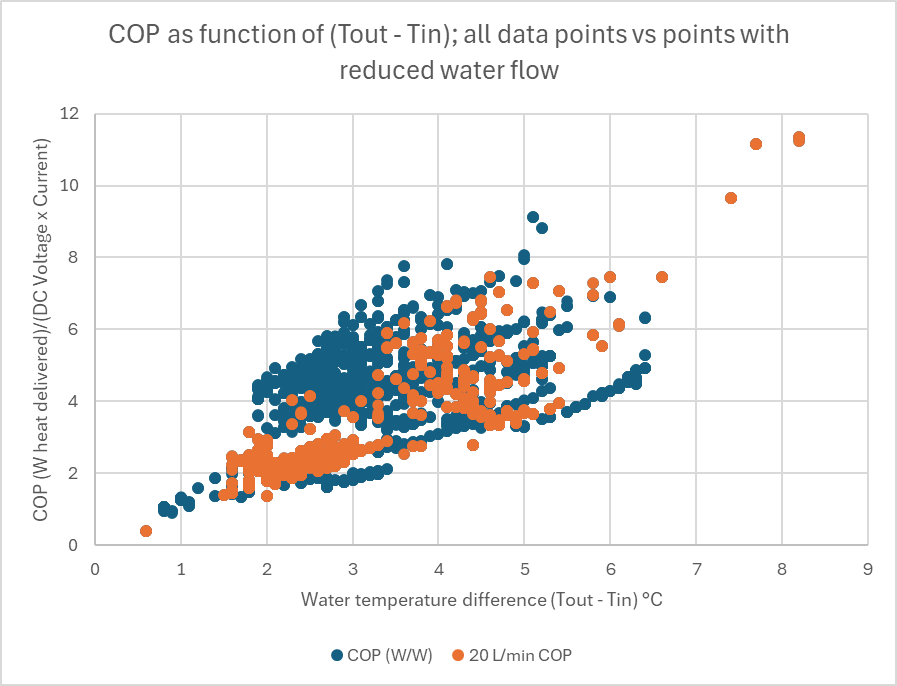
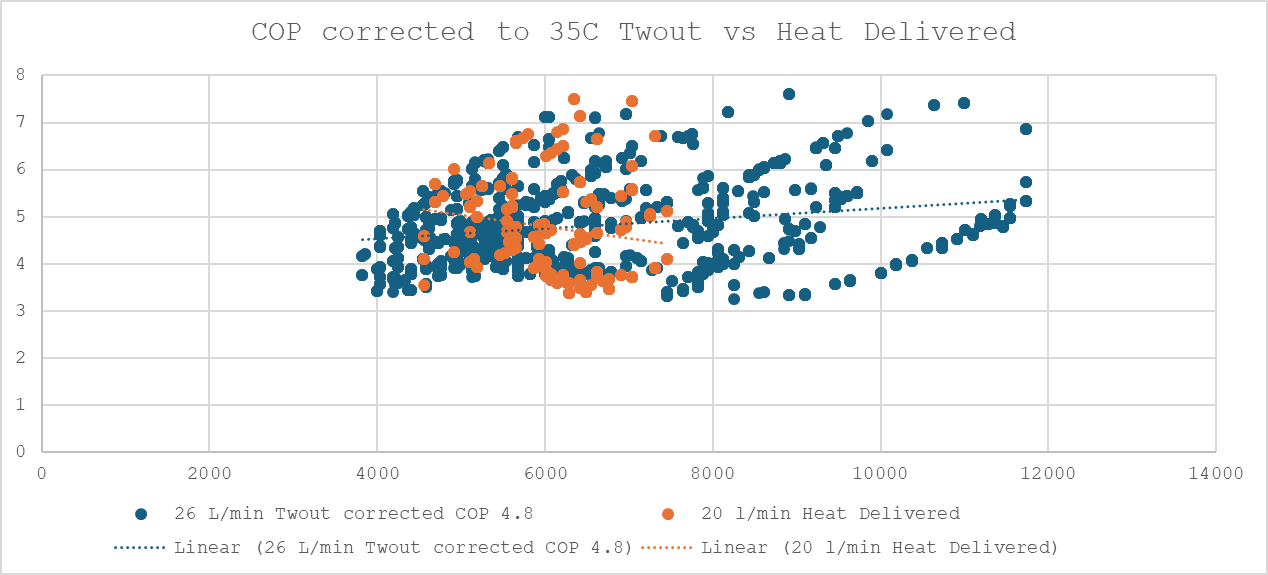
First analysis: I plotted COP vs temperature rise of the water over the heat pump.
2 Plots: Dark blue is basically the whole day, so part with ~26 l/min and orange the first part of the day with approximately 20 l/min.
Feedback from Samsung suggested me that I needed at least a 5 °C temp rise over the heat pump to get sufficient COP. Now it does seem that in general having a higher temperature rise is beneficial. But not to the extent that supplying less water at the same heat output to get the 5C temperature rise…I would guess from this plot.
More analysis really later on because I need to spend the evening on other stuff Samengesteld log 2025-04-23.xls (7.5 MB)
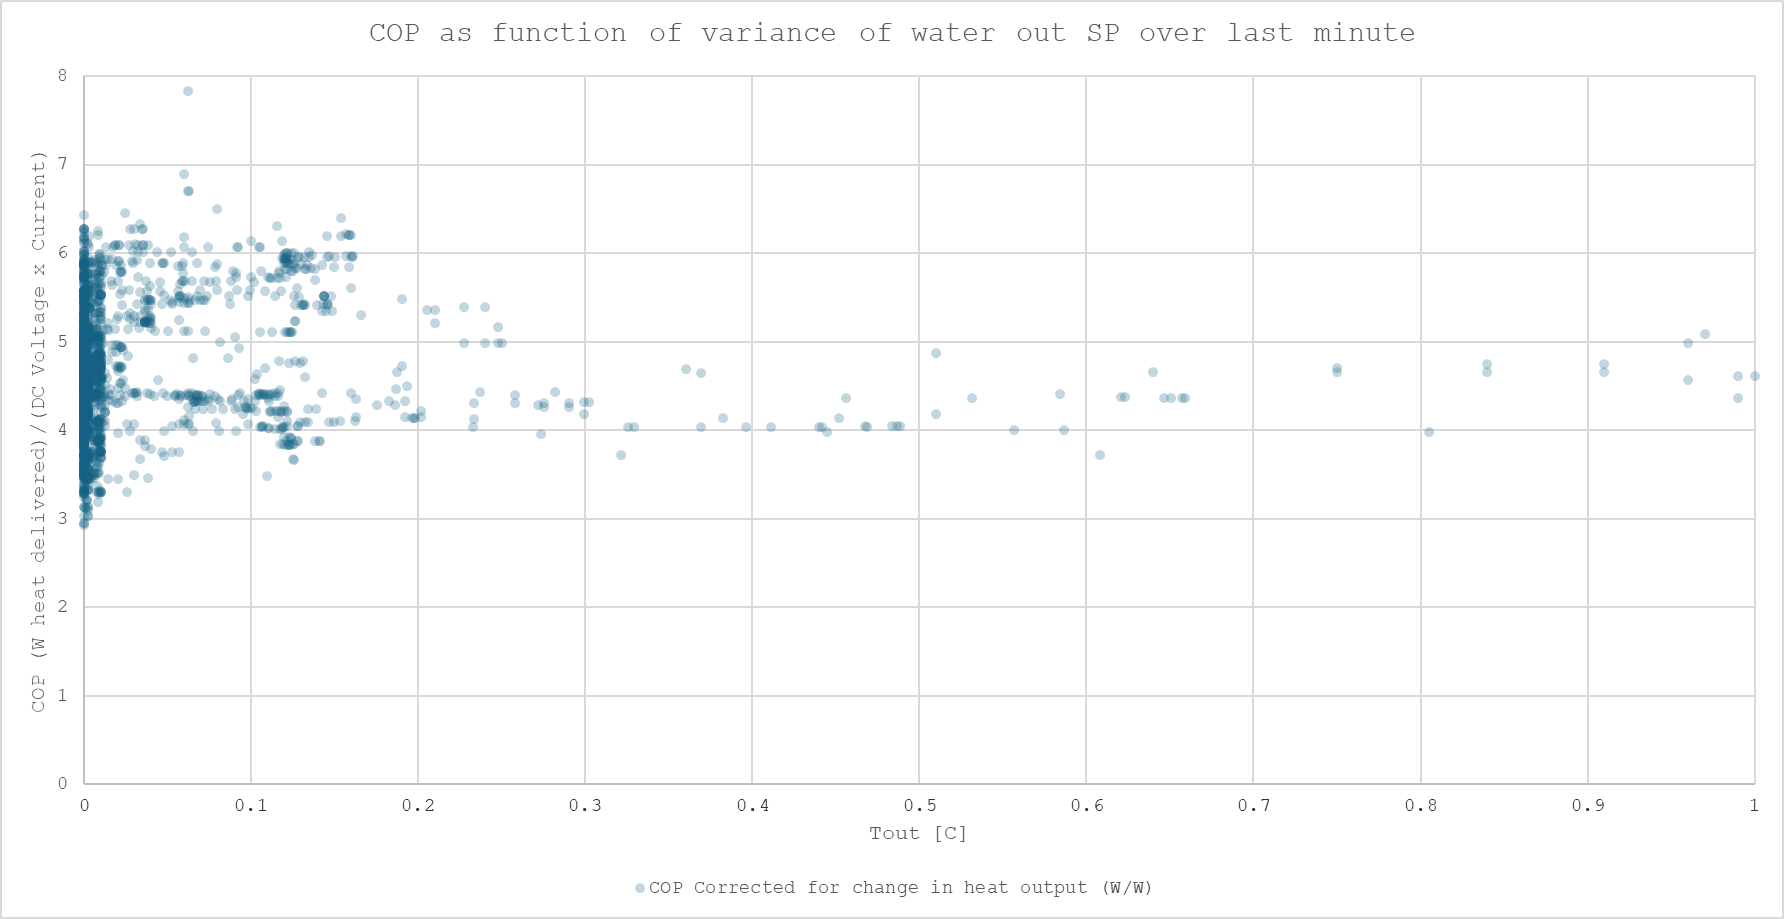
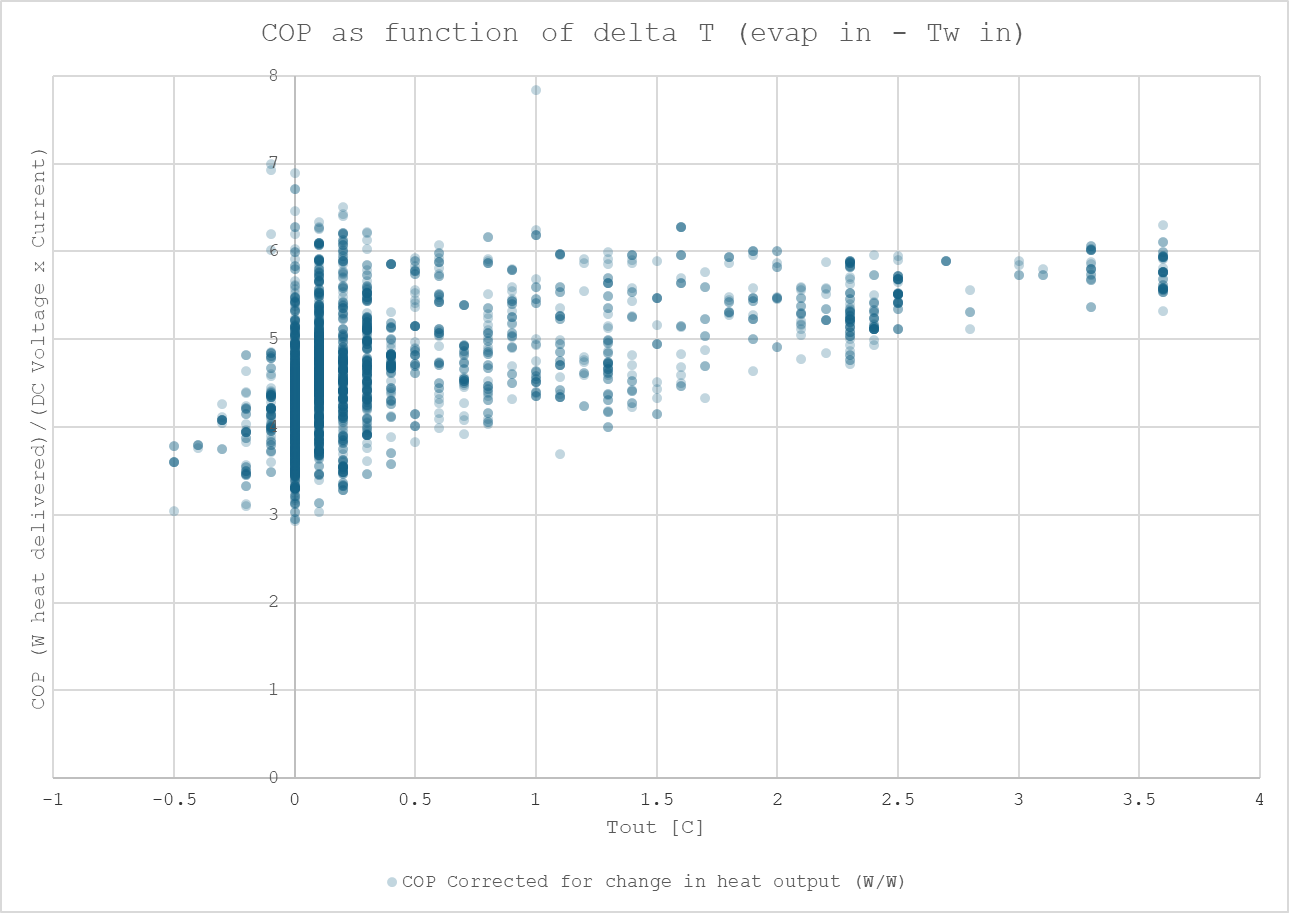
Ok here are various analyses I made based on my Sunday run…
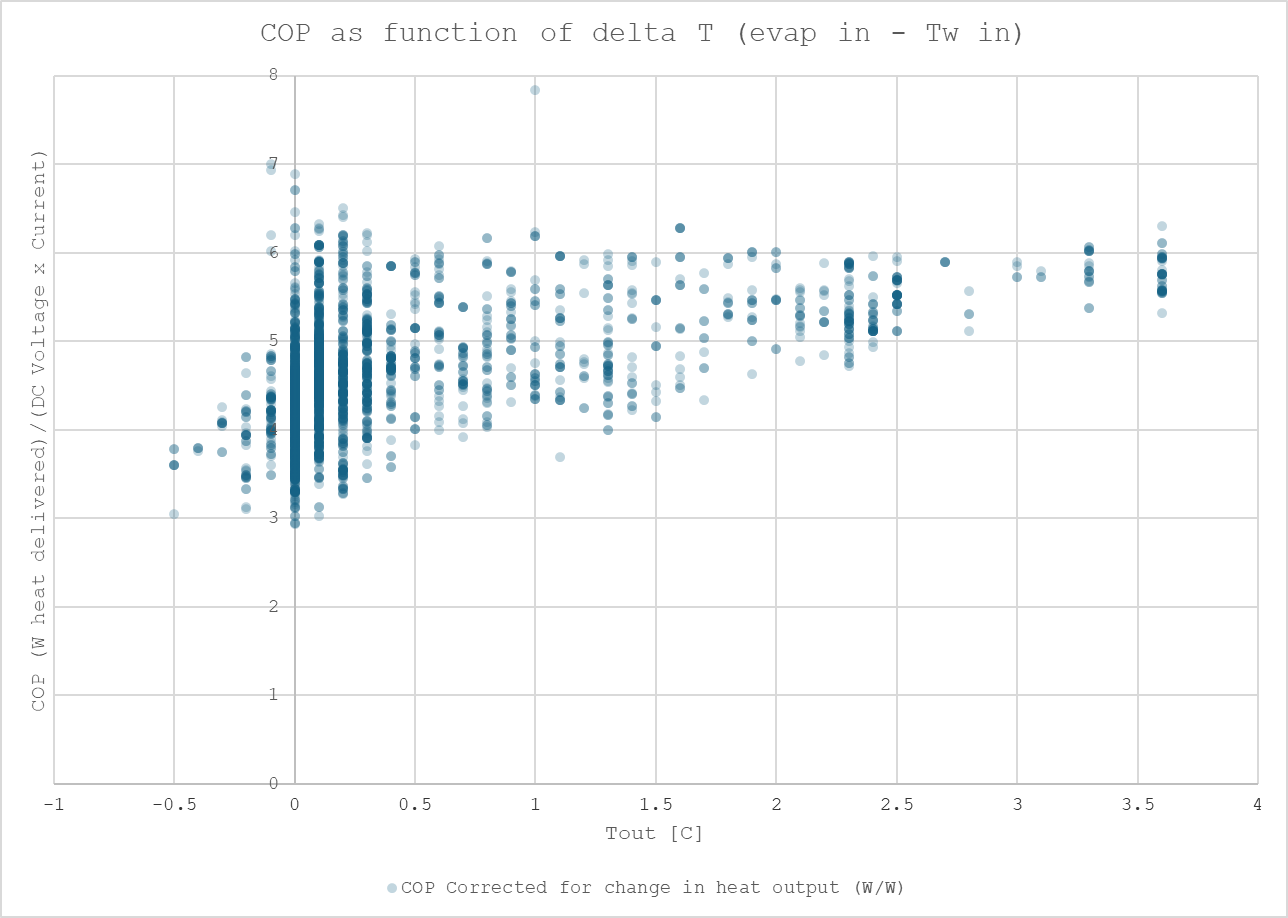
I did tons of analyses struggling to find anything that would clearly influence COP of my machine in a certain direction but this was hard to prove.
I guess that the spread in measured COP itself is already a problem (or one of the symptoms of the problems my machine has?
First some elaboration on some processing I did on the data shown in the graphs below:
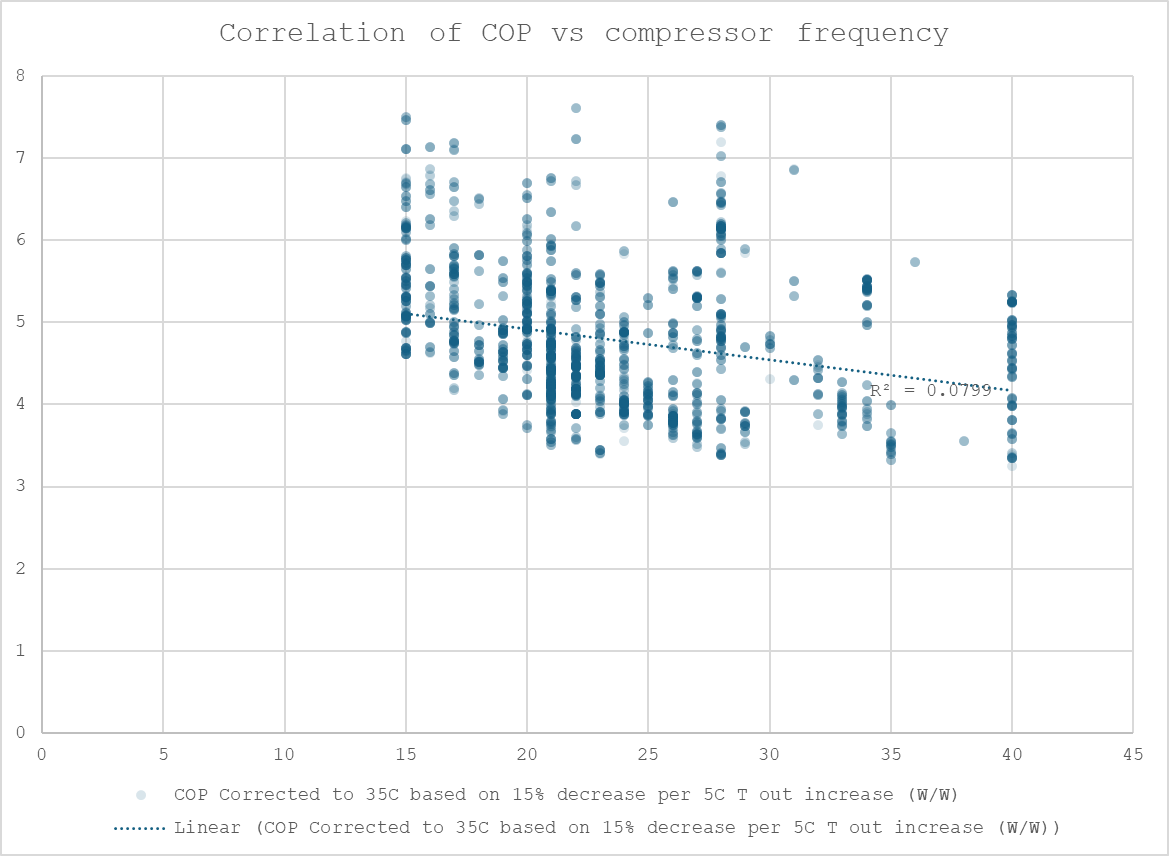
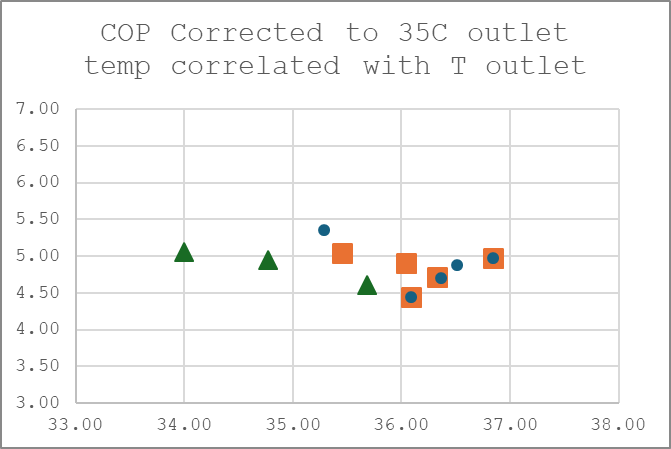
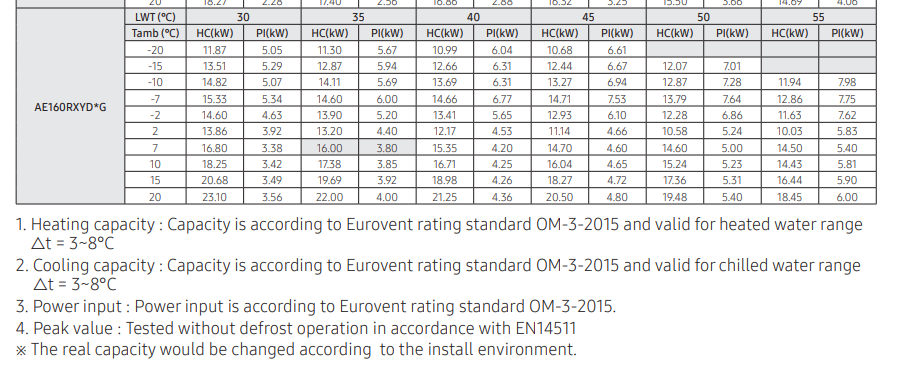
-“Corrected COP” means that I scaled the COP towards what it should have been at 35C output temperature. This is based on some datasheet I found months ago (but am unable to retrieve on the laptop I have with me in the time available on my holiday). In that data I found a nominal decrease of approximately 15% in COP per 5C increase of outlet temperature. Mind that this is derived from figures at as far as I could see high load.
-“COP” was calculated as Flow (l/min) (bluntly translated into kg/min leading to a small overestimation) divided by DC Voltage x Compressor Current.
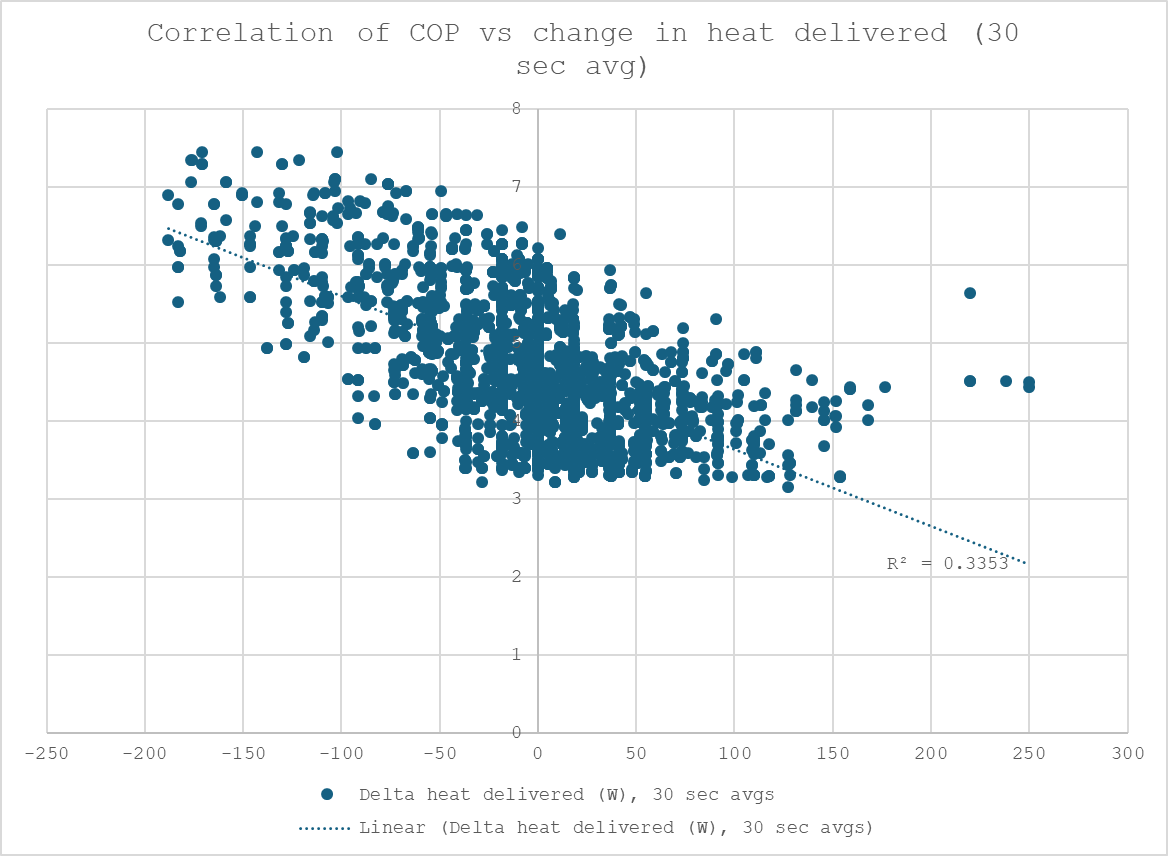
Then a blunt try to correlate COP with lots of things I could come up with. First the most clear one: A decrease in supplied heat always leads to a temporary significant increase in COP. This is logical as compressor work changes first and the heat exchangers with their thermal mass lag behind.
Then a lot of other correlations that generally do not indicate a lot. Most importantly I cannot clearly state that running the heat pump at the same heating power but with lower pump speed to get to the Samsung (actually Ambrava, the Dutch Importer) recommended 5C temperature difference would have lead to a strong increase in COP.
Note on the plots: In many of the plots I decided to put a high degree of transparency on the dots. That gives some impression of where most of the datapoints are located and is -in my view- sometimes helpful to judge the data better if you have a set where many points are clustered around some regions. This clustering can lead to fitcurves having a statistically very bad fit which should be attributed to the machine just being operated too much in certain regions for a “nice” dataset that is easy to work with using standard statistics.
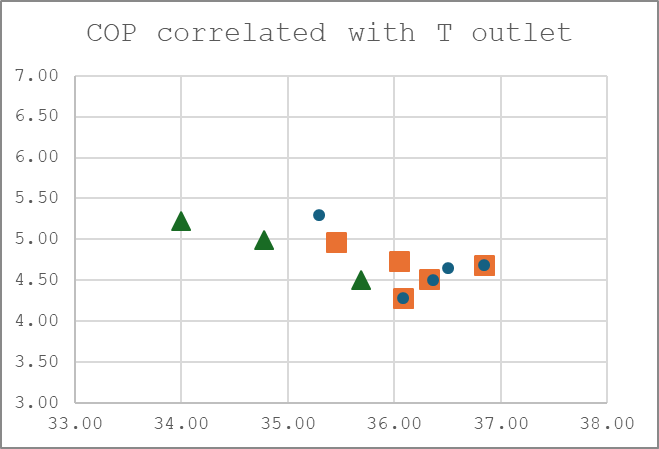
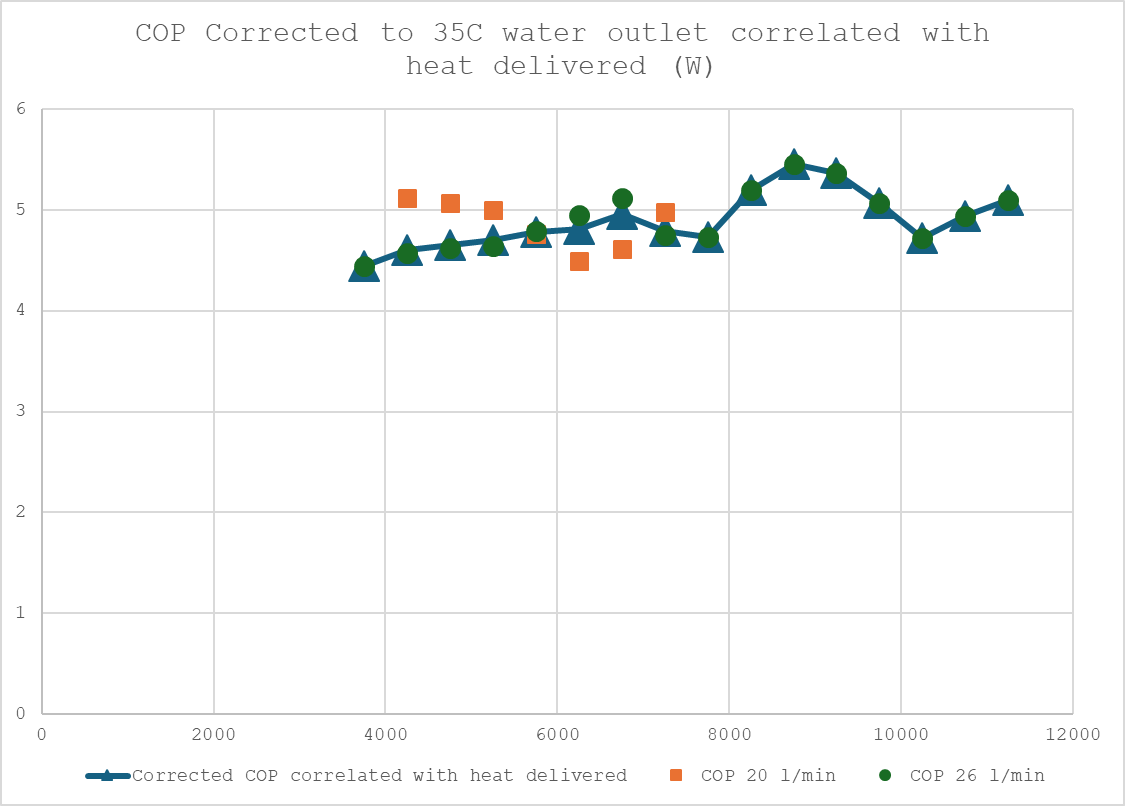
And decided to try the following to make it a bit easier to judge.
I split the amount of heat delivered in 500W blocks and averaged per block.
Then 3 types of markers:
Dark blue triangles is the whole dataset
Orange is only the 20 l/min water flow data points
Dard green dots is only the 26 l/min data points
Again it does not make a lot more clear unfortunately.
From this I can still only derive that a higher heat output (in W) is in general good for the COP provided that this is achieved by getting a low return temperature.
Then there are less data points the trend is more wobbly.
When it comes to optimizing the heat output to get maximum COP: The trend is very gradual.
An increase from 4000W to 6000W would approximately lead to a 10% COP increase. If one would increase the outlet temperature by more than 3-4C or so the 10% COP is gone.
I see again no proof that lowering the water flow would have lead to drastically higher COP’s at part load.
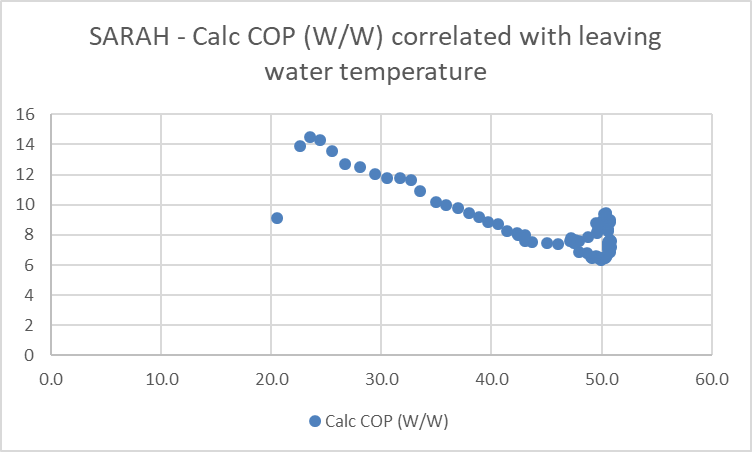
@SarahH I took the opportunity to make a COP trend out of your data:
Used the heat supplied as calculated by you and the power consumed as DC Voltage x Current
Wow, you’ve been busy (on your holiday too - methinks that you haven’t got over the “sugar rush” of your new toy yet…).
I suspect that you may be looking for something that isn’t there, and/or conflating two separate issues. Here are my perspectives (partly my Chem Eng background, partly my observations):
The Samsung controller energy minimisation algorithm works by minimising the compressor discharge pressure consistent with (just) liquifying the R32 against RWT in the condenser, i.e. only a couple of degC subcool. This strategy not only minimises compressor pressure ratio (suction pressure being effectively fixed at any given ambient temperature), hence minimised total energy consumed, hence maximised CoP, but it also results in minimised equipment sizing, in particular the evaporator.
It may thus be more helpful to correlate CoP (and other variables) against RWT rather than LWT (even though manufacturers quote the latter in their sales literature).
For any given RWT and condenser heat duty, the water dT (over the condenser) is therefore not likely to have a dramatic effect on CoP, because the compressor ratio is fixed and the R32 circulation rate is also fixed. In varying the LWT, all you are doing is trading water dT with water flow rate, which may consume a bit more water pumping energy, but this is tiny compared with compressor energy (and may not even be included in the CoP calculation in any case).
The Samsung capacity charts (like the ones in our respective Data Books) are based on synchronous inverter frequency. We don’t know how these vary at other compressor speeds. The affinity laws state that the capacity of scroll compressors (like mine) should vary linearly with speed, but I’m not sure whether twin rotaries (like yours) should do the same. Whatever, compressor efficiencies almost certainly vary with speed, and this will have an effect on power consumption, hence CoP.
As I noted in a previous post, I cannot use Compressor Current x DC Link Voltage to estimate power consumption on my setup. I can correlate Compressor Current with the Outdoor Unit power consumption displayed on the remote controller quite well - I get Outdoor Unit Power (W) = 450 x Compressor Current (amps) + 175. This at an R^2 of >0.95 over a wide range of compressor inverter frequencies (20-60Hz). I can easily believe the 175W offset - the fan takes nearly 100W, so adding losses for the inverter and other electronics could get me there.
I’ve been puzzled by the 450 factor though. Neglecting power factor (which should be close to unity for a modern compressor inverter/motor), this should be the voltage at the point that Compressor Current is measured. If this is the raw power supply (about 254V where I live), then the apparent voltage is 1.77 higher than the supply voltage. This is near enough sqrt(3) to make me wonder whether only one phase of the compressor supply is measured (it’s a 3-phase compressor, even though the Outdoor Unit is single phase). However, the compressor 3-phase generation is in the inverter, where DC Link voltage applies rather than raw supply voltage (and that’s only about 180V ).
I’m planning to do more power-current correlation studies next heating season to try to nail this latter point (too late now), but this 1.77 factor (which perhaps should be 1.7321 for sqrt(3)) may explain why your estimate of my CoP is so much higher than that of your own heat pump.
Keep up the good work and reporting your observations - a real treasure trove of data!