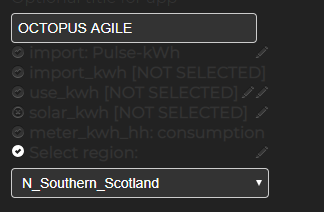
It’s probably easier if I change the app to handle this better. What does the agile consumption feed look like if you have solar, does it go negative when you export more than you import in a half hour, or does it just show consumption per half hour with a separate feed for export?
My solar export goes via FiT with another supplier, not via Octopus, so I don’t know if the consumption data would do something different if I had Octopus outgoing (whether Agile or not). My consumption feed (driven by your Python script) is only 0 or positive (or null for timestamps not yet available).
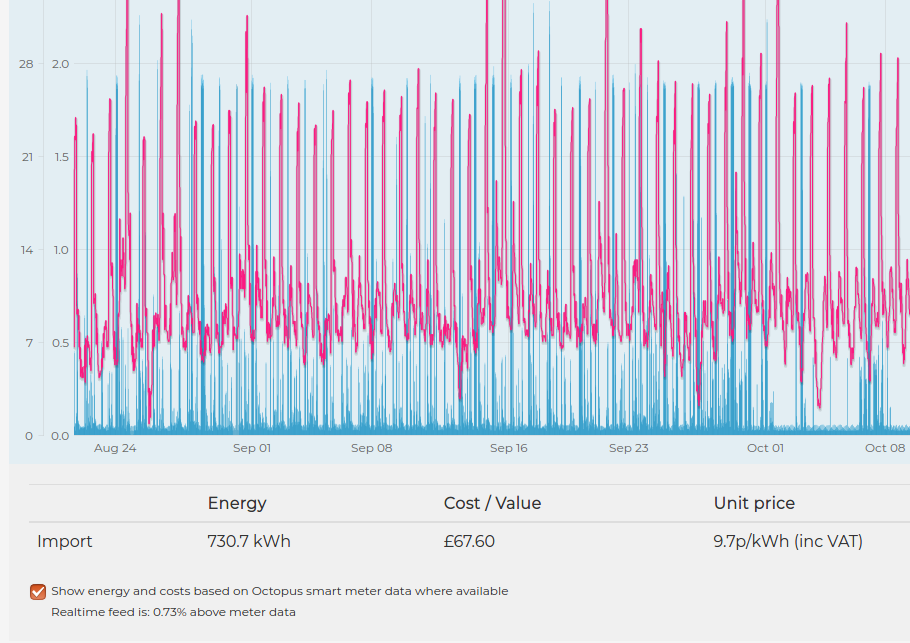
I like being able to see the solar data with the Agile data - imo it’s clearer charting than in the My Solar app (visualising the combination of import, export and solar usage). But it’d also be useful to have the option to turn off the outgoing Agile.
 . This is what mine looks like, fwiw. If I change the solar to Select solar_kwh feed: then it retains the tick, even if I click OK.
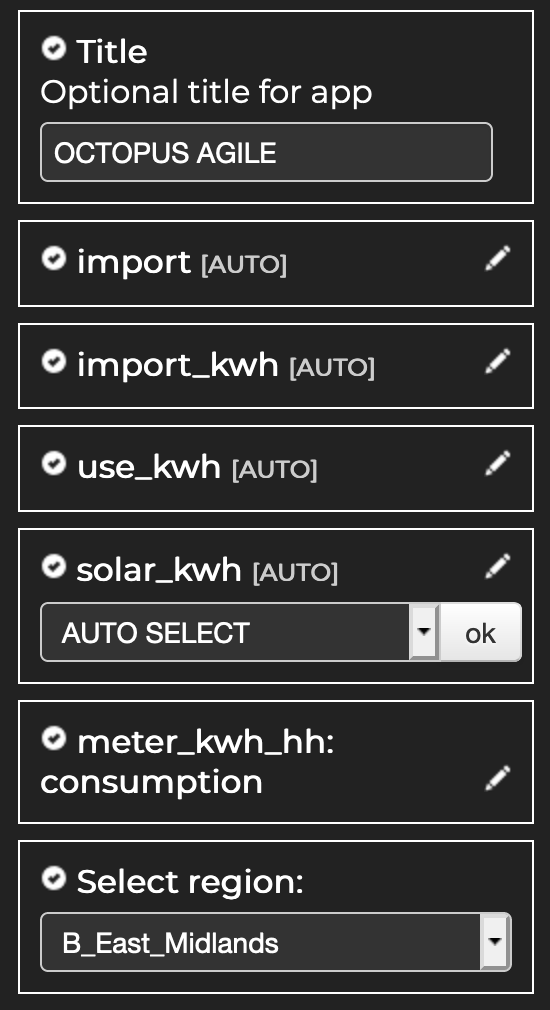
Great good to know.
Looking back, I’m not sure I understand that first bit - what calibration data where? AFAIK there isn’t a console on the Agile App - so maybe it’s important to know what you’re referring to here.
And do you have a link to the thread you mention? Might be worth us reading that to see if it sheds any light. (EDIT - I think you’re referring to this - Python script to import Octopus Agile consumption data into emoncms - #15 by ian - in which case, yes, if solarpv is being graphed, it appears it’s a known limitation that’s in @TrystanLea’s hands to resolve sometime).
Anyone know where the settings for this app are actually stored? In the DB? Or in a config file? I scoured my directory-structure but found nothing yet - I’m wondering if the solar feed can be removed from the app’s purview that way, maybe?
I’ve hopefully improved the feed selection now to allow un-selection of optional feeds. The configuration interface now shows:
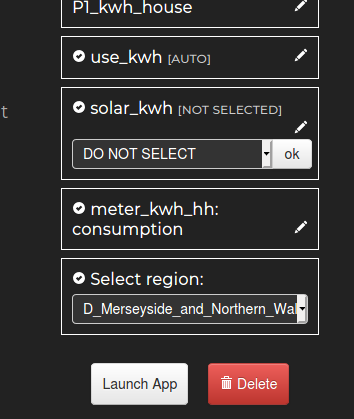
It should now be possible to create two Octopus Agile apps, one for consumption only that ignores the solar_kwh feed and another for consumption and solar but without some of the other features that have been implemented for the consumption only mode.
New feature: Show average profile
The latest version of the app adds an option to show the cumulative or ‘average’ consumption profile for the period under inspection. So for example, if I click on the last 60 days and then click on the new ‘Show Profile’ button (bottom-right), I get the following output:
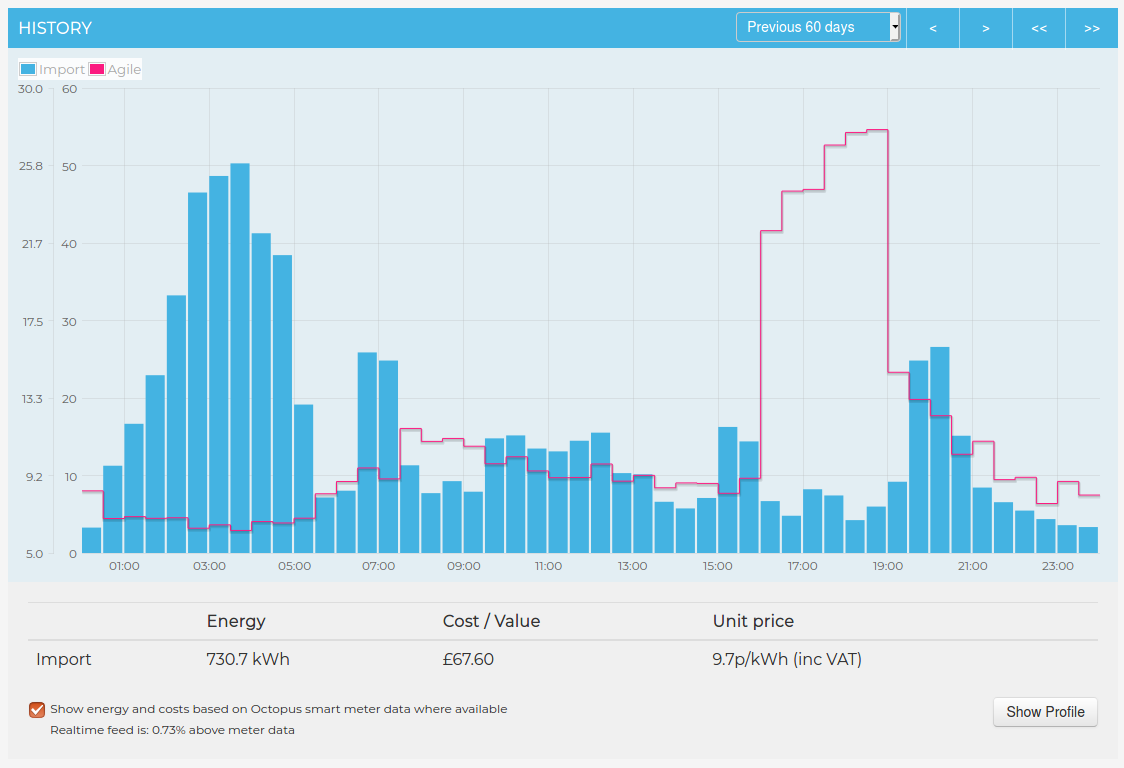
The night time charging of our EV is clearly shown as the large night time peak. We’ve been able to minimise the evening peak by generally fortuitous timing for cooking of evening meals after 7pm (our peak is shifted to 7:30 to 8:30pm instead).
It’s also possible to look at the cumulative cost per half hour:
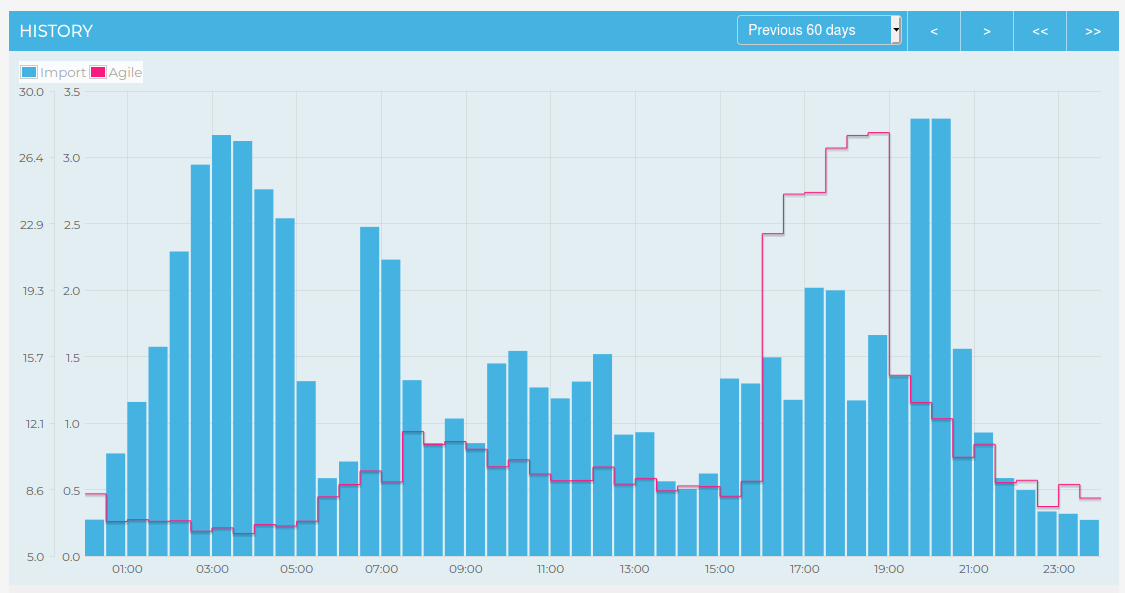
We can see here the effect of the high unit rate costs at peak time uplifting the total cost of those half hours to a similar cost to the otherwise higher consumption but lower prices either side.
The agile unit cost plot shows the average unit price for each half hour based on the selected period.
Could you create a means of being able to publish say, the average cost over the last 24Hrs? Perhaps other ‘sensors’ such as Total energy in 24Hrs?
Oh and I do like the average view idea!
BTW have you fixed the since midnight 1st period error?
[edit]
In Stable?
Dont think so, I will have a look at that.
I was thinking it would be nice if that app could create a daily consumption view that showed the average daily cost and unit price on a longer range graph… youd then be able to look at it over say a year rather than just the last 60 days… is that what you are thinking?
Yes in stable
No, I was thinking of this
As something that is updated say every 30 minutes and posted to MQTT or even sent as an Input so it could be logged and or published as desired.
I think it is a great measure as to how you are doing with Agile.
Have to say, I like the idea, but the UI needs something as it is not intuitive that is what the button does.
Could you add an average to the hover boxes (oh actually, that information doesn’t make sense with a date).
Really like this though.
[edit]
Might I suggest moving the profile button to next to the date selector and use the terms continuous mode & profile mode so it becomes a toggle. Would be useful if it could stay in that mode as you switch time periods and energy/cost views.
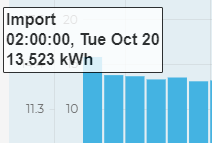
Thanks Trystan, de-selecting feeds works great now. I seem to be reading almost 10% under meter data though!  How to apply the suggested calibration values?
I multiply the Input by a correction value before I log it to feed. I think there may be a rounding error in this as it is telling me that my Pulse sensor is reading more than the meter is.
I’m wondering if I am being thick; where do I configure Smart Meter readings?
@TrystanLea one bug - the pencil gets wrapped.
Have you imported them into Emoncms?
That’s what I am wondering. Where do I do this?
There are several different ways to do it. Start here.Python script to import Octopus Agile consumption data into emoncms
@TrystanLea a front end to the script would be useful 