New install - Do I need to calibrate my CTs or Feeds?

I took liberty to copy over this topic from old forum so you can continue here
Original post from **dmajwool **


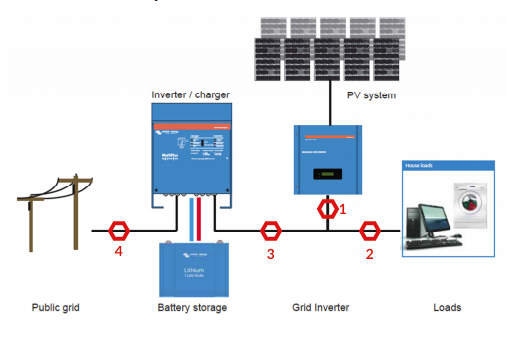
Hi, I’ve been running a new emonPi, monitoring my UK domestic SolarPV setup for just a few days and all seems very good. Very happy with the purchase. But…

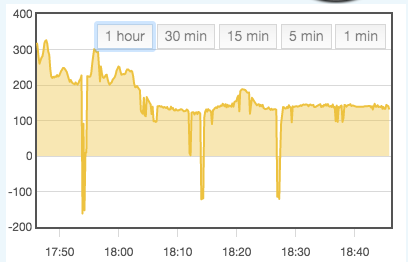
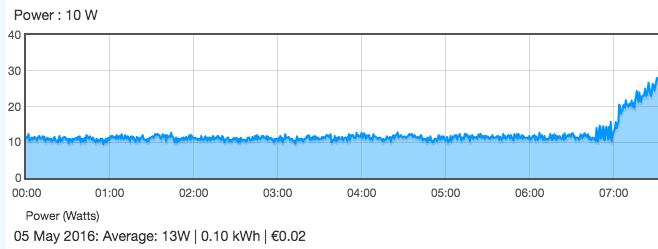
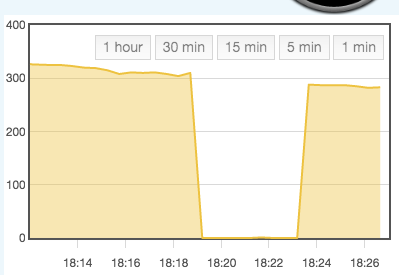
I notice that there is an apparent baseload on the SolarPV feeds which I don’t understand and would like to know if this is normal, or if I must do some calibration. In the below emoncms.org screen grab there is a constant c. 300W trace on the PV during the hours of darkness and this has been the same every night. The 4kW PV has Enecsys micro inverters.

I took solar & grid utility meter readings at the start and end of this screen grab and these give

solar generation: 22.3kWh

Grid import: 5kWh (= 1unit Economy7 plus 4units daytime)

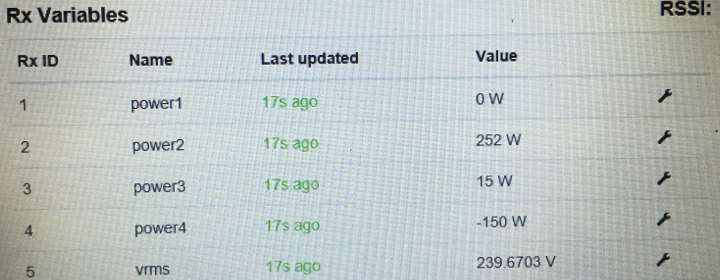
In the same period, my emonPi CTs recorded

solar generation: 24.4kWh

calculated Grid import (ConsumerUnit CT “minus” Solar CT): 2.5kWh

I’d be grateful for any advice.

Thanks,

David.


Submitted by Robert Wall on Thu, 05/05/2016 - 01:05.
All the components used in your emonPi are subject to manufacturing tolerances. The calibration settings are calculated to give the correct readings provided every component is exactly on the specified value. Normally we expect the variations of individual components to cancel each other out to some extent. In your case, the difference is apparently about 10% but it’s confused by the standing generation.

The 300 W standing PV generation is worrying, we don’t expect to see anything like that much normally, and it represents about 7.2 kWh over a day. That puts the scale error something like 20 - 25%, and that’s way out. I think you need to find out where the 300 W is coming from before you change any scale factors. The first step will be to take the CT off the cable (don’t unplug it) and leave it in mid-air as far from any magnetic fields as possible, and see what you get. If possible, assuming it’s on the line cable, try it on the neutral instead - facing the other way of course. Do the same to the other CT just to see if the same thing is going on there.

The easiest place to make the adjustment for scale factor is in emonhub.conf file (accessible via your browser), and change the value for the PV input from node 5 (" [[5]] " - the order of the values corresponds with the list of names a couple of lines above) - from 1 to something like 0.91. But don’t do this until you’ve investigated the standing value.

Hi Robert,

Thanks for the background information. It’s very useful to get some parameters for what is “normal”.

I’ve done a couple of tests:

  1. Leaving the Solar CT where it was (pressed in quite tightly in the wiring very close to the Henley block), I flipped the main Solar breaker switch, disconnecting the Solar AC from all my other cabling. Result: emonCMS registers 30 to 35 Watts.

  2. As per your suggestion I unclipped the CT and suspended it in mid air a metre away from everything. Same result: emonCMS registers 27 to 32 Watts.

  3. I found a new location for the CT about half a metre upstream of the Henley block, away from the wiring congestion, on the output of the Total Generation Meter. Result: With the solar inverters disconnected, the CT reads 30 Watts. In the c.3 mins between repowering the inverters and the panels starting to generate, the CT reads 295 Watts. After that, here in daytime, the kW start to flow.

We’ll need to wait until tonight to see if the night time background reading will reduce near to 30W or if it will settle again at 300W. The Enecsys spec sheet gives my inverters a Maximum Night Power Consumption of <30mW each (I have 16).

So I guess the above tests indicate that the Solar CT is working correctly?

Thanks again for the advice.

Cheers, David.

I have the same problem and it was already the case with another CT monitoring system

When i added an Amp meter in the circuit there was hardly any amp usage and the CT gives 30 W (have 3 inverters installed right now)

Someone told me it is ‘circular current’ (don’t know how to translate better sorry).

Maybe a real geek can explain ? :sunglasses:

I’m a Chartered Electrical Engineer, not a geek. But I’ll try to explain.

In English, what you might be seeing are “circulating vars” (Volt Amperes Reactive).

When you have a highly reactive load, the current wave is displaced by 90° from the voltage wave. Although there is both a voltage and a current, no real power flows (*), but there is still reactive power (VA - the product of current and voltage). The current flows in the loop formed by the load, the line and neutral conductors and the secondary winding of the final distribution transformer, and it will of course generate heating and other losses on the way, which the power company has to pay for because they cannot recover the cost from the customer (no power is being drawn).

(*) Actually, real power does flow in a quarter-cycle and it is returned in the next quarter-cycle, so there is no nett power flow.

Thanks Robert

It is inherent to our inverters I guess and there isn’t much we can do to avoid ‘measuring’ this effect ?

Are you measuring voltage as well? i.e. is that real power or VA, and do you know the direction of power flow (if it is real power)?

If you’re not measuring voltage, what you’re seeing is most likely the apparent power drawn by the inverters for their housekeeping duties - I know they say 30 mW but they don’t say how much current is being drawn, it could well be 300 VA / 16 ≈ 80 mA each.

On the face of it, your CT input is fine if a little high.

Hmph. I thought I’d replied to David here. Must learn how to drive this forum one day.

If you measure voltage, hence have the ability to measure real power and the direction of power flow, then you can do something about it in emoncms - e.g. you can ignore consumption by the PV input, add it to the house consumption, or whatever.

Now comes the hard part to explain the setup. Image below is +/- what I have (it’s a bit more complex but it gives the idea) Not all loads are solar panel side but a part of the house. The rest of the load is direct public grid. I use 4 CT (the red things on the image)
I don’t use 1 inverter but an inverter pro panel (3 for now).
CT 1 is basically giving me the solar production and it is that CT that measures + 10W production at night. I tried to switch from phase to neutral but same result.
Also during day time it jumps with moments way negative though my solar system controller (Victron) still shows loading batteries (second image shows the negative jumps)
Weird readings …
So at night when panels are ‘off’ the inverters are still ‘linked’ to the 230 V via batterie generated current.

I just hope all this is clear :slight_smile:
And sorry if I use wrong terminology (I’m not a native English speaking person)
It’s only third week I play with OEM and still learning a lot but hence if you see how easy you can get these details, love OEM

The same question applies to you as it did to David: Do you know whether the current you are seeing on CT1 is coming from or going to the solar panels and their inverter. You need an ac adapter on the supply to measure the voltage to know that. If you don’t have that ac adapter, you cannot know the direction of power flow. What I am saying is the 10 W you see might be consumption by the inverter, not production. The inverter must consume some power in order to be able to wake up and synchronise when the sun comes up.

Without knowing exactly how wide those negative spikes are, or anything more about your system, it is hard to say what they might be.

Have an AC adapter and it is flowing from inverter according me. I tried to turn the ct clip once and I had negative values. Set it back so it gives positive values when solar power

you can see my dashboard (still a bit messy and under construction)

upper row = solar production
second row = what comes or goes to the grid (positive is from grid and negative is to grid)
third row : to load/batteries
fourth is solar production but not sql, phpfina = experimental …

You could have 10 W of consumption hidden behind a lot of noise. If you take the CT off the cable as David did, you should see if there is any noise and how much. You must be using an emonTx - which input is the Solar infeed?

I will look tonight when I come home and after sunset.
There might be noise arount with the converter not to far away.
indeed an emonTx and solar is input 1.

Thanks again Robert,

To set a bit more context, I’m a user rather than a programmer or engineer. The hardware resources I have are what came with the emonPi Solar Kit and I’m not sure if what you are asking requires additional equipment or resources.

To answer your questions, I don’t know if I’m measuring voltage and I don’t know the direction of current flow.

I have the 2 CTs and the 230v - 9v wall wart and all three of these are plugged in. As far as I can tell I have installed the equipment correctly.

I notice that in the emonPi’s nodes page, node5 RXid 4 is vrms and this shows 230volts. But it shows 230volts when the 9v wall wart is disconnected too. So I don’t know where this node is sensing its value from.

The CT on my SolarPV cable still registers a constant 300W overnight and we can probably assume that these watts represent an overstatement of standby power used by the inverters that is not being fully registered on my utlility meter.

If I need some additional component to be able to help emonPi to factor its readings to match the utility meter then I’ll do that. But at present I don’t know what to do.

Continuing thanks, David.

As you are seeing 230 V always, I think you are not measuring the voltage. I would not expect to see an accurate and constant 230 V if you were. (The UK “centre” voltage is still 240 V and likely to remain so for the foreseeable future.) Are you sure your “wall wart” as you call it is 9 V, and not 5 V d.c. power supply with a USB connector? If so, that is the power supply to the Pi and not an a.c. adapter measuring the voltage. Even if you have the 9 V a.c. adapter, unless it is powered at the same time as or before the Pi, it will be ignored and the default 230 V value will be assumed. Without actually measuring the voltage, you cannot know the direction of power flow and what you assumed was night-time generation will be in fact the ‘keep-live’ consumption of your inverters.

A few hours later and did it daytime.
Unclipped CT and moved it around, near cables, away from cables, clip closed and next to the cable I use to monitor, near Victron with large transfo in it (ring)
A nice 0 W


inverted the clip and got negative readings

back as it was. Guess I’ll have to live with these 7-10 W :slight_smile:

Yes, I think so. It’s clearly genuine as you read zero off the cable and the sign reverses on the cable (noise would not do that), so when you decide that you cannot live with it, you can subtract 8.5 W in emonCMS.

I know this must sound silly (don’t dare to use the other word :wink: )

In emoncms you can do calculations on you feed, but I can’t get the result.
I tried to add a process after the log to feed like

Calibration + and set it with a value of -8
but now how do I get it back to the feed ?
I think it is taken into account for 6 and 7 but I’d like also to have an updated 4, to compare with a non calibrated feed (once I’m sure it is correct I’ll delete other feed)

thanks for a reply on a very basic question … couldn’t find an example anywhere …

log to feed (solar)
+ -8
log to feed (adjusted solar)
Power to kWh (solar_kwh)
Power to kWh/d (solar_kwhd)

ok, I see now how this works.
Added the correction like you suggested.
I will see tonight how it goes, have a readout of both corrected and uncorrected values.

Thanks Paul

not quite good the result

I did as you said in the feeds but minimum value is 10W regardless it is showing less then 10 on regular feed.
Did I understand your idea wrong ?


might this approach be better ?

log to feed solar
if solar > 10, skip next
reset to zero (or is null better ?)
log to feed solar_corrected
power to solar_kwh
powe to solar_kwd