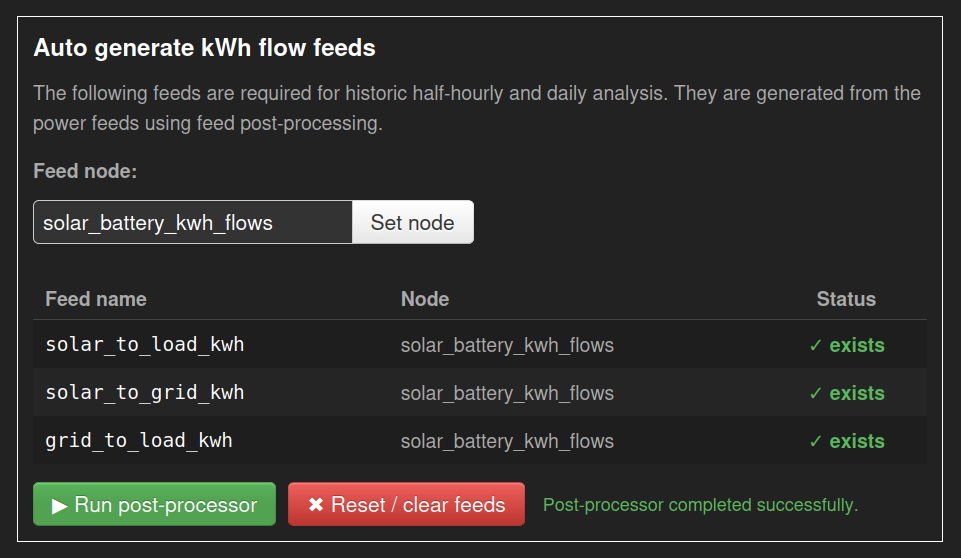
Updated. Still can’t get the app to update those feeds. Have to run postprocess manually.
I have some minor issues with the tariff app as a replacement:
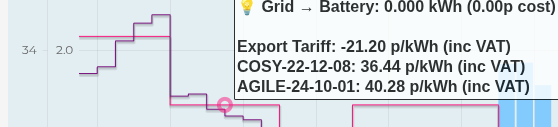
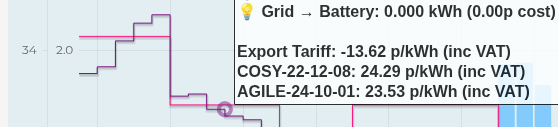
The tooltip doesn’t show the correct price for TOU tariffs, especially the peak period.
Seems to be massively out of sync, and not just by British Summer Time.
This does not give me confidence that the cost analysis is correct.
The tooltip is packed full of information, and can be overwhelming. Maybe hide zeros?
My actual tariff (COSY-FIX-12M-25-09) isn’t available as a choice, but it is pretty niche.
Can I bring my own price feed? Would love to compare it to standard COSY tariff.
The time period navigation is different. The drop-down is nice, but I miss zoom in/out.
I cannot pick which export tariff to use - it assumes Agile, doesn’t have Fixed, Flux, etc
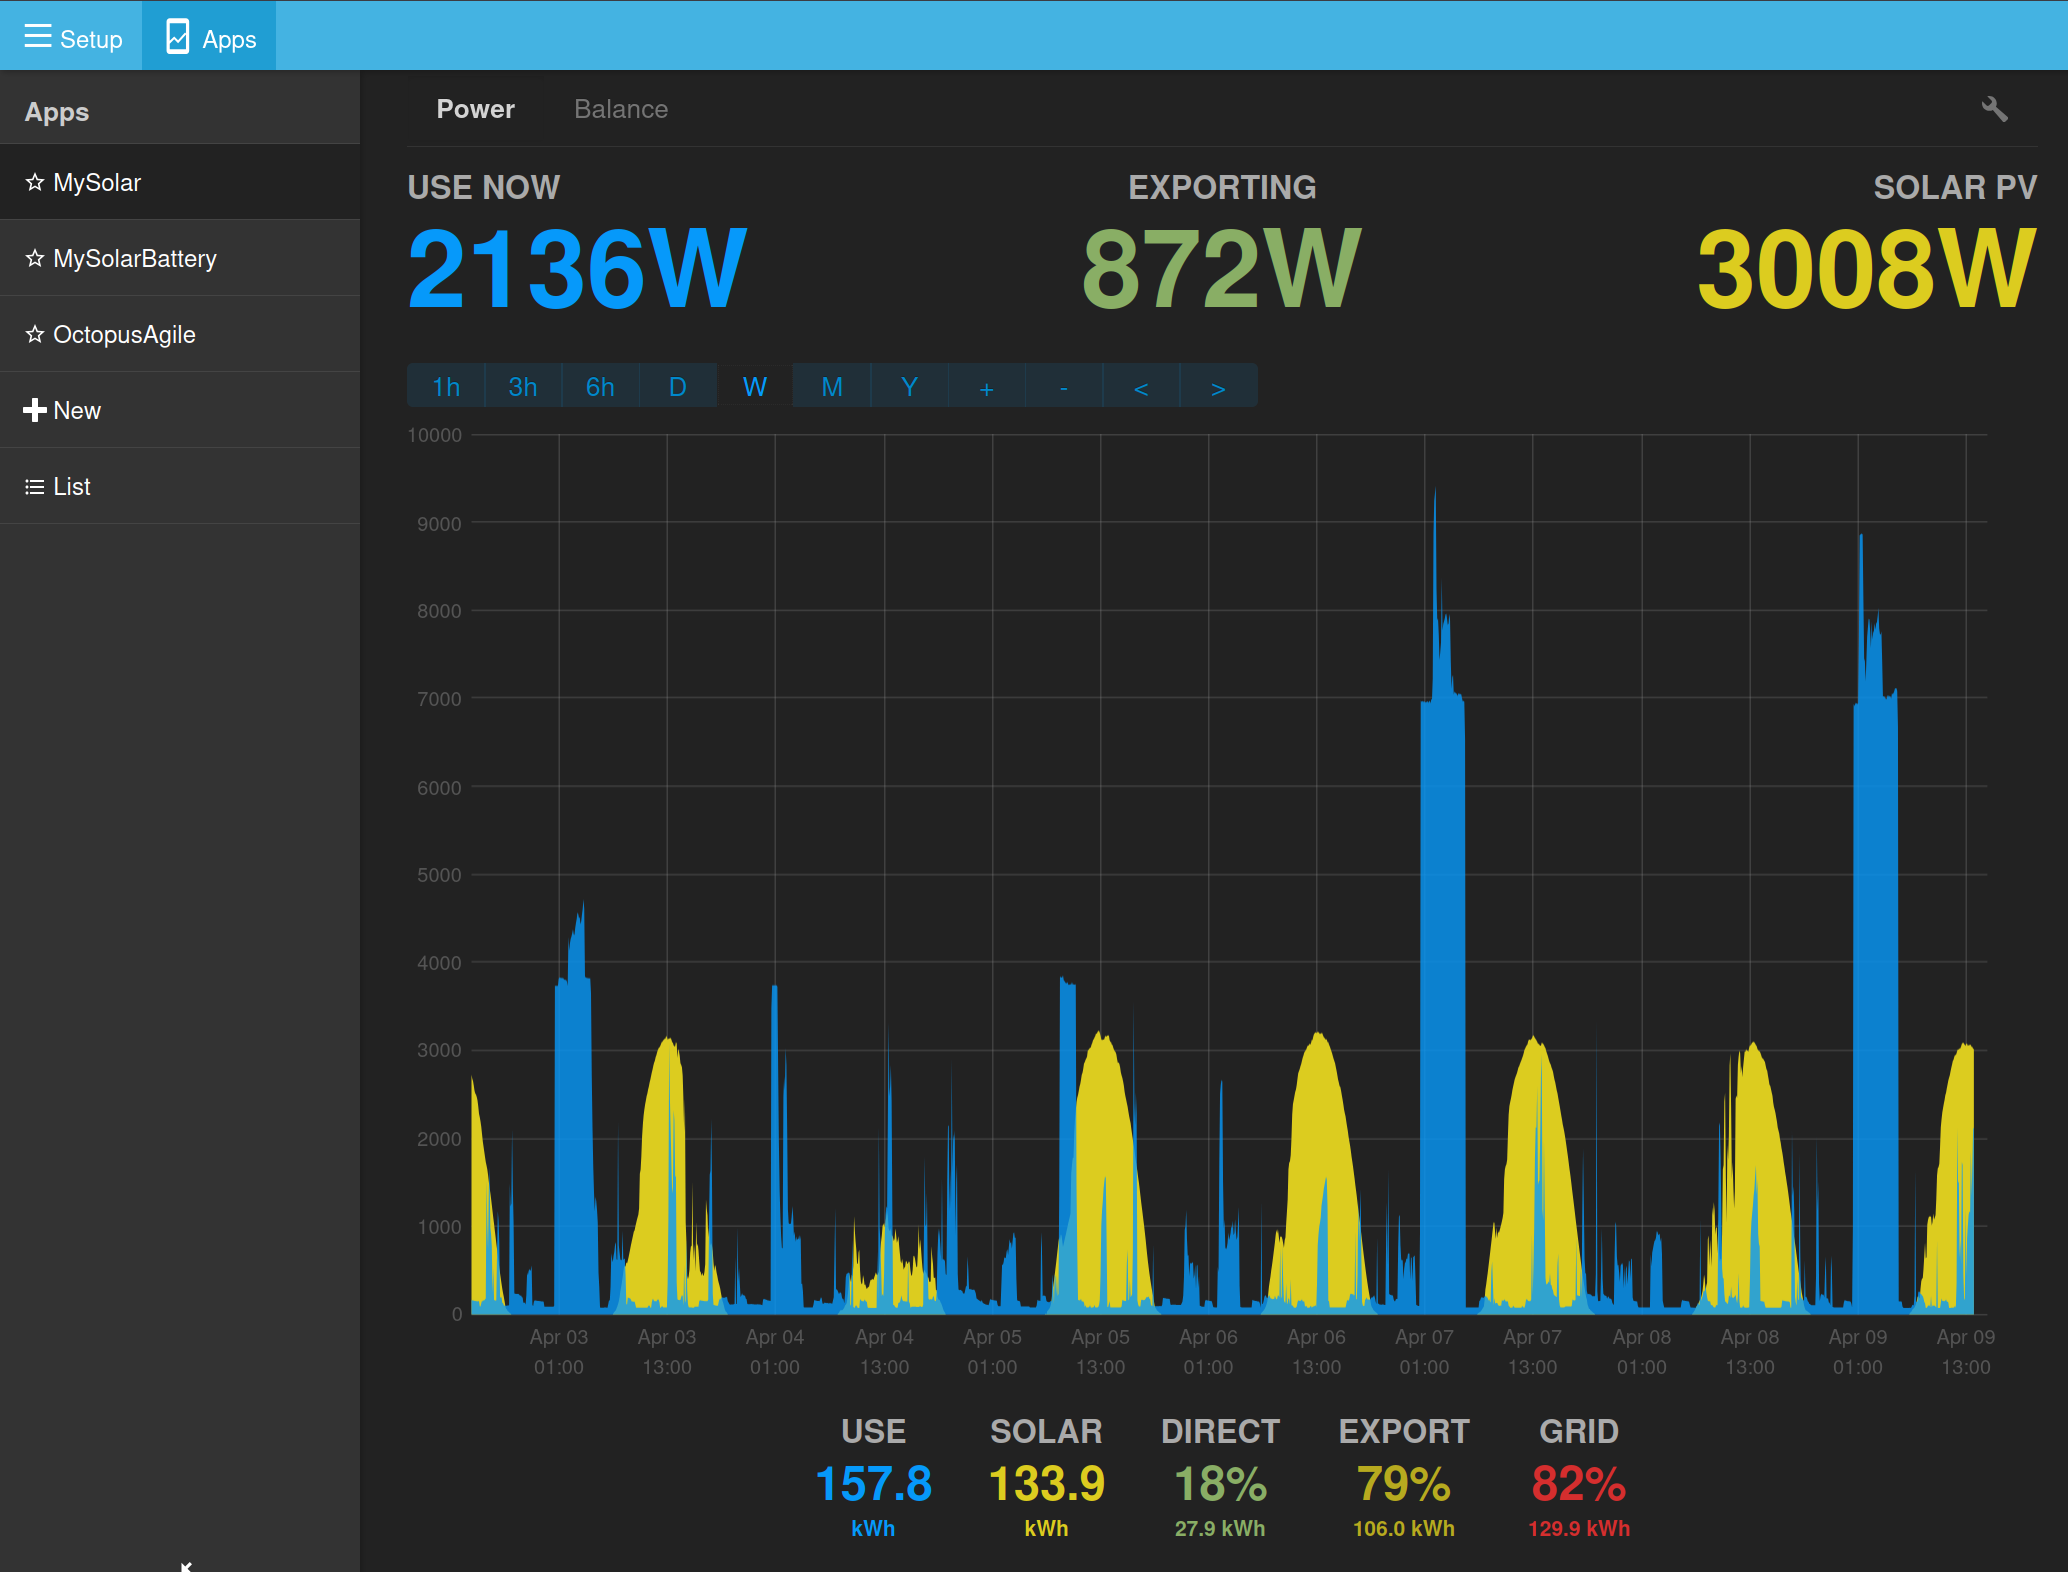
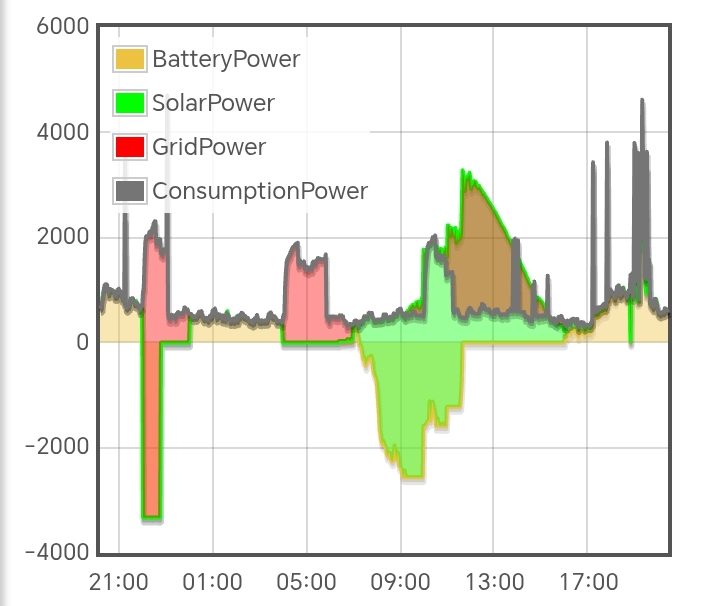
Power graph relies on post processed kwh half-hour data, so cannot show live watts.
I feel that use cases for these two apps are sufficiently different, that they might be best kept separate, even if they do reuse a lot of the same code and config. I use My Solar Battery app as a dashboard for continuous monitoring, whereas the Tariff Explorer is more for longer term analysis. The power graph is less useful over periods greater than a month - a bar chart of daily history might be more appropriate here.
A tariff builder would provide ultimate flexibility, though would be nice to import an existing one for when the times are the same, but the prices are slightly different.
Can I leave it open and see it update in real-time with new data?
Hmm, not sure why the post processing is not working, sanity checked here by setting all the names of feeds the same. Could you double check that you have the latest postprocess master branch? and perhaps also latest emoncms core just in case?
@TrystanLea I’m very happy to test it as I use this app multiple times daily despite its limitations.
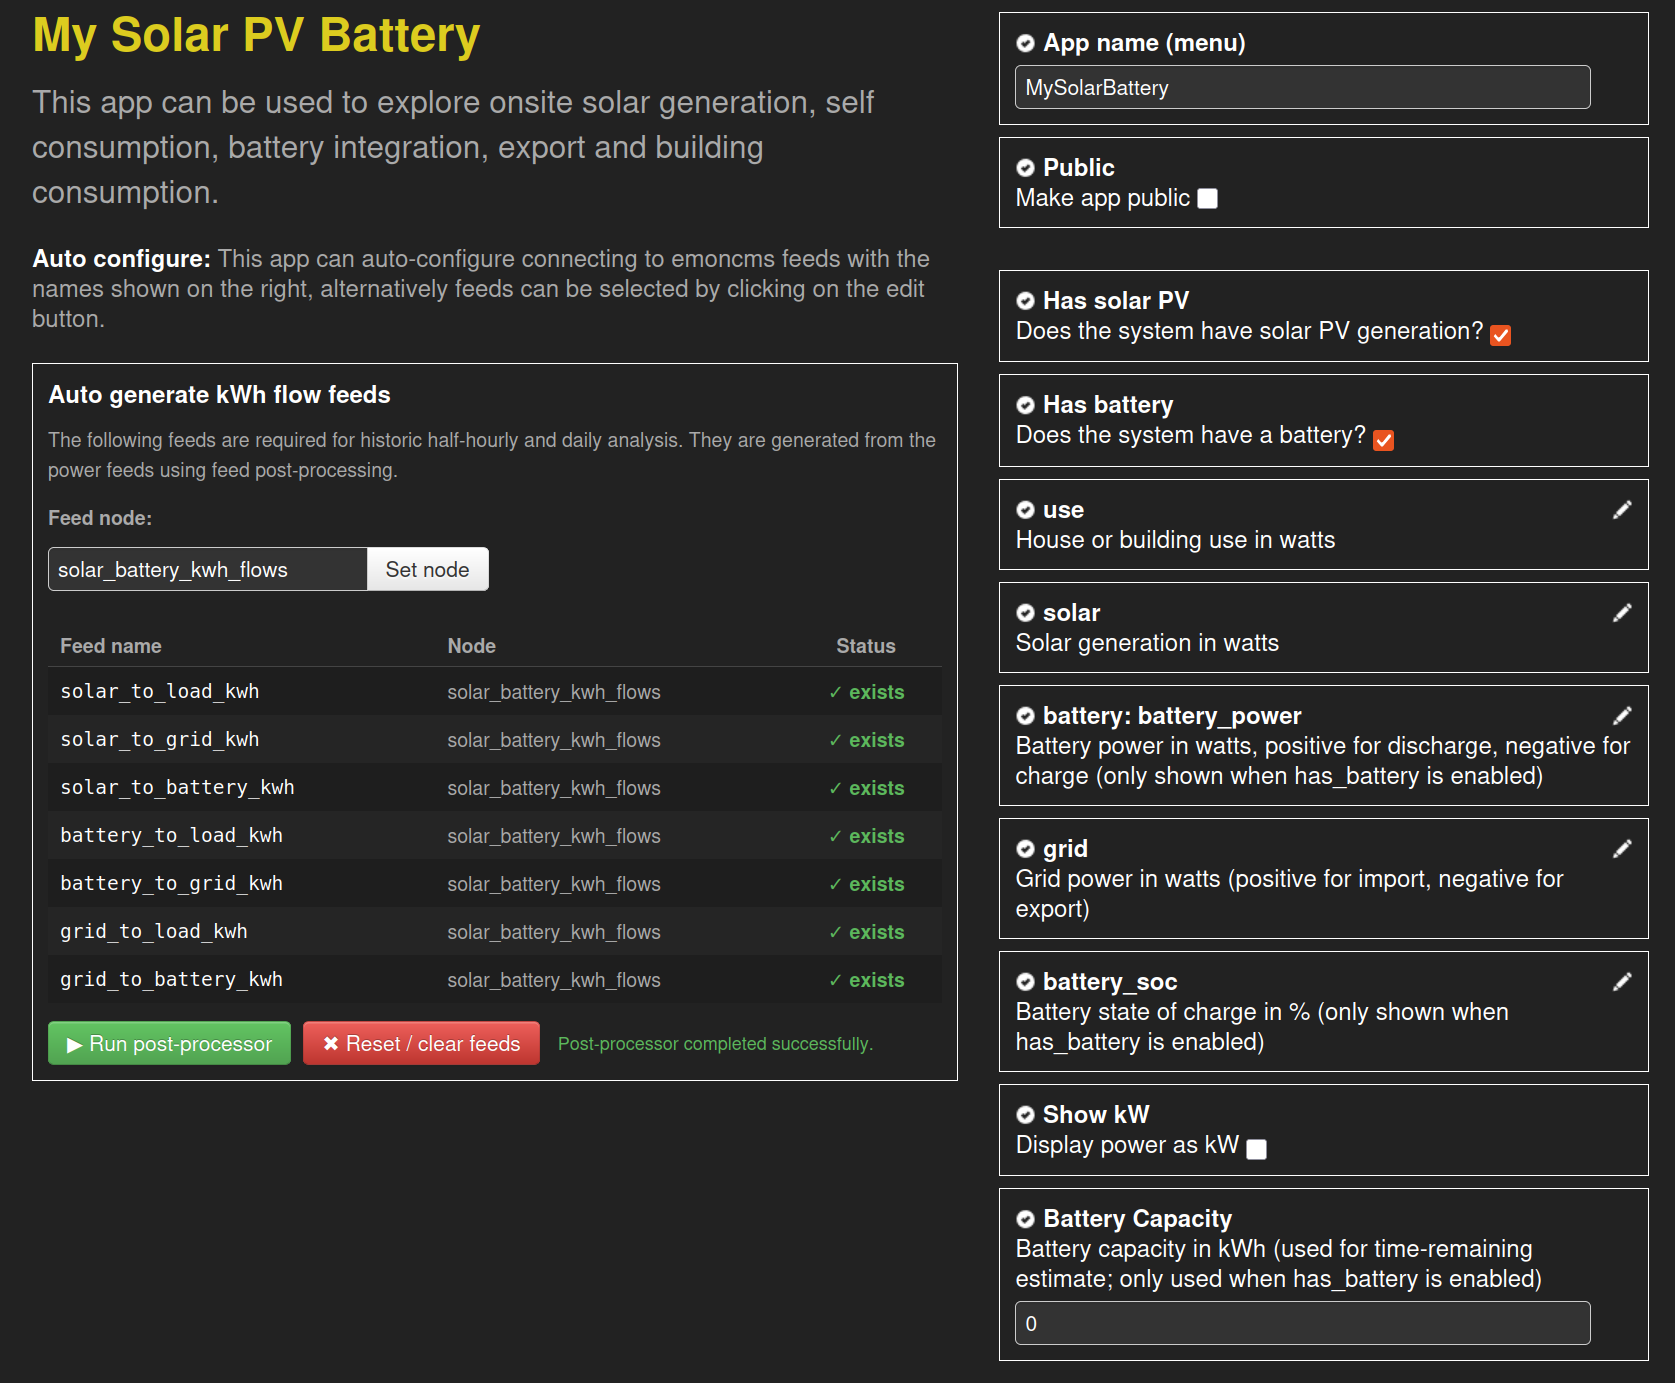
I followed your instructions (after doing a backup) to the letter (I think), but on creating the app I get
EmonCMS Error
-------------
Message: TypeError: feed.by_tag_and_name is not a function. (In 'feed.by_tag_and_name(config.feeds)', 'feed.by_tag_and_name' is undefined)
Route: Modules/app/apps/OpenEnergyMonitor/mysolarpvbattery/mysolarpvbattery.js?v=14
Line: 118
Column: 45
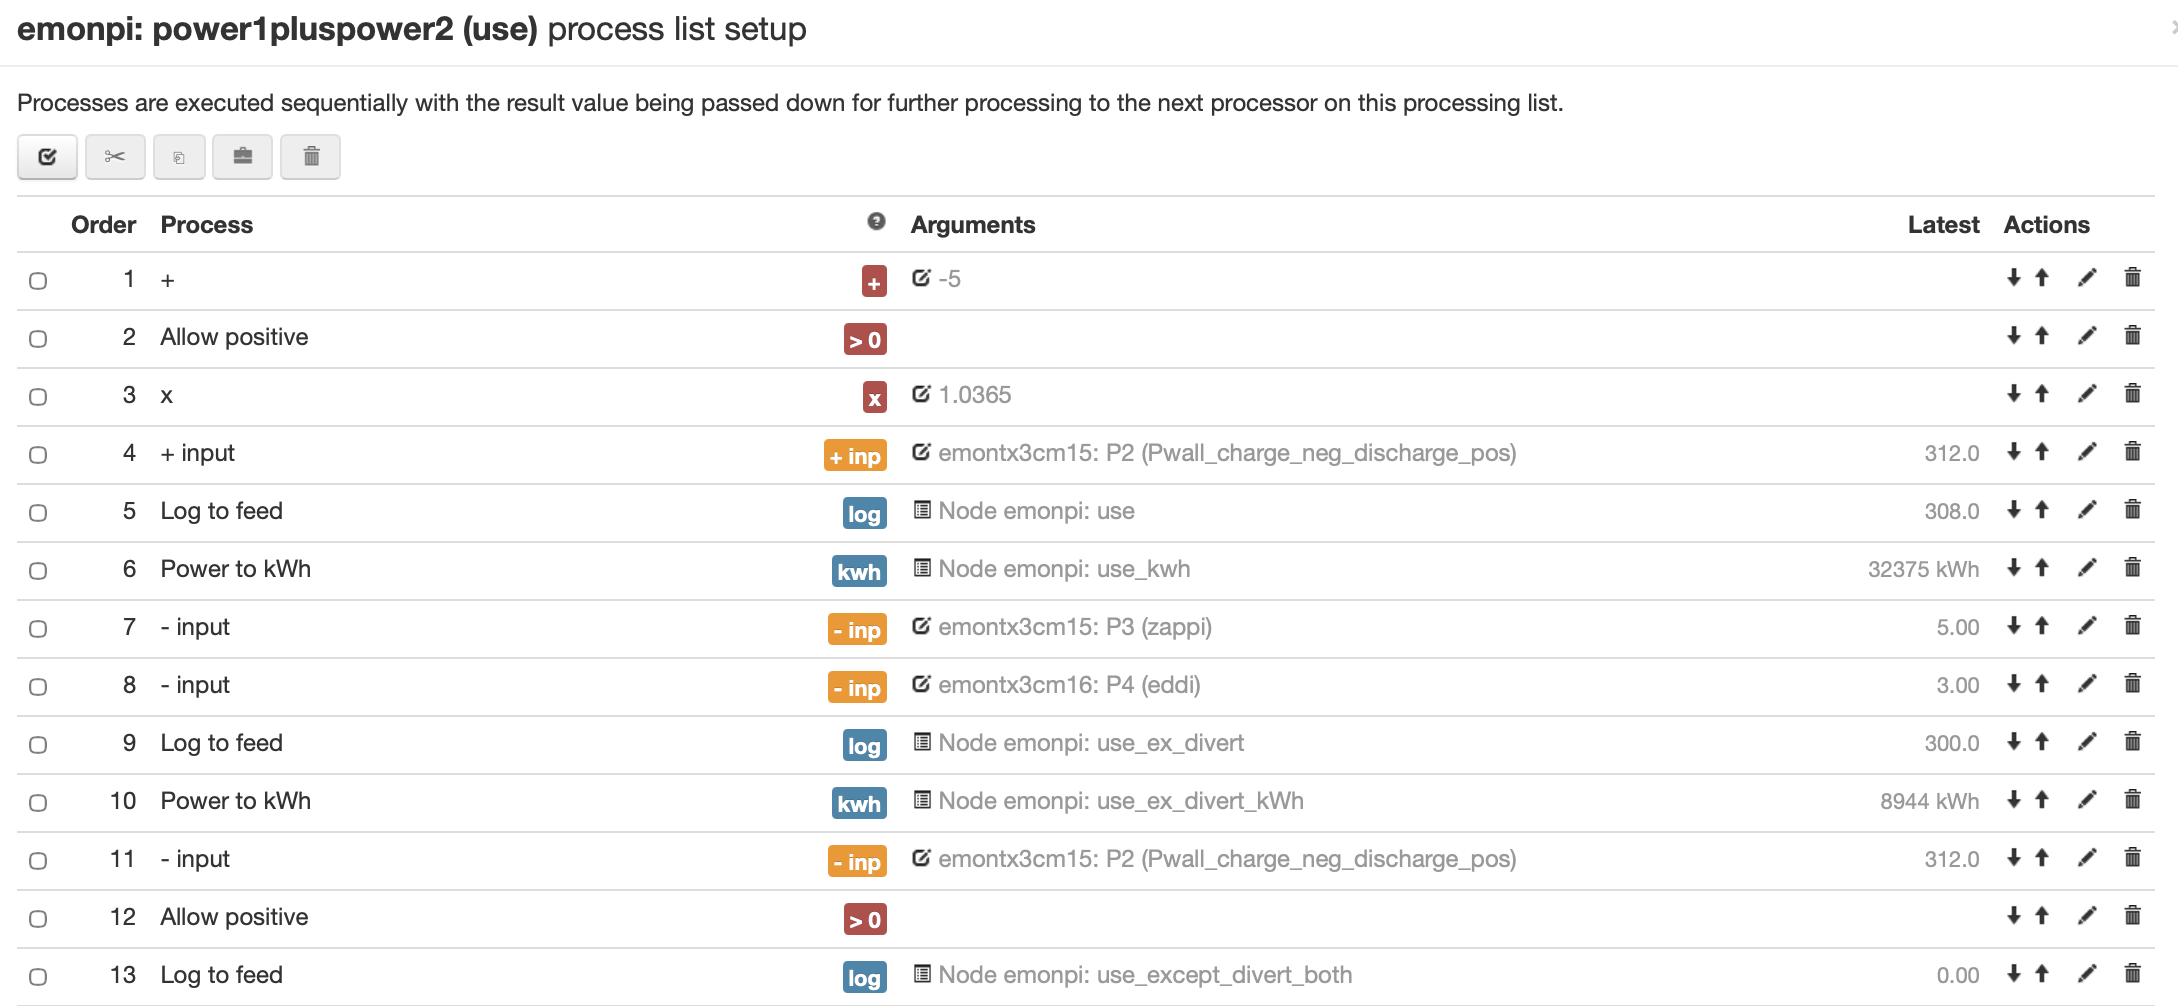
But there is a problem, which is I think due to my modifying the emonpi’s standard input processing to try and make the old app work better for my situation (solar + battery + diverts to hot water and EV charger). Here is the first part; first 3 lines are some mods to apply calibration results the inputs; next I remove what the Powerwall is contributing to leave me with what the house is actually consuming, logged to ‘use’. I suspect this is the cause of the problem, as you are probably assuming ‘use’ to be the raw ‘power1pluspower2’?
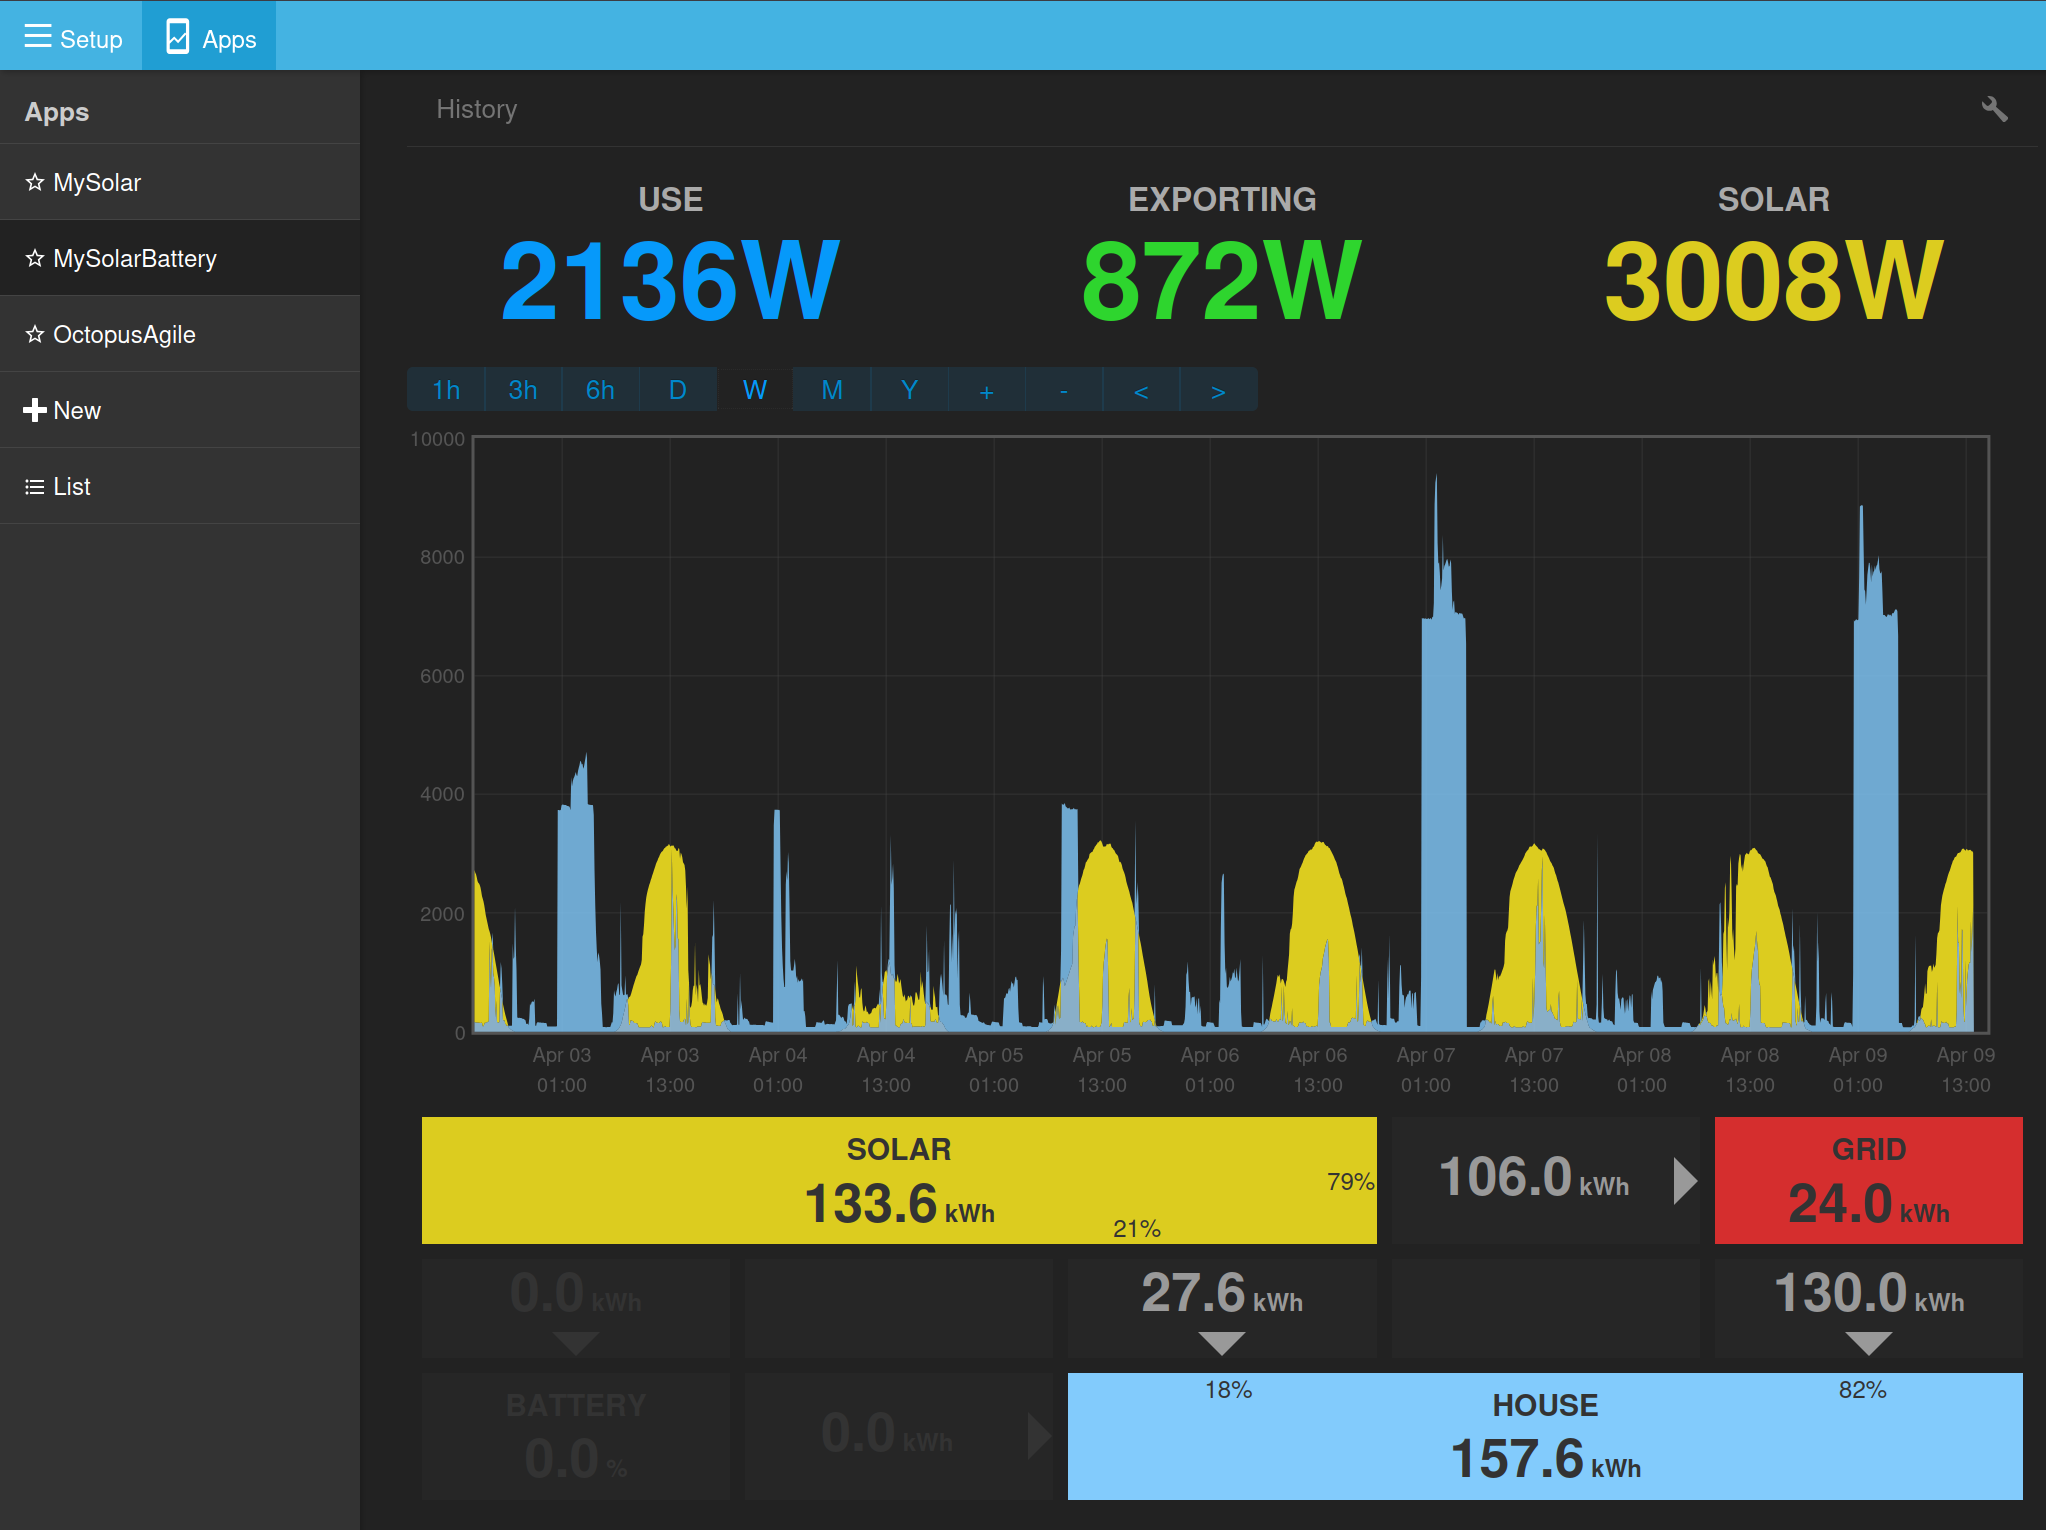
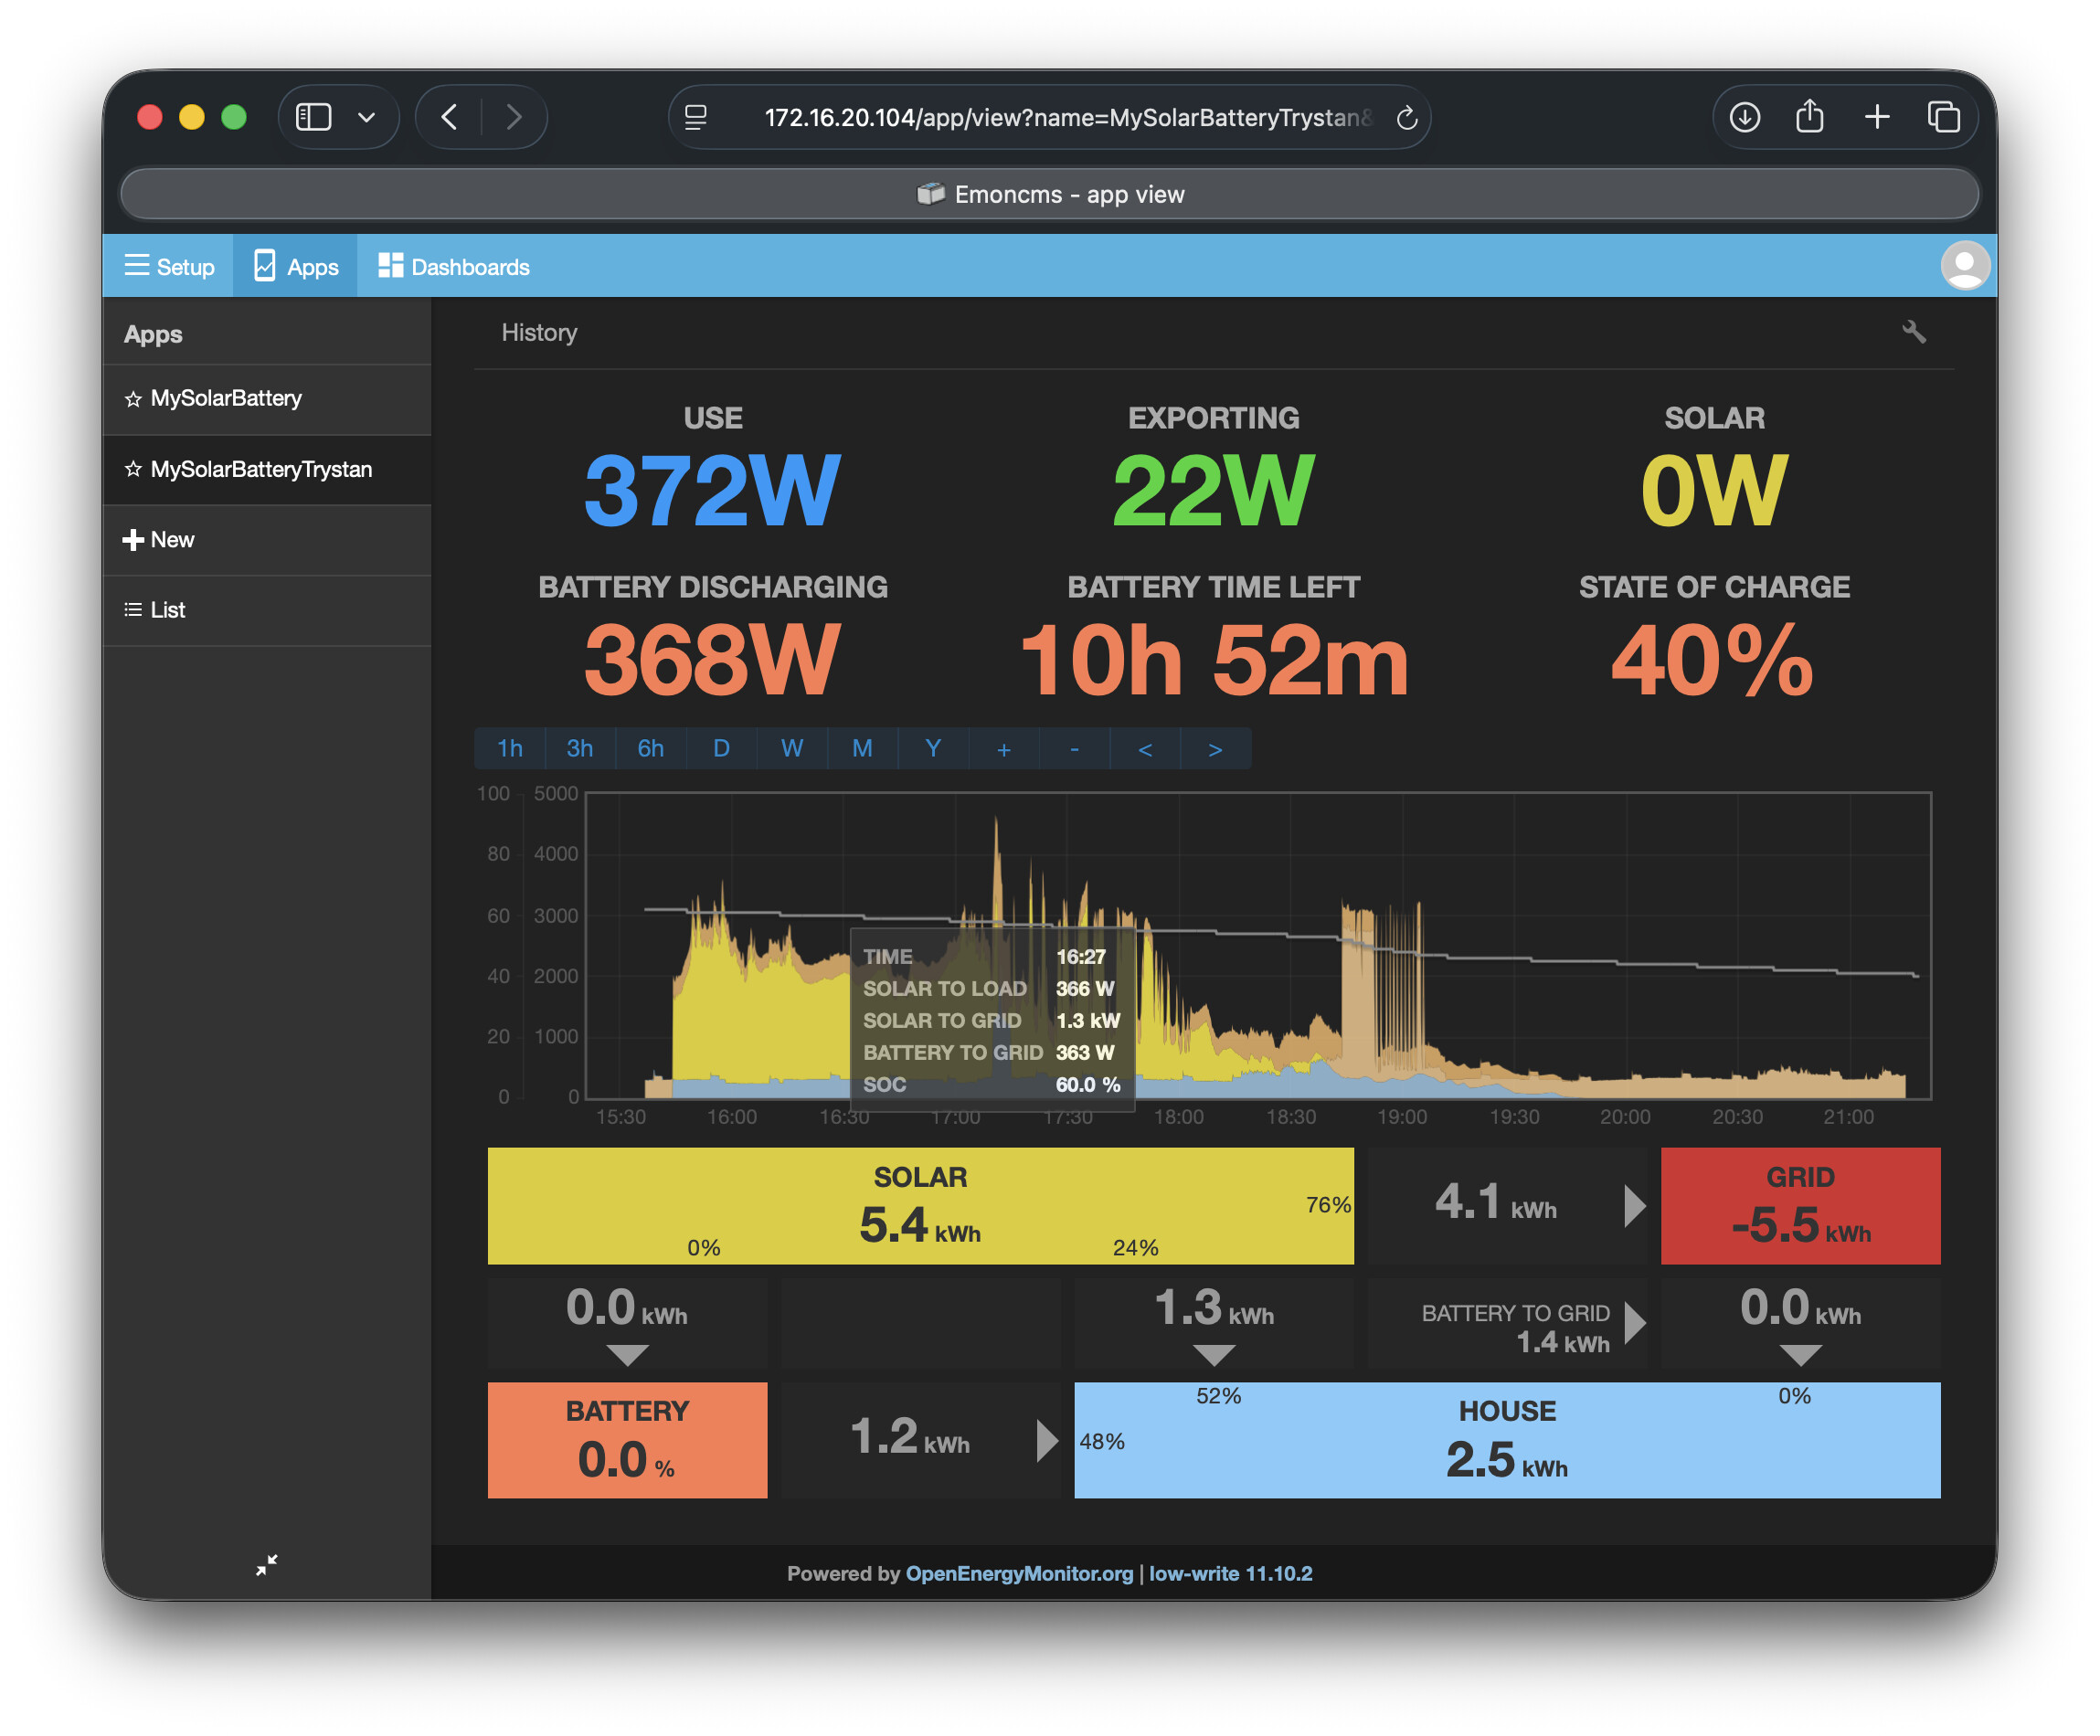
…is incorrect: solar to load should be 0, so should battery to grid, but battery to load should be 360-ish; presumably solar to grid should be 1.3 + 0.36-ish. To explain: I am on Octopus Go and Octopus Outgoing, so during the day/peak Go time I (usually) run the house exclusively from battery, all the solar gets exported. Then I recharge the battery on the cheap overnight rate.
So the issue is in the definition of the ‘use’ feed, I think…
You’re seeing some solar to load watts, plus the same battery to grid watts, when you’re expecting all solar to go to the grid. The numbers are the same, but the app doesn’t know which has priority so it looks peculiar. I think your feed is fine.
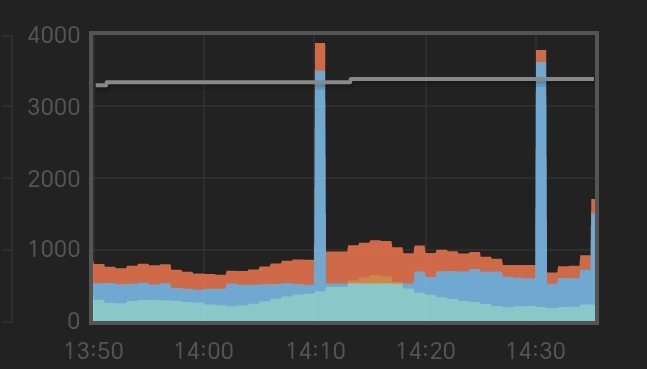
I have the same “problem” during the charging period. I have some solar to battery, but I also have the entire load pulled from the grid. The chart stacks them in the order solar use + grid use + grid charge, when reality is 100% grid use + solar charge.
Yes @Timbones I think you are right. There are essentially multiple solutions to the problem, only one of them is “correct” for your given scenario but other solutions are not incorrect either. I recall this kind of brain-teaser when I tried to modify the app to include divert and graph it as a separate element; it never worked correctly in all cases. It’s a logic problem, not a prgramming one.
Further thought: @TrystanLea I applaud your simplification of the inputs to the app, but perhaps an additional input (or maybe more) would help to allow you to accurately display the “correct” situation? Not necessarily a power feed, but a strategy switch such as Tesla have in the Powerwall control app: ‘Energy exports’ can be either ‘Solar’ (system sends only solar energy to the grid during high-value time periods. Stored Powerwall energy will serve home loads) or ‘Everything’ (system sends solar and stored Powerwall energy to the grid during high-value time periods). It amounts to a prioritisation matrix. Or maybe this is over-complicating it.
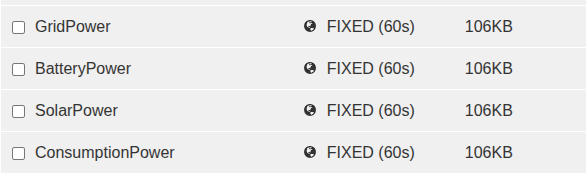
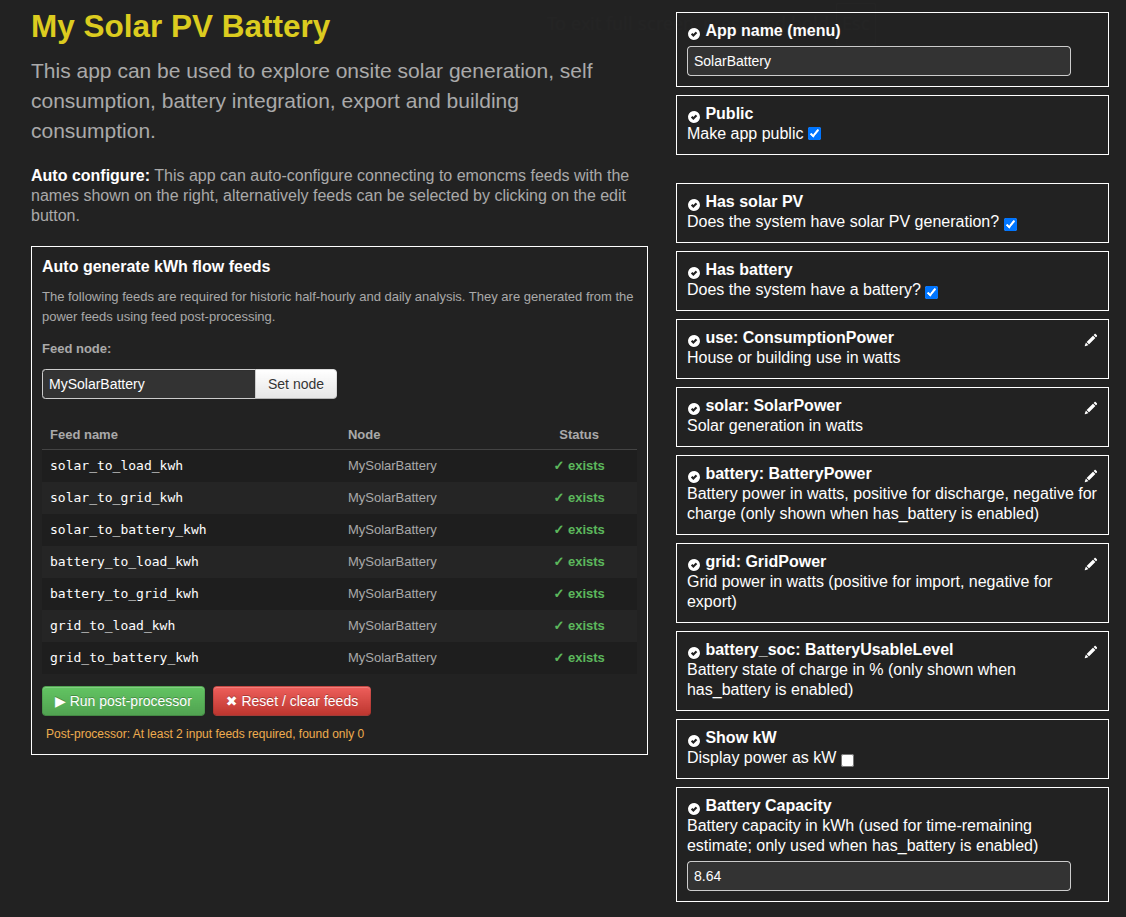
Are you using feeds: solar, use and battery power? with grid being derived in the app? (The app can derive 1 out of the 4 feeds if you have one missing). It looks like you might not have grid (import positive and export negative) recorded as a feed? but you have your derived use feed via input processing instead?
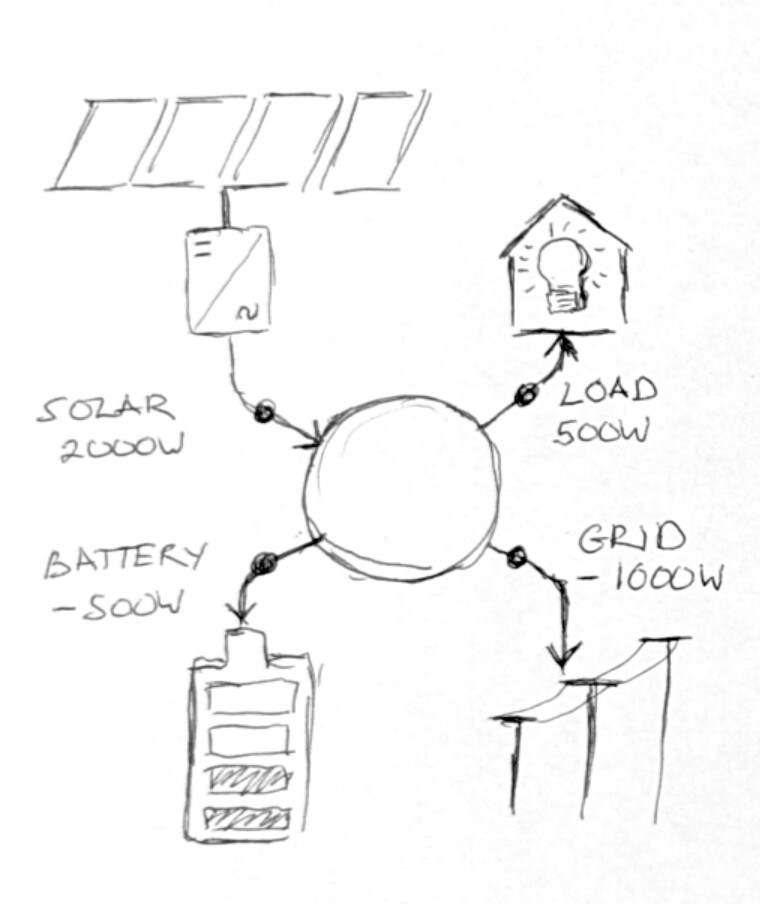
On a conceptual level this might help, the new apps are designed to use the following measurement points:
Everything below the zero axis is charging the battery, everything above USE line is exported.
Side question: tariff app accepts meter_kwh_hh feed, for half hourly data - what is this used for, and is it needed if you have 3 or 4 of the main power feeds?
I had specified all 4 feeds to the app, all except ‘use’ are logged directly from the inputs of the emonpi and an emontx3; emonpi power1 is grid, emonpi power2 is solar, emontx3 monitors the battery. The ‘use’ feed is derived in the emonpi’s power1pluspower2 input processing; it subtracts the battery’s contribution.
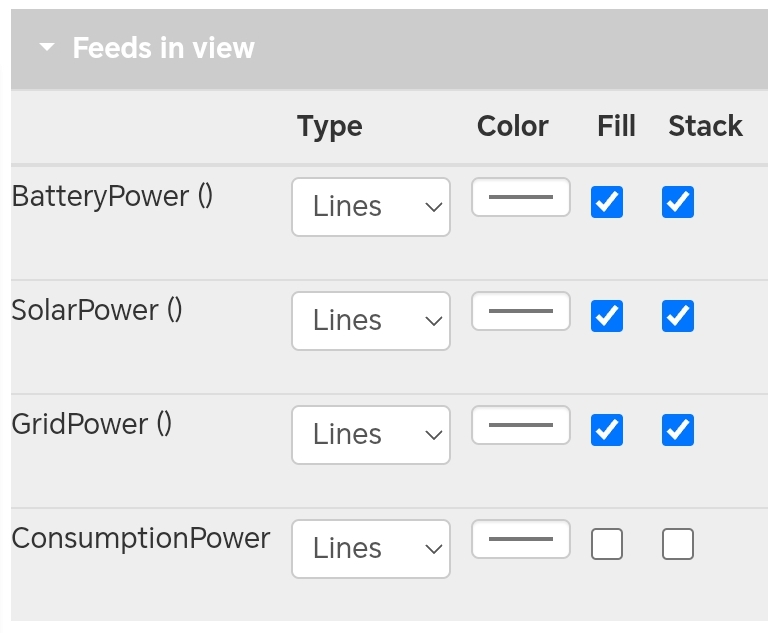
So, based on your explanation that only 3 were required, I disabled the ‘use’ feed in the app, it being the one I had doubts about, leaving the other 3 as feeds which are essentially raw inputs. I reset/cleared the post processed feeds and then ran the post-processor again. Post-processing takes 5 minutes or so… [Do you have to do this each time you want to have the history display updated? Also, do you need to wait for the post-processing to be finished before launching the app? I did but don’t think it’s necessary…]
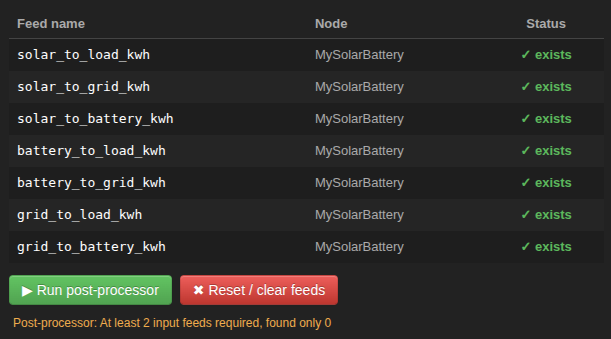
That didn’t work. The ‘USE’ display shows no digits and the graph is empty.
So I tried again creating a new app from scratch with a new Node, in case there was a problem with clearing and recreating the post-processed feeds. Same result.